Determinants of Mergers and Acquisitions:
The Influence of Executive Compensation and
Risk-Taking Incentives
Paulo Henrique Santos Gonçalves
Determinants of Mergers and Acquisitions:
The Influence of Executive Compensation and
Risk-Taking Incentives
This dissertation is submitted in partial fulfilment of the degree of Master of Science in Finance in Católica Porto Business School
by:
Paulo Henrique Santos Gonçalves
under the guidance of
Dr. Manuel Ricardo Fontes da Cunha
Resumo
Esta dissertação discute a relação entre a compensação de executivos e os incentivos de risco sobre fusões e aquisições, ou seja, a influência que têm a respeito da conclusão de um acordo de fusão e aquisição (F&A). Eu sugiro, com base na minha revisão de literatura, que as componentes individuais da compensação dos executivos, que são à base de dinheiro ou capital próprio, têm um impacto positivo na conclusão de uma F&A. Além disso, eu sugiro que a compensação executiva tem uma influência positiva na diversificação corporativa. A amostra usada na análise econométrica inclui 2,581 fusões e aquisições concluídas entre 1995 e 2007. Os meus resultados suportam a hipótese de que as opções sobre ações induzem tomadas de risco e, portanto, têm uma influência positiva sobre a conclusão de F&A. As compensações através de bónus têm também um impacto positivo. No entanto, o salário está apenas positivamente relacionado quando em conjunto com outros elementos de compensação. Por outro lado, de acordo com os resultados obtidos, os planos de incentivo de longo-prazo são o oposto da respetiva hipótese, visto que o sinal obtido é negativo, e as ações restritas não têm uma relação com fusões e aquisições na maioria dos modelos estudados. Por fim, eu crio uma pequena amostra, cuja análise sugere que as compensações dos executivos das empresas com baixo nível de diversificação têm um crescimento mais elevado após uma F&A do que as empresas com maior nível de diversificação. Por isso, as empresas com baixo nível de diversificação, em comparação com as empresas de maior nível, têm maiores incentivos associados à compensação dos executivos para adotar uma estratégia de diversificação corporativa.
Palavras-chave: compensação executiva; diversificação corporativa; fusões e aquisições; risco
Abstract
This dissertation discusses the relationship between executive compensation and risk-taking incentives on mergers and acquisitions, i.e. their influence in the completion of M&As. I hypothesise that the individual components of executive compensation which are either cash-based or equity-cash-based have a positive impact on M&As. Further, I expect executive compensation to have a positive influence on corporate diversification. My sample includes 2,581 completed M&As between 1995 and 2007. My findings support the hypothesis that stock options induce risk-taking, and therefore, have a positive influence in the completion of M&As. Bonus compensation also has a positive influence, however salary it is only positively related when in combination with other individual compensation components. By contrast, long-term incentive plans go against what it is hypothesised and restricted stock has no relationship in most of the regressed models. Finally, after creating a small sample, I illustrate that compensation for executives from low diversified firms have a greater growth post-acquisition than those from high diversified firms. Therefore, low diversified firms comparatively to high diversified firms have more incentives associated with executive compensation to adopt a corporate diversification strategy.
Keywords: corporate diversification; executive compensation; mergers and acquisitions (M&As); risk-taking;
Table of Contents
1. Introduction ... 1
2. Literature Review and Hypotheses Development ... 4
2.1 Risk-Taking Incentives ... 5
2.2 Equity Compensation ... 7
2.3 Cash Compensation ... 10
2.4 Corporate Diversification ... 11
3. Empirical Analysis ... 13
3.1 Data Sample and Variables ... 13
3.2 Descriptive Statistics ... 15
3.3 Multivariate Analysis ... 17
3.3.1 Model Limitations………...23
4. Small Sample Analysis ... 24
4.1 Data, Description and Analysis ... 24
4.2 Definitive Proxy Statements ... 29
5. Conclusion ... 31
References ... 33
List of Figures
Figure 1: Executive Compensation before and after a M&A deal ... 26 Figure 2: Executive Compensation for Manufacturing and Finance, Insurance and Real Estate Firms ... 27 Figure 3: Executive Compensation for High and Low Diversified Firms ... 28
List of Tables
Table 1 Descriptive Statistics ... 16 Table 2 Logit Regression of Deal Dummy on Executive Compensation and Risk-Taking Incentives ... 19 Table 3 Logit Regression of Deal Dummy on Combinations of Executive
1
1.
Introduction
Mergers and acquisitions1 (M&A) have been a key strategic instrument in growth
and value creation for decades. We can separate the M&A activity into six waves (Edgren and Martinson, 2012). The first (1897-1904) consisted of horizontal mergers2
and began due to a need of economic expansion since there was a major technological and economic upheaval. The second wave (1916-1929) started because there was a need of economic recovery which resulted in the introduction of better antitrust laws, and subsequently, allowed for the emergence of vertical mergers3. The third wave was
due to the rise of conglomerate mergers which occurs when firms in unrelated businesses merge in order to allow the firm’s growth and reduce the volatility of their revenues (1965-1969). The fourth wave (1981-1989) was comprised of congeneric mergers4, corporate raiding5 and hostile takeovers which was caused by the
deregulation of financial markets. The fifth wave (1992-200) was because of the increase in cross-country mergers in a period where there was a strong economic growth. Finally, the sixth wave consisted of the use of private equity as a mean of payment and the high number of leveraged buyouts (LBOs) between 2003 and 2008. Hence, we can conclude that the main motivation for mergers and acquisitions is growth, and subsequently, creation of value, which can result from seeking improvements in firm performance (Erel et al., 2012). Other view is that mergers and acquisitions occur to lower costs, and yet increasing profit margins and shareholder’s wealth (Bradley et al., 1988). M&As are also important as a mean to increase market power (Röller et al., 20006), technology innovation, synergies (Bradley et al., 1988)
and diversification (Berger and Ofek, 1995; Lang and Stulz, 1994). Therefore, M&A has a major impact on firm performance. In fact, Healy et al. (1992) examine the
1 A merger refers to the absorption of one firm by another, where the acquiring firm retains its identity
and acquires all assets and liabilities of the acquired firm. After the merger, the acquired firm ceases to exist as a separate entity. A consolidation is like a merger, but an entirely new entity is created.
2 A horizontal merger occurs between firms that operate in the same business, and since competition
could be high, synergies and potential gains in the market share are a good motivation.
3 A vertical merger occurs between two companies that operate at separate stages of the production
process for a specific output to increase synergies and the operation efficiency.
4 A congeneric merger is when two firms in the same business merge, but they produce different outputs. 5 Corporate raiding occurs when an investor buys a high percentage of shares of one firm who is
considered undervalued, and the investor by using its voting rights can lead the firm to better results.
6 Röller et al. (2000) supports that firms increase their market power by exploiting economies of scale
2
acquisition performance of merged firms using a sample of 50 large deals in US between 1979 and 1983. They find that the merged firms have significant improvements in asset productivity, and consequently, their operating cash flows grew.
Further, it is globally accepted that firm performance also has a relationship with executive compensation (Murphy, 1999). Most of the executive compensation literature has focused on the relation between chief executive officers (CEOs) and shareholders’ wealth, e.g. Smith and Watts (1984) find that compensation plans are bonded to firm performance measured as stock’s returns. Jensen and Murphy (1990) discuss that CEOs with higher pay-performance sensitivity have more incentives to create wealth for shareholders. Murphy (1985) shows a positive relation between the compensation of top executives and firm sales’ growth. If the compensation contract is mostly bases on equity compensation, this one is highly tied to the firm’s stock return. However, executives might undertake managerial decisions that reduce firm’s risk to reduce their compensation risk (Amihud and Lev, 1981; Jensen and Meckling, 1976), which would be prejudicial to shareholder’s wealth. Therefore, executives’ pay and shareholders’ interests should be aligned. Carpenter and Sanders (2002) suggest that top managers’ pay can positively contribute to firm performance if it is aligned with shareholders’ interests and key political and strategic contingencies that the firm has. Thus, we can conclude executive compensation can be an important variable in firm performance. For this reason, there is also a relation between M&A and executive compensation. One branch of literature about executive compensation associates it to how it affects managerial decisions such as investments, like acquisitions (Datta et al., 2001) or policy choices (Coles et al., 2006). Datta et al. (2001) document a positive and significant relationship between acquiring executives’ equity-based compensation and stock price performance around and following acquisition announcements. Also, Bliss and Rosen (2001) demonstrate that executives’ compensation usually increases after bank mergers even though firm performance might diminish.
This dissertation contributes to a long line of research on the motives for completing mergers and acquisitions deals through executive compensation and risk-taking incentives. My sample consists of 2,581 unique M&A deals that were completed between 1995 and 2007 and I use a logit regression model to conduct my main set of analyses. Similar to previous literature, I find that bonus compensation and
3
stock options compensation are significantly and positively related to the managerial decision to complete a M&A. Other results show that contrary to previous studies, there is no relation between risk-taking incentives and investment decisions like M&A. Moreover, my third hypothesis that refers that equity-based compensation has a positive relationship with the completion of M&As only partly holds, since not only long-term incentives plans are negatively related to it restricted stock coefficient is only positive and statistically significant when I regress with all main independent variables (risk-taking incentives and all compensation components).
My research is complemented with a small sample qualitative analysis. Using a subsample of 24 firms from the manufacturing and financial industry I look for evidence if firms increase their executives’ compensation as a result of corporate diversification. Results seem to indicate that executives from low diversified companies have more incentives to diversify than those from high diversified firms.
This dissertation proceeds as follows. In section 2, I discuss relevant literature on executive compensation and risk-taking incentives in the completion of mergers and acquisitions. Five hypotheses are presented. In section 3, I explain my data sample selection as well as the results of econometrical analysis. In section 4, I come forward with empiric evidence on the fifth hypothesis suggest, with accompanying analysis of my small sample of information gathered. Section 5, presents the conclusion of my work.
4
2.
Literature Review and Hypotheses Development
To allow a discussion on the impact of executives’ compensation and risk-taking incentives in mergers and acquisitions, I first review the relevant academic literature to examine their relationship. Secondly, I revise the literature about the main independent variables, which are the executive compensation components and the proxy used for risk-taking incentives. This literature review will guide my econometrical analysis. Finally, I review the literature on corporate diversification and how executive compensation is linked to it. Within the analysis of the related literature, I develop and present five hypotheses.
M&As are assumed to be important investment decisions. A significant part of the academic literature examines how the incentives provided through compensation schemes affect managerial decisions, and subsequently, firm performance. When managerial effort cannot be observed there should be a link between executives’ compensation and a proxy for effort which is usually a measure of firm performance (Holmstrom, 1979). Indeed, the principal-agent model explains how shareholders should bond executives’ pay to firm performance, so that they have incentives to increase firm’s value and overcome agency costs (Holmstrom, 1979; Jensen and Meckling, 1976). Smith and Stulz (1985) support that if managers do not have incentives via their compensation structure, they may forgo positive net-present-value (NPV) projects that would increase firm risk. This issue is worse with firms that have considerable growth opportunities (Guay, 1999). Likewise, Low (2009) finds that managerial risk aversion is a severe agency problem which leads managers to managers reducing firm risk at the cost of shareholders’ wealth. For this reason, Smith and Watts (1992) defend that under these circumstances, managers’ wealth is expected to be linked to firm performance to avoid it. Jensen and Murphy (1990) have evidenced that the pay-performance sensitivity (delta) in managerial compensation contracts is too low to provide managers with significant incentives to act accordingly to shareholders’ interests. However, Hall and Liebman (1998) argue that those values are understated and show that the pay-performance sensitivity in managerial compensation contracts rose in the 1990s due to the fast growth of lucrative and safe alternatives in the stock market such as stock options.
5
Furthermore, academic literature also focuses on how stock options induce risk-taking. Amihud and Lev (1981) and Smith and Stulz (1985) debate that because managers have undiversified wealth tied to the firm, they might forgo positive NPV projects that would increase firm risk and provide benefits for shareholders. Nevertheless, shareholders can reduce this agency problem, and its respective costs, by structuring managers’ compensation as a convex function of firm performance, resulting in managers’ wealth increasing with the volatility of firm stocks return. Smith and Stulz (1985) and Hirshleifer and Suh (1992) show that executive compensation plans which are convex functions of firm value provide risk-taking incentives for managers. Similarly, Guay (1999) supports that the convexity of the manager’s wealth-performance is positively related with risk-taking proxies, such as measures of growth opportunities and research and development (R&D) expenses. On the other hand, Lambert et al. (1991) and Amihud and Lev (1981) argue that undiversified and risk-averse managers may become more risk risk-averse if awarded with stock options.
Empirical research suggests that the most common determinants of executive compensation are firm size and firm performance measured by the stock returns (Murphy, 1999). Murphy (1999) also highlights that firms set compensation by looking at the compensation their peers’ executives receive, and therefore size which can be increased by acquisitions is a determinant for which peer group they belong. To conclude, executive compensation is a significant determinant in terms of understanding how managers make their decisions, if it makes them more risk-averse or not, and their openness to laborious deals such as M&As. This line of research will be further developed in the following sections and in my subsequently empirical analysis.
2.1 Risk-Taking Incentives
Risk-taking incentives are important in executives’ compensation plans, since equity compensation exposes them to unsystematic risk, and thus risk-averse managers will seek ways to reduce firm’s risk, even if destroys value (Amihud and Lev, 1981; Low, 2009). Therefore, risk-taking incentives are important to align with shareholders’ interests (Smith and Stulz, 1985). Most authors such as Coles et al. (2006), Guay
6
(1999) and Low (2009) use vega7 as a measure for executives’ risk-taking incentives.,
except for Lambert et al. (1991) who use manager’s expected utility with respect to stock return volatility as a proxy for risk-taking incentives. Guay (1999) finds that stock’s return volatility is positively related to the convexity provided to managers, and for this reason convexity provides incentives that influence financing and investments decisions. Lambert et al. (1991) and Carpenter (2000) observe that stock options increase the convexity of executives’ payoff by increasing the sensitivity of executives’ wealth to changes in stock returns and increase the sensitivity of executives’ stock and options portfolio to a 1% increase in stock’s price (delta). Low (2009) provides evidence that risk reduction destroys value. So, high sensitivity of executives’ wealth to stock’s return volatility helps align risk-taking behaviour in accordance with shareholders’ interests, because most managerial decisions that decrease risk happen when vega or delta from companies’ managers are low. Also, the author refers that probable adverse effects that occur after legislation changes can be mitigated by high vega. In addition, Guay (1999) finds that increased delta exposes managers to higher risk and increases executives’ risk-aversion, but high vega can balance it. These findings, support that equity incentives, essentially vega8, help
overcoming managerial risk-aversion, which leads executives to reduce firm risk, as well as inducing risk-taking.
Furthermore, the existence of risk-aversion can have big impact on managerial decisions, and consequently, managers could avoid risky projects with positive net present value (NPV), and therefore, equity-based compensation is known as a method to align managers’ interests to shareholders’ interests (Jensen and Meckling, 1976). Smith and Stulz (1985) suggest that stock options compensation influences risk-taking behaviour due the value of stock options increasing as stock returns volatility increases. On the other hand, Carpenter (2000) discusses that if equity compensation can increase executives’ wealth sensitivity to stock returns volatility, then it does not mandatorily bring a higher risk-taking behaviour. So, I can conclude that there is a
7 Vega is the sensitivity of executives’ wealth to the volatility of stock returns.
8 Most research focus on vega because delta as a proxy for CEOs pay-performance sensitivity has
ambiguous effects, since high delta can lead to a greater CEO effort, and subsequently, they undertake riskier and positive NPV projects, but also because high delta expose them to higher firm-specific risk, and therefore increases risk-aversion (Amihud and Lev, 1981; Smith and Stulz, 1985).
7
relationship between risk-taking and executive compensation, although it is inconclusive if it is positive or negative.
In the context of mergers and acquisitions and the impact risk-taking incentives on it, Armstrong and Vashishtha (2012) suggest that vega gives managers incentives to increase risk through corporate acquisitions, whereas Kini and Williams (2012) do not find a relationship between risky managerial decisions and risk-taking incentives provided by vega. Coles et al. (2006) present evidence of the relationship between the structure of executive compensation and managerial decisions (e.g. investment and policy choices) through risk-taking incentives that are vega controlled for delta. The authors find that higher prior vega implements riskier policy choices, such as more investment in R&D, less investment in property, plant and equipment (PPE), more firm focus9 and higher leverage. They also find that riskier policy choices lead to
executive compensation with higher vega and lower delta. Moreover, M&As are risky investments because its net present value is uncertain and Datta et al. (2001) find that CEO’s risk-taking incentives affect firm’s long-term investment policies and assumes M&As as important corporate investment decisions. Therefore, it is plausible to conclude that risk-taking incentives influence the decision to complete a M&A deal. Following this line of research, I elaborate my first hypothesis:
Hypothesis 1: Risk-taking incentives, controlling for executives’ pay-performance sensitivity, will have a positive impact on the managerial decision to complete M&As.
2.2 Equity Compensation
The typical shareholder is diversified, however, risk-averse and undiversified managers have their firm as the major source of risk in their portfolio, and consequently, they might forgo positive NPV projects who would increase firm risk, increasing the chances of destroying firm value, and therefore, stock awards and stock options are used to align executives’ incentive to shareholders’ interests to overcome risk-aversion and maximise firm value (Hall and Liebman, 1998; Jensen and
9 Higher firm focus is typically achieved by selling unrelated assets to other firms or by spinning off
8
Meckling, 1976). Lambert (1986) adds that lower observability of executives’ effort might increase agency costs, but increasing executives’ risk can mitigate those costs. He also suggests that compensation contracts highly based on cash flows can result in a misalignment of interests and even induce managers to overinvest in risky projects. So, an optimal amount of equity-based compensation is essential to monitor executives.
It is globally accepted that using stock options as compensation shields the managers from the downside risk because it can be used as a call option and it will be profitable when the stock’s price exceeds the strike price. Also, sometimes there is a vesting period before options can be exercised which might incentivise managers to take the long-term perspective in their decisions. Also, equity-based compensation can influence managerial decisions by tying executives’ wealth to firm risk and performance (Guay, 1999), where the sensitivity of executives’ wealth to firm risk is captured by vega and might induce riskier investment choices that bring benefits due to the changes in stock’s return volatility they cause, while the sensitivity of executives’ wealth to firm performance is captured by delta and might induce executives to undergo value-enhancing decisions. Prior academic literature discusses how stocks and stock options provide incentives for risk-averse managers to prompt them to invest in risky projects on behalf of risk-averse shareholders (Guay, 1999; Hirshleifer and Suh, 1992; Jensen and Meckling, 1976; Smith and Stulz, 1985) like acquisitions (Datta et al., 2001).
Cohen et al. (2000) find that there is a relationship between an increase in managers’ stock options holdings and subsequent increases in firm risk. This is explained by the expected increase of stock options’ payoff associated with the stock’s return volatility (Smith and Stulz, 1985). Agrawal and Mandelker (1987) find that managers whose firms stock’s return volatility increased after an acquisition had more equity-based compensation which prompt them to undertake more high-risk investments and Sanders’ results (2001) suggest that stock options are positively related to the number of acquisitions made by the respective firms. Furthermore, Smith and Watts (1992) examine that growth opportunities within the firm difficult the alignment of interests between shareholders and managers. They find that firms with numerous investment opportunities tend to use more stock options as compensation to incentivise managers to maximise shareholders’ wealth by linking their wealth to firm
9
value. Later, Guay (1999) shows that incentives given by stock options are positively associated with firms’ investment opportunities. Datta et al. (2001) posits a positive relation between equity-based compensation from the firm’s top executives, measure as a percentage of total compensation, and the firm’s stock returns around the acquisition announcements and have evidence that stock returns’ volatility has greater changes post-acquisition. Based on this discussion, I conclude that there is a relationship between stock-options, risk-taking and firm performance, and therefore, I formulate my second hypothesis:
Hypothesis 2: Stock options will display a positive relationship regarding the completion of a M&A deal.
A significant part of literature focuses on compensation elements that have convex payoffs (e.g. Guay, 1999). One of those elements is stock options, but direct stock compensation, e.g. restricted stock10, can also add convexity (Core and Guay,
1999). Even though restricted stock effects remain unclear, its usage has been increasing (Murphy, 2012), since they offer a long-term payoff and a limited vega. Long-term incentive plans usually comprise of stock options, restricted stock and performance plans. Restricted stock is related to the stock’s price, since executives receive common stock with restriction on sale with a vesting period to incentivise them to stay at the company, provides incentives for managers to improve firm performance at the expense of exposing their wealth, and consequently, might increase risk-aversion (Smith and Stulz, 1985). On the other hand, performance plans are related to rewards executives receive when they meet specific goals over the pre-determined period (Larcker, 1983). Also, stock options and restricted stock require no cash payout, so companies with any cash constraint could use these types of compensation as a substitute for cash (Core and Guay, 1999).
Further, Chi and Johnson (2008) examined the relationship between restricted stock and corporate acquisitions. The authors find that longer holding periods of stock are positively tied to higher acquisition announcements and higher post-merger profitability, increasing shareholders’ wealth. These effects are explained by the fact that after long-term decisions (e.g. corporate acquisitions) are made, while having
10
access to private information, and its results known, restricted stock incentives are beneficial. This research and findings induced me to infer my third hypothesis:
Hypothesis 3: Restricted stock and long-term incentive plans will have a positive impact in the completion of a M&A deal.
2.3 Cash Compensation
Salary is a fixed compensation, and therefore its effects on manager’s effort and performance it is irrelevant. Moreover, salary only constitutes one part of executive compensation (Murphy, 2012). A bonus, another form of compensation, is a payoff that depends on manager’s performance, generating an indirect link between their wealth and shareholders’, aligning their interests.
Guay (1999) and Core et al. (1999) debate that executives with higher cash compensation can invest more outside their firm, being more diversified, and consequently, less risk-averse. Prior literature also argues that firm size has a significant and positive relationship with CEO compensation (Jensen and Meckling, 1976; Jensen and Murphy, 1990). Thus, executives might decide to proceed with a M&A deal to demand more (cash) compensation (Bliss and Rosen, 2001; Core et al., 1999). Conyon and Gregg (1994) study the determinants of remuneration by analysing a sample with the highest paid CEOs from UK companies and their results is that acquisitions lead to a premium pay (e.g. bonuses). Grinstein and Hribar (2004) study CEO compensation for completing M&A deals. To examine the acquisition effect on CEO bonus, they use an Acquisition Dummy variable that equals one if the firm did an acquisition in that year which deal was worth at least $1 billion. The subsequent econometrical analysis suggests that the acquisition dummy is significant and positive, implying that firms are willingly to pay higher bonuses if in doing so the business performance of the enterprise is measurably higher. Considering this, my fourth hypothesis is:
Hypothesis 4: Cash-based compensation, like salary and bonus, will display a positive relationship towards the completion of a M&A deal.
11
2.4 Corporate Diversification
Diversification is generally known as a corporate strategy to enter a new market or industry in which they do not operate. However, it can occur to increase growth opportunities, for more efficient usage of existing resources and capabilities in the current production processes, to either escape from unattractive industry environments, to increase market power in a desirable industry or make use of surplus cash flows. Even so, its main purpose is to maximise firm’s value, and therefore, the combined value of the firm after an acquisition has to be greater than the value of both firms prior to the acquisition which can be accomplished through synergies (Bradley et al., 1988). Prior literature demonstrates that these synergies can be achieved by exploiting economies of scale that decreases unit costs with increases in production, by efficient allocation of capital or by exploiting economies of scope. Moreover, corporate diversification can increase debt capacity (Lewellen, 1971) and reduce firm risk (Comment and Jarrell, 1995).
Prior literature focuses on how corporate diversification creates (destroys) firm’s value, the benefits managers gain and the agency costs created or intensified due to corporate diversification. Stein (1997) suggest that managers with private and superior information can better select investment decisions that increase firm value. Caves (1971) uses this assumption to justify geographical diversification. Kim and Lyn (1986) and Morck and Yeung (1991) provide evidence that geographical diversification and firm value have a positive relationship. Lang and Stulz (1994) and Denis et al. (2002) suggest otherwise, demonstrating that geographical diversification is associated with value destruction and Do Santos et al. (2008) discusses that only unrelated diversification destroys value, whereas related diversification is value-enhancing which can be explained because of the accepted motive for related diversification being the potential economies of scope that arise when the total cost of producing two or more outputs is less than the sum of the cost by producing each output in a separate process. These previous authors also discuss that if firms merge or acquire “fairly value” international corporations where there is not a premium pay, they do not destroy value. Aggarwal and Samwick (2003) argue that diversification is caused by the relation between manager’s private benefits and the management of a diversified firm, and not by the effects it may have in the reduction of firm risk. So,
12
whether diversification is creating (Morck and Yeung, 1991) or value-destroying (Lang and Stulz, 1994; Berger and Ofek, 1995; Denis et al., 2002), the determinants that conduct managers to use corporate diversification strategies is unclear. Therefore, we will analyse executive compensation impact on this managerial decision based on M&A deals.
Agency costs can arise when managers have incentives to take advantage of shareholders through diversification to increase their private benefits. One of those reasons could be more compensation as the latter is related to firm size (Jensen and Murphy, 1990). Jensen (1986) suggests that managers which firms have excess cash flows expand more, increase the size of the firm they “control” so that they entrench as the firm requires their expertise (Shleifer and Vishny, 1989). Furthermore, Rose and Shepard (1997) examine the relationship between executive compensation and corporate diversification. They find that executives of diversified firms (with two distinct segments) receive, on average, a higher 13% salary and bonus than managers of undiversified firms. Amihud and Lev (1981) discuss that diversification drives executives to undertake M&A deals, and hence increasing their personal benefits, even if synergies are not positive (Thijssen, 2008). Therefore, diversification can be a strong determinant in M&A decisions. Following this prior literature, I will test the following hypothesis:
Hypothesis 5: High-diversified firms have, comparatively with low-diversified firms, more compensation incentives for managers to adopt corporate diversification strategies.
13
3.
Empirical Analysis
In this section, I test my hypotheses using a panel dataset and logit regression models. I begin by explaining my data sample, the variables I use and present their summary statistics. Next, I use regression models to test the validity of my developed hypotheses 1 to 4. Potential limitations of my research are also debated.
3.1 Data Sample and Variables
Information on M&As was collected from GSIOnline database11 from 1995 to
2007. The start date (1995) and the end date (2007) are, respectively, the first and last year for which M&As data is available at the database. The database includes 64749 M&A deals that were completed within the specific sample period. I then exclude 38,318 duplicates in accordance to the merger number and 1,848 deals which transaction value is unknown. My final sample includes 24,583 M&As.
To test the impact of executive compensation and risk-taking incentives regarding the completion of M&As we need data which I collect from Compustat ExecuComp12
database as well as firm-specific data from Compustat13 database. Then, I merge all
my data samples and construct my dependent variable, Deal Dummy, which takes the value 1 if an executive in a given firm and year completed a M&A deal or 0 otherwise. My final sample includes 2,581 unique M&A deals which were a result of managerial decisions from 15,913 managers and which respective firms are constituents of 63 different industries based on the unique double-digit Standard Industry Classification (SIC) code within the sample period.
I capture risk-taking incentives through vega, which I define as the as the change in dollar value of executive’s wealth for a 1% change in the volatility of stock returns. It is computed accordingly to how Guay (1999) does, which is based on the Black-Scholes’s (1973) method for the option valuation, modified to account for dividend
11 Mergers and Acquisitions database that cover changes in control transactions as well as significant
acquisitions or sale of assets, equity, subsidiaries or business divisions. It is owned by Thomson Reuters and only comprises data between 1995 and 2007, which for more recent deals interested researchers should access Thomson Reuters SDC Platinum Database.
12 Database that has data on executive compensation for S&P 1000 firms from 1992 to present. 13 Database that contains fundamental financial and price data for publicly US traded companies from
14
payout by Merton (1973). Next, I follow Hayes et al.’s (2012) method to compute the yearly proportions of dollar compensation which will be used to capture executive compensation incentives. First, I compute the value of cash compensation as the sum of salary and bonus14. Afterwards, I add the value of current options, current restricted
stock and current long-term incentive plans to obtain the yearly total compensation. Finally, I compute the compensation components in relation to the yearly total compensation and obtain the proportion of salary (P(Salary)), proportion of bonus (P(Bonus)), proportion of stock options (P(Options)), proportion of restricted stock (P(RestrStock)) and the proportion of long-term incentive plans (P(Ltip)).
To account for possible endogeneity issues, where the independent variable might cause the dependent variable due to other omitted variables, I control for various firm-specific information, to separate the effects of the compensation elements used as well of the risk-taking incentives. To control for one of my main dependent variables, vega (as a proxy for risk-taking incentives), I follow Coles et al. (2006) and include executives’ pay-performance sensitivity (delta), which I define as the sensitivity of CEO’s option value with respect to 1% change in stock price. Similar to other authors, I control for capital structure, investment opportunities, liquidity, policy measures, profitability and stock performance (e.g. Core et al., 2008; Coles et al., 2006). Prior literature debates that firm size has a positive relation with executive compensation, since by increasing firm size, executives can demand more compensation for managing a larger firm (Bliss and Rosen, 2001; Core et al., 1999). Also, Baker et al. (1988) find that executive compensation increases with firm size after an acquisition. Thus, I control for firm size15. Moreover, I include return on assets (roa) to control for
profitability and book-to-market ratio for investment opportunities. I control for firm performance through sales growth as well as through stock’s return volatility (volatility). Also, I control for liquidity since it is important for the firm to meet its short-term financial obligations. Therefore, following Coles et al. (2006) and Anderson and Core (2012), I include surplus cash due to firms with high values of it are more likely to complete acquisitions (Jensen, 1986) and a dummy variable for liquidity constraint (liquidity). On the other hand, executive’s liquidity is important too, and therefore I include it in accordance with Anderson and Core (2012) who
14 Bonus= bonus + non-equity incentives
15
define it as the proportion of executive’s cash compensation to non-cash compensation (executive liquidity). Furthermore, I control for firm policies since they can change firm risk (Coles et al., 2006). For this reason, I include diverse firm policy variables and proxies for growth opportunities such as leverage, R&D expenses, capital expenditures (capex) and PPE expenses (ppe). Finally, I also control for risk using the standard deviation of EBITDA/Total Assets (John et al., 2008). All variables’ information is the average of the 12 months to the completion date. Consistent with prior literature (Core and Guay, 1999; Guay, 1999), I winsorize all my variables at the 1st and 99th percentiles.
3.2 Descriptive Statistics
Table 1 presents the descriptive statistics for all variables: columns 1-3 for the pooled sample (mean, median and standard deviation), while columns 4-5 & 7-8 present the mean and median for the subsample based on the value the dependent variable takes. Columns 6 and 9 test the significance for the differences in the means and medians.
There are 5,624 managers who undertook the decision to complete a M&A deal. The lowest transaction value from my sample is the acquisition of US Based Managed Services Operations by the acquirer Bank One Corp (1.75 million) and the highest deal is the acquisition of Allegiance Corp by the acquirer Cardinal Health Inc (6,490 million). The average deal was completed with a transaction of 508 million.
On average, a typical executive receives 50.5% of total compensation in form of salary and 16.7% as bonus. Therefore, cash compensation consists of 67.2% of total compensation, whereas equity-based compensation comprises 32.8% with 26.7% regarding stock options compensation. Even though, there was a boom in the use of stock options (Hall and Liebman, 1998; Murphy, 2012), 30% of the executives from my sample do not receive any as pay (not tabulated). By contrast, other means of equity compensation such as restricted stock and long-term incentives are less used in comparison, 45% and 15% respectively (not tabulated), and its contribution is low
16
Table 1 Descriptive Statistics
The table presents the descriptive statistics of the data sample used. The sample comprises M&As completed between 1995 and 2007, which was split in two subsamples depending on the value the dependent variable takes. I do a T-test for the difference in the means and a Wilcoxom test for the difference in the medians. *, **, *** indicate significance at the 10%, 5%, 1% level, respectively.
Total Sample M&A No Deal M&A No Deal
(N=33,509) (N=5,624) (N=27,885) (N=5,624) (N=27,885)
Mean Median Std. Mean Mean Median Median
Dependent Variable Deal Dummy 0.122 0 0.327 1 0 - 1 0 Independent Variables Vega ($000s) 49,153 12,017 143,035 74,075 45,692 *** 16,633 11,566 *** P(Salary) 0.405 0.346 0.275 0.372 0.410 *** 0.307 0.350 *** P(Bonus) 0.167 0.123 0.178 0.169 0.166 *** 0.127 0.123 P(Options) 0.267 0.169 0.296 0.285 0.265 *** 0.183 0.166 *** P(RestrStock) 0.130 0 0.223 0.147 0.127 *** 0 0 *** P(Ltip) 0.031 0 0.115 0.027 0.032 0 0 *** Control Variables Delta ($000s) 17,935 2,546 58,606 28,895 16,412 *** 3,419 2,472 *** R&D 0.028 0 0.076 0.031 0.028 0.000 0.000 *** Capex 0.055 0.044 0.061 0.054 0.055 0.040 0.045 *** PPE 0.267 0.210 0.236 0.228 0.272 *** 0.141 0.219 *** Leverage 0.240 0.222 0.202 0.234 0.240 *** 0.229 0.221 ROA 0.084 0.037 1.676 0.027 0.092 0.037 0.037 Firm size 7.820 7.663 1.840 8.352 7.750 *** 8.075 7.620 *** Book-to-market ratio 0.660 0.654 0.270 0.635 0.663 *** 0.645 0.657 *** Risk 0.044 0.024 0.113 0.053 0.043 *** 0.267 0.024 *** Executive liquidity 0.493 0.49 0.259 0.465 0.497 *** 0.466 0.500 *** Liquidity 0.101 0 0.301 0.075 0.104 *** 0 0 ***
Deal size ($millions) - - - 508 - -
Log(sales) 7.347 7.342 1.644 7.643 7.301 *** 7.514 7.303 ***
Other characteristics
Volatility 0.430 0.3691 0.227 0.425 0.430 *** 0.357 0.371 *** Sales growth 0.002 0 0.665 0.093 -0.011 *** 0.000 0.000 *** Surplus cash 0.099 0.099 0.117 0.102 0.099 *** 0.097 0.100 ***
since the typical executive receives 13% of pay as restricted stock and 3.1% as long-term incentives plans. In long-terms of the subsamples’ values, compensation components are statistically different, except for long-term incentive plans, but economically speaking they have similar values, where the biggest difference is the prior proportion of salary received that it is 3.8% greater for executives’ that completed a M&A deal.
From the descriptive statistics, it is observable that for 1% change in the stock’s return volatility executive’s wealth either increases or decreases $49,153, while for 1% change in stock’s price executives’ stock options value increases or decreases $17,935.
17
Regarding my subsamples, although no conclusion can be drawn without an econometrical analysis, these observable values are in accordance with my first hypothesis, as executives from firms that completed M&As have prior high vega ($74,075) which it is also consistent with existing literature (e.g. Armstrong and Vashishtha, 2012; Coles et al., 2006; Low, 2009). So, high vega should align risk-taking behaviour in accordance with shareholders’ interests (Low, 2009). Moreover, prior executives’ pay-performance sensitivity is higher for executives that completed M&As, which goes in line with Jensen and Murphy (1990) who discuss that higher pay-performance sensitivity provides incentives to maximise shareholders’ value.
In relation to firm-specific characteristics, firms that completed M&As, comparatively to firms who did not, have prior higher firm size (both log(sales) and log(total assets)), sales growth and risk. However, they have economically lower return on asset, which could be a reason for undertaking M&As as the assets acquired could bring potential economies of scale or scope, less liquidity, and lower PPE expenses. As previously reviewed, academic literature usually uses PPE expenses, R&D expenses and capital expenditures as proxies to capture variation in firms’ investments and growth opportunities, and therefore, it is visible that prior to the M&A deal, firms had a low number of them.
3.3 Multivariate Analysis
To test the hypotheses that I developed I use logit regression models, since my dependent variable is binary (only takes the values 1 and 0), my aim should be to find out which determinants (explanatory variables) cause the explained variable to take on those values. In this situation, an OLS regression model, even if controlled for fixed effects, would not be the most suitable method to test my hypotheses due to the fact that my data sample might suffer from heteroskedasticity, so the resulting t-statistics would be biased and would not constrain the predicted values to lie between 0 and 1, the latter which I tested and found the existence of values below zero. Therefore, I test my hypotheses using logit regression models and it is computed through the following equation:
18
Where F(·) denotes the cumulative distribution function of the logistic distribution defined as F(x)=1/(1+exp{-x}), and the logit coefficients and the respective standard errors are estimated by the maximum likelihood technique. Moreover, I control my logit regression models for industrial and yearly fixed effects. Columns 1-7 of Table 2 present the results of the respective regression models. I regressed them using different components of executive compensation (and its respective proportions to the total compensation) and risk-taking incentives’ proxies: (1) vega, (2) salary, (3) bonus, (4) stock options, (5) restricted stock, (6) long-term incentive plans and (7) all main explanatory variables.
In the context of risk-taking incentives, the coefficients in model (1) and (7) in Table 2 suggest that prior vega, controlled for executives’ pay-performance sensitivity, does not display a relationship regarding the completion of M&As. This is inconsistent with my first hypothesis as well as most existing literature on the subject (e.g. Armstrong and Vashishtha, 2012; Coles et al., 2006; Guay, 1999) that suggests a positive relation between vega and undertaking riskier managerial decisions like acquisitions (Datta et al., 2001). However, it is in line with Kini and Williams (2012) who do not find a relationship between risky managerial decisions and risk-taking incentives captured by vega. So, this results might indicate that executives’ incentives are different from risk-taking incentives on financial and investment decisions.
Regarding the executive compensation incentives, there is a noticeable relation towards M&As. Bonus compensation has a strong and positive impact on the probability of completing a M&A deal since it is associated to a predicted increase of 0.91 percentage points in model (4) in the log-odds of the dependent variable and an increase of 1.761 percentage points in the log-odds of the explained variable when all main independent variables are considered. These results are consistent with Grinstein and Hribar (2004) which studied a sample of 327 large M&A deals between 1993 and 1999, and concluded that 39% of the acquiring firms provide bonus compensation for the completion of a merger and acquisition deal. However, I note that salary has a negative relationship with the studied dependent variable which goes against the assumption that because of the relationship between compensation and firm size, executives might demand higher cash compensation after completing a M&A (Bliss and Rosen, 2001; Core et al., 1999; Jensen and Meckling, 1976). One reason for this
19
Table 2 Logit Regression of Deal Dummy on Executive Compensation and Risk-Taking Incentives
The table summarises the regression results for 7 models using different components of executive compensation and risk-taking incentives in addition to various independent variables. The dependent variable is Deal Dummy. I estimate the regression using fixed effects logit models, and thus, fixed effects for industry and year are included. The intercept is not tabulated. T-statistics are shown in parentheses. *, **, and *** indicate significance at the 10%, 5%, and 1% level, respectively.
Dependent Variable = Deal Dummy
(1) (2) (3) (4) (5) (6) (7) Vega 0.0001 0.0001 (0.97) (1.17) P(Salary) -0.596 *** 0.563 (-3.22) (1.83) P(Bonus) 0.911 *** 1,761 *** (3.71) (4.66) P(Options) 0.290 *** 1.279 *** (3.08) (4.70) P(RestrStock) 0.018 1.152 *** (0.11) (3.37) P(Ltip) -1.058 *** -1.069 *** (-3.36) (-3.38) Delta 0.0002 0.0001 0.0001 0.0001 0.0001 0.0001 0.0001 (0.75) (0.37) (0.38) (0.37) (0.39) (0.38) (0.34) R&D 3.029 *** 2.856 *** 2.958 *** 2.894 *** 2.997 *** 2.998 *** 2.891 *** (4.27) (4.00) (4.19) (4.07) (4.22) (4.22) (4.05) Capex 6.028 *** 5.995 *** 5.821 *** 6.130 *** 6.057 *** 5.922 *** 5.676 *** (6.24) (6.20) (6.05) (6.33) (6.28) (6.18) (5.86) PPE -2.265 *** -2.341 *** -2.300 *** -2.281 *** -2.266 *** -2.207 *** -2.322 *** (-5.21) (-5.39) (-5.30) (-5.25) (-5.22) (-5.10) (-5.35) Leverage -0.870 *** -0.864 *** -0.861 *** -0.867 *** -0.875 *** -0.873 *** -0.863 *** (-3.25) (-3.20) (-3.20) (-3.23) (-3.26) (-3.25) (-3.19) ROA 0.543 * 0.504 0.545 * 0.528 0.548 * 0.539 0.470 (1.65) (1.50) (1.66) (1.57) (1.67) (1.63) (1.42) Firm size 0.356 *** 0.340 *** 0.336 *** 0.362 *** 0.354 *** 0.361 *** 0.339 *** (5.02) (4.79) (4.75) (5.09) (4.99) (5.09) (4.77) Book-to-market ratio -1.125 *** -1.107 *** -1.130 *** -1.089 *** -1.105 *** -1.093 *** -1.129 *** (-4.81) (-4.74) (-4.84) (-4.65) (-4.73) (-4.68) (-4.81) Risk 0.808 0.807 0.813 0.897 * 0.824 0.789 0.732 (1.49) (1.48) (1.50) (1.65) (1.52) (1.46) (1.33) Executive liquidity -0.393 ** -0.094 -0.810 *** -0.245 -0.363 ** -0.329 ** -0.308 (-2.42) (-0.52) (-3.99) (-1.41) (-1.99) (-2.03) (-1.24) Liquidity 1.046 *** 1.049 *** 1.017 *** 1.039 *** 1.046 *** 1.030 *** 1.018 *** (6.85) (6.86) (6.67) (6.80) (6.85) (6.75) (6.63) Log(sales) 0.090 0.088 0.085 0.084 0.086 0.087 0.093 (1.28) (1.26) (1.22) (1.21) (1.23) (1.24) (1.33) Volatility -0.071 -0.113 -0.029 -0.154 -0.059 -0.056 -0.148 (-0.43) (-0.68) (-0.18) (-0.90) (-0.36) (-0.34) (-0.86) Sales growth -0.013 -0.009 -0.010 -0.012 -0.009 -0.013 -0.016 (-0.24) (-0.16) (-0.18) (-0.21) (-0.17) (-0.23) (-0.28) Surplus cash 0.572 0.603 0.472 0.611 0.562 0.527 0.521 (1.05) (1.10) (0.87) (1.12) (1.03) (0.97) (0.95) Obs. 33,509 33,509 33,509 33,509 33,509 33,509 33,509
20
negative relation could be the fact that because of executives “only receive” salary compensation, accordingly to model (2), they are averse to risky projects, since they do not provide private benefits and it could increase the safety of their current position. However, in model (7) it is positive, although weakly significant, proving that a good mix of compensation can mitigate agency costs. So, can draw a conclusion from both models, which is that my fourth hypothesis holds, since cash-based compensation has a positive impact on the managerial decision to complete a M&A deal.
The coefficients for stock options compensation in model (4) and (7) in Table 2 imply that stock options affect positively the managerial decision to complete a M&A deal. This is consistent with my second hypothesis and prior literature previously discussed, and hence stock options do induce risk-taking behaviour, pushing managers to overcome the existent agency problems and adopting managerial decisions that could maximise firm value even at the cost of increasing firm risk (e.g. Guay, 1999; Hirshleifer and Suh, 1992; Jensen and Meckling, 1976; Smith and Stulz, 1985). In addition, the respective coefficients for the restricted stock and long-term incentive plans differentiate from my third developed hypothesis that state that these compensation elements would have a positive impact on M&As. In fact, my econometrical analysis shows no relationship between restricted stock and the Deal Dummy if it is the main independent variable, but has a positive relation if all main variables are regressed in the same model (7). By contrast, long-term incentives plans are negatively related in both models.
Coles et al. (2006) and Guay’s (1999) results demonstrate that R&D expenses and capital expenditures have a positive relation to risk-taking and investment decisions, while Coles et al (2006) adds that high leverage induces riskier decisions. Indeed, my results demonstrate that firms’ investments as well as growth opportunities, captured by within the firm have a strong impact in the completion of M&As, and subsequently, in firm performance because companies with various investment opportunities tend to use more stock options to link managers’ wealth to firm value (Smith and Watts, 1992), and therefore, undergo managerial decisions beneficial for shareholders and that could maximise value. However, I note that leverage does not have a positive relationship, but a negative one, probably because leverage is known for the creation of cash constraints, and M&As usually use as a form of payment a mix of cash and stock-based compensation (Martin, 1996). The reason could be due to companies interested
21
in completing a M&A deal typically have limited cash (10,2% of surplus cash) and liquidity (7,5%), as tabulated in Table 1, the latter which is highly significant and positive in my models illustrated in Table 2, they have to obligatory resort to debt financing to do the payment related to cash, and thus, impairing the firms as they might not be able to choose an optimal trade-off between equity and debt financing, so that the benefits are equal to the costs.
Columns 1-6 of Table 3 present the results of the respective regression models. I regressed them using different mixtures of compensation elements: (1) proportion of fixed compensation (P(fixed)), (2) proportion of variable compensation, which is a sum of bonus and equity-based compensation, (3) both variables used in models 1&2, (4) cash compensation, (5) restricted stock and long-term incentive plans, (6) equity-based compensation.
In relation to the differences between fixed and variable compensation, if I only regress the fixed variable, its relationship is negative, which is to be expected as it increases managers’ risk aversion (Jensen and Meckling, 1976). It also has negative effects on the Deal Dummy if I only consider cash compensation. Nonetheless, in the present of a compensation contract based on diverse types of compensation, salary can have a slightly positive impact, which effect could be caused by causality between explanatory variables, since prior literature focused on equity-based compensation, and more specifically stock options, argues that by connecting executives’ pay to firm performance through stock awards and stock options, they overcome agency costs and are have incentives to risk-taking decisions (Holmstrom, 1979; Smith and Stulz, 1985; Smith and Watts, 1992). The latter statement is also supported by my coefficients present in model (6) which is based on equity-based compensation, since stock options have a great significance and positive impact in the completion of M&As, although long-term incentive plans’ coefficients in both models 5&6 are negative, but the former is typically 26,7% of total compensation, while the latter is 3,1%, and thus, its negative effects are mitigated by those from stock options.
22
Table 3 Logit Regression of Deal Dummy on Combinations of Executive Compensation Components
The table summarises the regression results for 6 models using different mixes of components of executive compensation in addition to various independent variables. The dependent variable is Deal Dummy. I estimate the regression using fixed effects logit models, and thus, fixed effects for industry and year are included. The intercept is not tabulated. T-statistics are shown in parentheses. *, **, and *** indicate significance at the 10%, 5%, and 1% level, respectively.
Dependent Variable = Deal Dummy
(1) (2) (3) (4) (5) (6) P(Variable) 0.920 *** 1.352 *** (5.15) (4.16) P(Salary) or P(Fixed) -0.596 *** 0.558 * -0.465 ** (-3.22) (1.73) (-2.45) Total Compensation P(Bonus) 0.769 *** (3.03) P(Options) 0.369 *** (3.00) P(RestrStock) -0.094 0.185 (-0.6) (0.88) P(Ltip) -1.103 *** -0.959 *** (-3.43) (-2.92) Delta 0.0001 0.0001 0.0001 0.0001 0.0001 0.0001 (0.37) (0.39) (0.37) (0.38) (0.39) (0.37) R&D 2.856 *** 2.938 *** 2.903 *** 2.855 *** 3.068 *** 2.899 *** (4.00) (4.11) (4.06) (4.03) (4.32) (4.06) Capex 5.995 *** 5.99 *** 5.788 *** 5.805 *** 5.93 *** 5.982 *** (6.20) (6.17) (6.00) (6.02) (6.15) (6.21) PPE -2.341 *** -2.368 *** -2.313 *** -2.348 *** -2.231 *** -2.230 *** (-5.39) (-5.43) (-5.33) (-5.41) (-5.13) (-5.14) Leverage -0.864 *** -0.874 *** -0.868 *** -0.857 *** -0.881 *** -0.868 *** (-3.20) (-3.24) (-3.21) (-3.17) (-3.28) (-3.23) ROA 0.504 0.495 0.470 *** 0.510 0.532 0.511 (1.50) (1.48) (4.42) (1.54) (1.61) (1.53) Firm size 0.340 *** 0.341 *** 0.345 *** 0.327 *** 0.365 *** 0.366 *** (4.79) (4.81) (4.87) (4.62) (5.14) (5.14) Book-to-market ratio -1.107 *** -1.121 *** -1.107 *** -1.126 *** -1.104 *** -1.078 *** (-4.74) (-4.79) (-4.73) (-4.82) (-4.72) (-4.61) Risk 0.807 0.754 0.694 0.799 0.763 0.826 (1.48) (1.38) (1.26) (1.47) (1.39) (1.51) Executive liquidity -0.094 -0.095 0.554 -0.528 ** -0.382 -0.069 (-0.52) (-0.52) (0.30) (-2.26) (-2.09) (-0.29) Liquidity 1.049 *** 1.051 *** 1.032 *** 1.026 *** 1.027 *** 1.030 *** (6.86) (6.85) (6.73) (6.71) (6.71) (6.74) Log(sales) 0.088 0.089 0.091 0.087 0.087 0.087 (1.26) (1.27) (1.30) (1.26) (1.24) (1.24) Volatility -0.113 -0.128 -0.135 -0.071 -0.090 -0.136 (-0.68) (-0.77) (-0.82) (-0.43) (-0.54) (-0.80) Sales growth -0.009 -0.008 -0.012 -0.009 -0.013 -0.014 (-0.16) (-0.14) (-0.21) (-0.17) (-0.23) (-0.25) Surplus cash 0.603 0.579 0.545 0.518 0.506 0.587 (1.10) (1.06) (0.99) (0.95) (0.93) (1.08) Obs. 33,509 33,509 33,509 33,509 33,509 33,509
23
3.3.1 Model Limitations
Although I provide evidence to either accept or reject my developed hypotheses, there might be reasons for such results. Firstly, my data sample might have a selection bias, since when I merge my mergers and acquisitions data with the information related executive compensation and firm-specific characteristics. Secondly, my results could have endogeneity problems, i.e. my findings might be affected by reverse causality, which would be a bias towards the coefficient estimates I obtain. Further, it is difficult to distinguish whether firms with a particular compensation structure provide more incentives respecting the completion of M&As or if the completion of M&As induces firms to pay differently percentages of compensation elements.
Even if it is difficult to fully eliminate endogeneity issues, future research using advanced econometric models could reduce the probability that my results are endogenous. For example, such model could follow Hayes et al. (2012) and observe the relationship between compensation elements and risk-taking following an exogenous shock or could follow Coles et al. (2006) who use lagged values of vega and delta.
24
4.
Small Sample Analysis
This section examines the relationship between corporate diversification and executive compensation which prior literature suggests there is. Aggarwal and Samwick (2003) argue that diversification is caused by the relation between manager’s private benefits and the management of a diversified firm, and thus agency costs arise as they increase the benefits at the expense of stockholders. Moreover, firm size has a relation with executive compensation (Jensen and Murphy, 1990) and Jensen (1986) suggests that managers use their companies’ surplus cash to expand and increase firm size so increase their chances of entrenchment (Shleifer and Vishny, 1989), increasing even more their benefits. Further, Rose and Shepard support the relationship between executive compensation and corporate diversification, since they find diversified companies receive more cash compensation that undiversified firms.
I begin by explaining my data sample and how I will capture the level of diversification for each firm. Next, I present the summary statistics of the components of executive compensation from the sample’s firms and draw conclusions regarding my fifth hypothesis which proposes that high diversified firms have, comparatively with low diversified firms, more compensation incentives for managers to adopt corporate diversification strategies. Then, I review the Definitive Proxy Statements from the financial year the deals were completed for the chosen firms.
4.1 Data, Description and Analysis
For my small sample analysis, I randomly16 chose 24 firms (see appendix 1), 12
from the Manufacturing Industry and 12 from the Finance, Insurance and Real Estate Industry.
I select firms from the Manufacturing Industry because they must constantly improve its manufacturing process, which can be achieved through mergers and acquisitions, based essentially on product-market orientation, the latter which relates
16 I matched each firm from both selected industries with a number from 1 to the maximum value. Then
25
to diversification into businesses with similar production technologies and other characteristics that have potential economies of scope, they can (Bradley et al., 1988; Santos et al., 2003). On the other side, I select firms from the Finance, Insurance and Real Estate Industry because their reasons for M&As is globally accepted as to increase their customers and improve the efficiency of their operational infrastructures as they have more (skilled) employees. Moreover, it is widely known that financial firms, especially banks, have a greater level of regulation than manufacturing firms, playing an important role in corporate governance (Shleifer and Vishny, 1997), since executives have a higher difficulty to pursue personal objectives and have to align their interests with those of the banks, which typically have high leverage and have strong incentives to pursue risky investments such as loans or real estate investments, even if NPV is not positive17. Therefore, bank regulation is designed to take risk-taking
incentives as well as compensation incentives.
This small sample includes some established companies such as Emerson Electric Co, Esterline Technologies Corp and Pfizer Inc (all high diversified) or Capital One Financial Corp, Stifel Financial Corp and Western Digital Corp (all low diversified). To measure corporate diversification, I use a business count approach, which typically uses the lines of business based on the SIC code (Martin and Sayrak, 2003). Yet in my quantitative analysis I will measure it by the number of related M&As made by the respective selected firms. For this reason, I calculate the average number of related M&A deals completed by the selected companies within the specific period (1995-2007). I split the sample in high diversified firms if they completed more deals than the mean sample (4.67; see appendix 1) and low diversified firms otherwise. My sample includes 112 M&As with 90% comprising of related diversification. Geographic diversification only constitutes 8% of the sample.
17 See Jensen and Meckling (1976) for more information about the risk-shifting incentives of
26
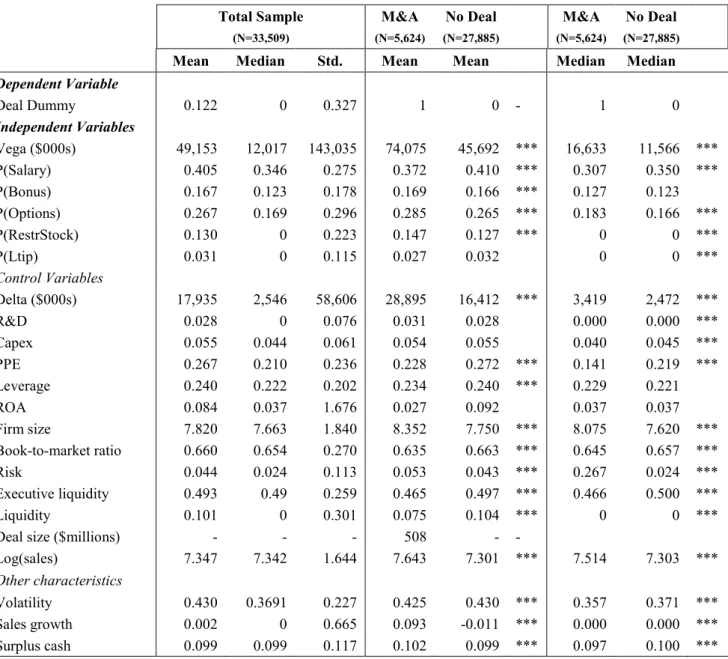
Figure 1 Executive Compensation before and after a M&A deal
The figure illustrates the average of the elements of executive compensation that managers receive, in average, 12 months before and after the completion date. The X-Axis shows the respective elements of executive compensation. The Y-Axis has been adjusted to allow an easier interpretation. The sample includes a random selection of 24 firms who completed M&A deals between 1995 and 2007 (including financial and manufacturing firms only).
Figure 1 shows the amount executives from my small sample received, in average, 12 months before the completion date (t-1) and 12 months after (t+1). Overall, executive compensation soared after a merger and acquisition deal. Indeed, cash compensation increased 25.1% and equity-based compensation rose by 84.2%, with stock options contributing with a 60.1% increase, but the highest growth was from restricted stock and long-term incentive plans that grew by 98.7% and 117.6%, respectively. Moreover, it is visible that stock options are the favourite method to award executives (575 thousands, on average). On the other hand, bonus, restricted stock and long-term incentive plans have approximately similar values. Following the discussion in section 2.2, this could suggest that executive compensation increases with firm size (Jensen and Meckling, 1976; Jensen and Murphy, 1990) and there might be incentives for managers to take advantage of shareholders through diversification. In line with Guay (1999), the amount of stock options compensation could incentivise risk-taking. 422,1 287,7 359,3 197,7 173,6 497,1 391,1 575,3 392,7 377,7 0,0 100,0 200,0 300,0 400,0 500,0 600,0 700,0
Salary Bonus Options Restricted
Stock Long-term Incentives In Th o u san d s (000s)
Components of Executive Compensation
27
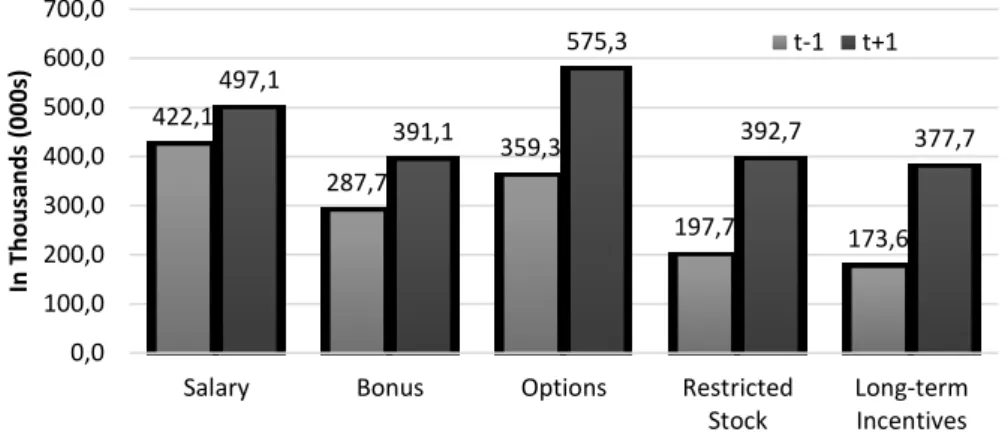
Figure 2 Executive Compensation for Manufacturing and Finance, Insurance and Real Estate Firms
The figure illustrates the average of the elements of executive compensation that managers receive, in average, 12 months before and after the completion date. The X-Axis shows the respective elements of executive compensation. The Y-Axis has been adjusted to allow an easier interpretation. The sample includes a random selection of 24 firms who completed M&A deals between 1995 and 2007.The upper graph is related to manufacturing firms and the lower graph is for finance, insurance and real estate firms.
Consistent with Houston and James (1995), who examine whether executive compensation in banking is structured to promote risk-taking or not. The authors find that, on average, CEOs receive less cash compensation and stock options comparatively to other industries. Although my results demonstrate that in the year prior to the M&A deal, executives from financial firms receive greater amount of bonus and long-term incentive plans, if I only take into consideration post-deal year, executives from manufacturing firms receive higher pay than those from financial firms. 410,6 263,1 446,6 233,7 147,7 507,2 408,8 611,7 471,4 441,6 0,0 100,0 200,0 300,0 400,0 500,0 600,0 700,0
Salary Bonus Options Restricted
Stock Long-term Incentives In Th o u san d s (000s)
Components of Executive Compensation
t-1 t+1 419,2 304,8 246,9 149,4 196,4 466,9 356,2 512,4 288,8 291,2 0,0 100,0 200,0 300,0 400,0 500,0 600,0 700,0
Salary Bonus Options Restricted
Stock Long-term Incentives In Th o u san d s (000s)
Components of Executive Compensation