Changes of Mineral Concentrations in Serra
Cheese during Ripening and Throughout the
Cheesemaking Season
Angela C Macedo and F Xavier Malcata*
Escola Superior de Biotecnologia, Universidade Catolica Portuguesa, 4200 Porto, Portugal
(Received 4 April 1996 ; revised version received 22 November 1996 ; accepted 19 February 1997)
Abstract : Seasonal changes of the ash content and mineral concentrations in Serra cheese were studied over a typical 35-day ripening period. Statistically sig-niÐcant di†erences (at the 5% level) exist between the ash content and the con-centrations of Na, K, Ca, P, Mg and Zn in cheeses during ripening. The highest concentrations of Na was obtained in cheese ripened for 7 days, whereas the concentrations of K, Ca, P, Ng and Zn decreased signiÐcantly during ripening. For 35-day-old cheeses, concentrations of Na, K and Cu were lowest and con-centration of P was highest for cheeses manufactured in May. The concon-centration of Ca was lowest for cheeses manufactured in February. On average, the most concentrated minerals (in g kg~1 of total solids, TS) in 35-day-old Serra cheese were Na (18É56), Ca (9É70) and P (7É92) and, at a lower level, K (1É70) and Mg (0É96). Only trace levels (inmg kg of Zn (94É33), Cu (2É26) and Mn (1É25) were
TS ~1)
detected. A high mineral nutrition quality was thus ascribed to 35-day-old Serra cheese based on the average nutritional densities : 4É8 for Ca, 4É0 for P, 1É1 for Mg, 3É4 for Na, 2É4 for Zn, 0É4 for Cu, 0É2 for Mn and 0É2 for K.
Key words : calcium, magnesium, zinc, copper, manganese, sodium, potassium, phosphorus, dairy, sheep, lactation
INTRODUCTION
Since milk production by sheep is limited to only a few countries, mainly located in the Mediterranean basin, data concerning composition of sheepÏs milk and com-position of dairy products manufactured therefrom are much scarcer than those of cowÏs counterparts. Avail-able reports (Anon 1981) indicate that the average con-centration in minerals of sheepÏs milk is considerably higher than that of cowÏs milk ; hence, dairy products obtained from sheepÏs milk are expected to possess a higher nutritional value than those obtained from cowÏs milk. The composition of cheese in terms of minerals is rather variable and depends on such factors as : (i) initial composition of the milk (Garc•a-Olmeda et al 1981), which in turn depends on the breed, stage of lactation,
* To whom correspondence should be addressed.
physiological condition of the animal, composition of the feed and environmental factors (Anon 1981) ; (ii) cheesemaking procedures (Feeley et al 1972), which are di†erent for di†erent cheese types ; and (iii) ripening conditions (Coppini et al 1979 ; Le Graet and Brule 1988), which include not only the temperature and rela-tive humidity prevailing in the maturation room but also protocols of surface salting and washing.
The most important and famous variety of cheese in Portugal manufactured with sheepÏs milk following tra-ditional procedures is Serra cheese ; this type of cheese is manufactured on the farm level only from raw milk without starter using a crude rennet from plant origin (ie the dried Ñowers of the wild thistle, Cynara card-unculus L). The plant rennet possesses a strong and unspeciÐc proteolytic action which leads to extensive breakdown of caseins in the cheese matrix within ca 1 month of ripening and thus to development of a soft,
buttery texture (Macedo et al 1993). Despite the fact that this unique cheese is considered a food specialty by most gourmets, concerns pertaining to safety and nutri-tional value have been raised lately, especially by con-sumers in North European and North American countries. Whereas the former issue has been dealt with previously (Macedo et al 1995, 1996) with a focus on microbiological items, the latter issue (especially in terms of minerals) has not yet received formal attention by researchers and has, therefore, provided a driving force for the research work reported in this communica-tion. Although extensive information on mineral com-position of (pasteurised) cowÏs milk cheeses is available worldwide, information on mineral composition of (raw) sheepÏs milk cheeses is scarce, eg reports encompassing a few Spanish cheeses (Marcos et al 1983 ; Martin-Hernandez et al 1992).
The present study attempts not only to contribute to the characterisation of the mineral proÐle of Serra cheese by the end of the normal ripening period but also to proceed one step further via statistically assess-ing the inÑuence of the time variables (ie ripenassess-ing time and time within the cheesemaking season) on the afore-mentioned proÐle. In view of the importance of minerals for human health, the nutritional density of Serra cheese in terms of several minerals after ripening for 35 days is also presented in this report, with the goal of helping potential consumers decide on inclusion of this cheese in their diet.
MATERIALS AND METHODS Cheese manufacture and sampling
Three batches of twelve 0É5-kg cheeses were prepared by a selected dairy farmer in the Appellation Serra region in three sequential periods within the Controllee
cheesemaking season (November, February and May). These three periods were selected so as to represent as close as possible the various stages of the lactation season (which usually starts in October and ends in May), the various feeding regimes (determined mainly by the weather conditions) and the various ripening conditions (constrained chieÑy by the local weather). Cheesemaking followed traditional practices : after the temperature of raw sheepÏs milk (previously Ðltered through a clean piece of cotton cloth) had reached 28¡C, crude kitchen salt was added to the milk at the ratio of 12 g litre~1, and the mixture was stirred until complete solubilisation ; thistle Ñowers (previously dried on the shade in the open air and carefully ground) in an amount enough to give the ratio 0É4 g litre~1 of milk were then mixed with tap water until a brown suspen-sion resulted and Ðltered through a Ðne, clean piece of cotton cloth, and the clear Ðltrate was added to the milk and gently stirred for ca 5 min ; the milk was allowed to
rest for ca 1 h at 28¡C until complete coagulation had occurred ; the curd was then manually cut by stirring the coagulum with the bare hand for ca 10 min, after which the curd pieces were poured into a Ðne cloth bag and lightly pressed for ca 10 min so as to help in the expression of whey ; drainage was completed via press-ing of the fresh cheese while in the plastic perforated mould via a 10-kg metal block for ca 6 h in the original position and another 6 h after having been turned upside down ; Ðnal salting was done by rubbing the whole outer surface of the cheese with kitchen salt at a ratio of 0É04 g cm~2 of cheese surface ; the cheeses were Ðnally placed in maturation chambers with temperature set to 9¡C and relative humidity set to 95% ; after 1 week the cheeses were transferred to a second ripening chamber without control of temperature and relative humidity, where they were turned upside down daily and washed periodically with tap plain water.
Three cheeses of each batch were taken at random during the ripening period on the day of manufacture proper and after 7, 21 and 35 days and transported under refrigerated conditions (ca 4¡C) to our premises. After having removed the rind, analytical samples were homogenised and frozen at ca [30¡C in Whirl-pakTM vacuum packages (Cole-Parmer, Chicago, IL, USA) until analysis was in order.
Chemical analysis
The moisture and salt in each cheese sample were deter-mined as described by Case et al (1985) using the atmo-spheric oven method at 100¡C for 24 h (EHRET, Emmendingen, Germany) and the modiÐed Volhard method, respectively. The ash content in cheese was determined using a gravimetric method after thermal treatment in a muffle furnace (Ney, Yucaipa, CA, USA) (Anon 1984) at a temperature of 500¡C in order to prevent signiÐcant losses of low-boiling elements, eg zinc (Wong et al 1977).
To a fraction of the ash thus obtained, 2 ml of 1M aqueous solution of nitric acid (Merck, Darmstad, Germany) was added, and the solution thus obtained was dried on a thermostatted hotplate. The ash was then redissolved in 10 ml of 1M aqueous solution of nitric acid in a volumetric Ñask. This concentrated feed-stock solution was subsequently stored in stoppered polypropylene tubes under refrigeration at ca 4¡C until analysis could be performed.
The concentrations of Ca and Mg (in diluted aliquots obtained from the feedstock solution) and the concen-trations of Zn, Cu and Mn (in the original feedstock solution) were determined using a GBC 902 double-beam atomic absorption spectrophotometer (GBC ScientiÐc Equipment, Melbourne, Australia) with an air/acetylene Ñame. Standard solutions for atomic absorption spectroscopy at 1000 ppm (Spectrosol RTM,
BDH Chemicals, Poole, UK) were used to generate cali-bration curves. Lanthanum (III) (Merck) was added to the Ðnal diluted solutions of Ca and Mg at a concentra-tion of 500 ppm in order to avoid interference by P (Fresno et al 1995).
The concentrations of Na and K (in diluted aliquots obtained from the feedstock solution) were determined using a Ñame emission photometer (Jencons ScientiÐc, Bedfordshire, UK) with an air/butane Ñame. Standard solutions for Ñame emission photometry at 1000 ppm (Spectrosol RTM, BDH Chemicals) were used to generate calibration curves.
The concentration of P (in diluted aliquots obtained from the feedstock solution) was determined by a photometric method via assay of the molybdenum blue complex derivative (Anon 1990) using a fraction of the ash obtained from the cheese sample as described above. Potassium dihydrogen phosphate (Merck), pre-viously dried to constant weight, was used to generate the calibration curve.
Statistical analysis
The StatviewTM 4.0 statistical package (Abacus Con-cepts, Berkeley, CA, USA) was used for statistical treat-ment of the experitreat-mental results generated, pertaining
to ash content and individual mineral concentrations (total solid (TS) basis) of cheeses manufactured at di†er-ent times within the cheesemaking season and ripened for di†erent times, via analysis of variance for the whole dataset and FisherÏs protected least signiÐcance di†er-ence test for pairwise comparison (Haycock et al 1992). Both these methodologies could be safely applied because the experimental errors (as evaluated from sets of three replicates) were independent from one another and normally distributed (Box et al 1978). The afore-mentioned analyses were employed to test, on the 5% level of signiÐcance, the null hypothesis that no di†er-ences existed between concentrations of samples obtained from cheeses manufactured at di†erent times within the cheesemaking season and ripened for di†er-ent times.
RESULTS AND DISCUSSION Mineral concentrations
Inspection of Table 1 indicates that the most concen-trated minerals in Serra cheese are Na, Ca and P (all of the same order of magnitude) ; concentrations of K and Mg were ca ten-fold lower. Only trace levels of Zn, Cu and Mn could be detected (see Table 2) ; the concentra-tions of Zn were ca 100-fold lower than those of the
TABLE 1
Changes in concentration (g kg and associated standard error, of major minerals TS
~1),
and ash in Serra cheese during ripening and at di†erent periods within the cheese-making season : November (1st row), February (2nd row) and May (3rd row)
Minerals Ripening time (days)
0 7 21 35 Sodium (Na) 10É81^ 0É34 21É04^ 0É92 20É11^ 0É31 19É85^ 0É51 8É85^ 0É90 22É82^ 1É45 20É52^ 0É20 19É64^ 0É36 9É02^ 0É78 21É06^ 1É03 17É63^ 0É53 16É19^ 0É20 Potassium (K) 2É13^ 0É10 1É99^ 0É15 1É77^ 0É08 1É73^ 0É12 2É37^ 0É19 1É99^ 0É10 1É96^ 0É18 1É88^ 0É09 1É75^ 0É19 1É55^ 0É22 1É51^ 0É08 1É49^ 0É08 Calcium (Ca) 12É97^ 1É10 12É63^ 1É25 11É15^ 1É48 10É50^ 0É89 10É54^ 1É16 9É45^ 0É98 9É43^ 0É48 8É54^ 0É35 12É13^ 1É46 11É30^ 0É27 10É52^ 1É00 10É07^ 0É59 Phosphorus (P) 8É75^ 0É40 8É38^ 0É37 7É55^ 0É36 7É59^ 0É27 9É00^ 0É15 8É73^ 0É09 7É73^ 0É40 7É80^ 0É19 9É40^ 0É09 9É21^ 0É15 9É18^ 0É09 8É38^ 0É28 Magnesium (Mg) 1É23^ 0É10 1É06^ 0É12 1É03^ 0É02 1É00^ 0É15 1É26^ 0É04 1É21^ 0É20 1É21^ 0É03 0É97^ 0É04 1É08^ 0É04 0É97^ 0É05 0É85^ 0É07 0É92^ 0É14 Total (ash) 61É10^ 2É27 78É97^ 4É22 73É80^ 2É02 75É03^ 1É80 60É73^ 3É52 88É40^ 6É46 82É13^ 2É63 79É00^ 1É39 60É40^ 1É15 77É87^ 1É37 73É77^ 2É84 82É97^ 1É54
TABLE 2
Changes in concentration (mg kg and associated standard error, of trace minerals in Serra TS
~1),
cheese during ripening and at di†erent periods within the cheesemaking season : November (1st row), February (2nd row) and May (3rd row)
Minerals Ripening time (days)
0 7 21 35 Zinc (Zn) 99É33^ 3É05 84É67^ 8É02 77É33^ 3É06 79É33^ 13É05 120É00^ 13É45 113É33^ 1É16 110É67^ 5É69 98É00^ 7É21 123É33^ 5É77 121É00^ 10É15 119É00^ 1É00 105É67^ 10É07 Copper (Cu) 3É90^ 0É85 2É90^ 0É46 3É10^ 0É46 2É50^ 0É40 3É47^ 0É55 3É33^ 0É55 3É00^ 0É89 2É73^ 0É15 2É50^ 0É70 2É20^ 0É35 2É10^ 0É79 1É53^ 0É15 Manganese (Mn) 1É27^ 0É06 1É17^ 0É15 1É23^ 0É06 1É23^ 0É06 1É30^ 0É10 1É40^ 0É10 1É40^ 0É17 1É23^ 0É16 1É37^ 0É15 1É37^ 0É06 1É40^ 0É20 1É30^ 0É10
dominating elements, whereas the concentrations of Cu and Mn were ca 10 000-fold lower. Similar concentra-tion levels have been reported by Marcos et al (1983) for Spanish cheeses which are also manufactured from raw ovine milk via enzymatic coagulation without the addi-tion of starter (if acid coagulaaddi-tion were employed, acid production would lead to a shift of minerals from col-loidal to soluble state) and with addition of similar amounts of salt, although with somewhat di†erent extents of wheying. Fresno et al (1995) concluded that manufacturing technology (which is characterised by the combination of speciÐc patterns of coagulation, salting and wheying) has more inÑuence on the concen-trations of minerals than the source of milk.
The results provided by the ANOVA using the whole data set indicate that ripening time statistically a†ects the concentrations (in TS basis) of Ca (P\ 0É001), P (P\ 0É0001), Mg (P \ 0É0001), Zn (P \ 0É0005), Cu (P\ 0É01), Na (P \ 0É0001) and K (P \ 0É001) ; con-versely, ripening time does not statistically a†ect the concentration of Mn (P[ 0É5). The strongest e†ect of ripening is observed with respect to Na, which is chieÑy contributed by sodium chloride (recall that in the manufacture of Serra cheese crude kitchen salt is added to milk prior to coagulation and to the surface of the cheese after pressing). Between 0 and 7 days of ripening, Na di†uses away from the surface towards the bulk of the cheese using water as continuum for molecular transport ; hence, its concentration is expected to increase signiÐcantly, and this expectation is consub-stantiated by the experimental observation of ca 12É1 g (P\ 0É0001, as obtained from FisherÏs protected kg
TS ~1
least signiÐcance di†erence test) ; conversely, K will be lost during wheying, and, since no pool of K is made available at the surface (as happened with Na via NaCl), its concentration decreases signiÐcantly in cheese by ca P \ 0É0001). Between 7 and 21 days of 0É24 g kg
TS ~1,
ripening, not only the moisture content of cheese decreases but also its surface is periodically washed with tap water with consequent leaching of small amounts of Na (by ca2É2 g kg P \ 0É0001). Although Na and K
TS ~1,
are usually present in the soluble fraction of cheese, such minerals as Ca, P, Mg, Zn and Cu are prefer-entially linked to the casein micelle (insoluble) fraction ; however, as the pH in cheese decreases during ripening, migration of those minerals towards the soluble fraction is observed, and so losses in the residual whey can take place (Moreno Rojas et al 1994). Macedo et al (1996) reported that, between 0 and 21 days of ripening, sig-niÐcant decrease in the pH of Serra cheese is observed, and this change may account for the signiÐcant decrease in the concentrations of Ca (by1É5 g kg P \ 0É005),
TS ~1, P (by 0É9 g kg P \ 0É0001), Mg (by TS ~1, 0É2 g kg TS ~1, P \ 0É0005) and Zn (by 11É9 mg kg P \ 0É005). TS ~1,
Between 21 and 35 days, the rind becomes thicker and so the loss of whey is very small ; during this time-frame, no statistical di†erences were obtained for the content of the mentioned minerals.
The concentrations of Zn, Ca, Mg, K and Na in fresh cheeses were statistically di†erent during the cheese-making season (P\ 0É05, as concluded from the results of the ANOVA) ; cheeses at day proper of manufacture showed the lowest concentrations of Zn in November, of Ca in February and of K and Mg in May. Assuming that essentially the same cheesemaking protocol was followed irrespective of the time of manufacture, this observation can probably be accounted for by varia-tions in milk composivaria-tions arising from the qualitatively and quantitatively di†erent metabolic rates (due to dif-ferent physiological state of the animals and di†erent environmental temperatures), as well as di†erent char-acteristics of the feeding available (Bell and Whittier 1965). In fresh cheeses the concentrations of Na were signiÐcantly higher in November than in February and
May (P\ 0É05, as concluded from FisherÏs protected least signiÐcance di†erence test), which were statistically similar ; these variations could be partially explained by the salting method used in Serra cheesemaking (salt is added empirically to milk at the very beginning of cheese manufacture and to surface of the cheese after pressing). The concentrations of P, Cu and Mn in cheeses at 0 days did not exhibit statistically signiÐcant variations at the 5% level throughout the cheesemaking season. The concentrations of Ca, P, Cu, K and Na in 35-day-old Serra cheeses were signiÐcantly di†erent throughout the cheesemaking season (P\ 0É05). The concentrations of N, K and Cu by the end of ripening were statistically lower in May than in November and February, which were similar at the 5% level of signiÐ-cance ; these could probably be explained by the lower moisture contents of cheeses manufactured in May than those manufactured in November and February as reported by Macedo et al (1996), and so by higher losses of these minerals with whey. The concentration of Ca in 35-day-old cheeses was statistically lower in February, whereas the concentration of P in 35-day-old cheeses was statistically higher in May than in the other 2 months ; these variations probably can be explained by the fact that the lowest pH values in cheeses ripened in February favour migration of these minerals to the soluble fraction, whereas the highest pH values in cheeses ripened in May favour the reverse. The concen-trations of Mg, Zn and Mn in 35-day-old cheeses did not show evidence of statistically signiÐcant variation throughout the cheesemaking season (at the 5% level of signiÐcance).
Ash concentration
The ANOVA indicated that the variation of ash content in cheese on a TS basis changed signiÐcantly with time of ripening. Regardless of the cheesemaking period, the ash content (see Table 1) increased signiÐcantly during the Ðrst 7 days of ripening (P\ 0É0001, using FisherÏs protected least signiÐcance di†erence test), decreased signiÐcantly between 7 and 21 days of ripening (P\ 0É001) and tended to stabilise thereafter with no signiÐcant variation (P[ 0É05). The variations of ash content during ripening are mainly due to the variations of the major minerals (eg Na, Ca and P) in Serra cheese during ripening ; during the Ðrst week of ripening, the ash content increased mainly because of increases in the concentration of Na as a result of salt addition to the surface of cheese ; between 7 and 21 days, the ash content decreased because the concentrations of Na, Ca and P decreased due to losses of these minerals in whey (which continues to be expressed although at slower and slower rates) ; after 21 days of ripening, no signiÐ-cant variations in ash content could be detected because
the aforementioned two phenomena (ie salt in and whey out) did not take place to signiÐcant extents.
The ash content of cheeses, manufactured in Novem-ber, February and May, at 0 days of ripening were similar (P[ 0É05, as obtained from use of FisherÏs pro-tected least signiÐcance di†erence test). Although these observations for cheese are apparently not consistent with the data reported by several researchers for milk (Shalichev and Tanev 1967 ; Williams et al 1976 ; Misic and Petrovic 1976), ie lower values of ash content during earlier stages of lactation and increases up to ca 14% at the Ðnal stages, it should be borne in mind that : (i) salt (which provides Na, the major element of ash) is added empirically to milk at the very beginning of cheese manufacture, and consequently helps in leveling o† the initial ash content of milk ; and (ii) the extent of whey drainage and curd pressing may be not uniform for di†erent batches of cheese milk processed at di†er-ent times within the lactation period (despite the stan-dardised procedures followed throughout this experimental research work), and so the initial composi-tion of cheese may be di†erent. The ash content of 35-day-old cheeses manufactured in May was signiÐ-cantly higher than that of cheeses manufactured in November and February, which were statistically similar to one another (at the 5% level of signiÐcance). This observation may be accounted for by the fact that 35-day-old cheeses manufactured in May showed, on average, highest concentrations of Ca and P ; these higher concentrations were likely due to slower losses of these minerals via whey because their soluble form was prevented as a result of slower acidiÐcation of cheese manufactured in May than in November or February (Macedo et al 1996).
Nutritional considerations
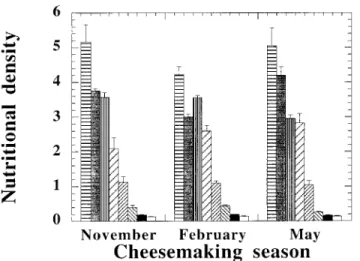
Figure 1 depicts the average nutritional densities of the various minerals studied in 35-day-old cheeses. The average nutritional density of cheese is deÐned as the ratio of mineral mass intake to energy intake brought about by consumption of 100 g of cheese, divided by the ratio of mineral recommended daily mass intake (ie 3750 mg for K, 2200 mg for Na, 800 mg for Ca, 800 mg for P, 350 mg for Mg, 15 mg for Zn, 3É8 mg for Mn and 2É5 mg for Cu for a male adult) to recommended daily energy intake (ie 2700 kcal for a male adult) (Anon 1974). Inspection of Fig 1 indicates that Serra cheese is an excellent source of Ca, P and Zn, a well-balanced source of Mg and a deÐcient source of Cu and Mn. Since this type of cheese has a high percentage of Na but a low percentage of K (like several Spanish cheeses manufactured from ovine milk), it is particularly recom-mended for people with skeleton and neurological prob-lems but not for people su†ering from anemia or hypertension. The period within the cheesemaking
Fig 1. Changes in the nutritional densities of Ca (0), P (C), Na (1), Zn (B), Mg (4), Cu (3), K (=) and Mn (K), in 35-day-old Serra cheese in di†erent periods within the
cheese-making season.
season had statistically signiÐcant e†ects at the 5% level upon the nutritional densities of all minerals except Mg and Mn. Cheeses manufactured in May displayed the lowest nutritional densities for Cu, K and Na but the highest nutrional density for P and Zn. Cheeses manu-factured in February displayed the lowest nutritional density for Ca. Reasoning from these observations, it appears that cheeses manufactured and ripened in May are better mineral sources than those manufactured in the other two periods.
CONCLUSIONS
The results in this study indicate that (i) there are sig-niÐcant increases of ash and Na in cheese but sigsig-niÐcant decreases of Ca, P, Mg, Zn and K during ripening, and that (ii) the period within the cheesemaking season has a statistically signiÐcant e†ect upon the concentrations of Ca, P, K, Cu and Na. Fully ripened Serra cheese is an excellent source of Ca, P, Mg and Zn, and so such cheese may be considered as a high-quality food from a mineral nutrition standpoint.
ACKNOWLEDGEMENTS
The authors are grateful to the members of the technical board of ANCOSE (the Portuguese Breeders Associ-ation for Serra da Estrela Sheep) for their cooperAssoci-ation encompassing the local manufacture and transport of the cheeses, and to the technical sta† of CEQA (the Food Quality Extension Service of the College of Biotechnology) for their permission and help in utilising analytical equipment. Financial support for the author (A C Macedo) was provided by a PhD fellowship (CIENCIA BD-1741/91-IF, Portugal). Financial support for the research work was partly obtained via project grant MAQUETTE : Improvement of
Tradi-tional Cheeses and their Technology (AI, Portugal) and project grant IMPACTO (PRAXIS XXI, Portugal).
REFERENCES
Anon 1974 Recommended Daily Dietary Allowances. National Academy of SciencesÈNational Research Council, National Academy Press, Washington, DC.
Anon 1981 The composition of eweÏs and goatÏs milk. Int Dairy Fed Bull 140 5È19.
Anon 1984 Ash of cheese. Gravimetric method. Official Methods of Analysis for Dairy Products. Association of Offi-cial Analytical Chemists, p 310.
Anon 1990 Phosphorus (total) in cheese and processed cheese products. Photometric method. Official Methods of Analysis for Dairy Products (1st suppl). Association of Official Ana-lytical Chemists, pp 34È35.
Bell R W, Whittier E O 1965 Composition of milk products. In : Fundamentals of Dairy Chemistry, ed Webb B H, Johnson, A H, AVI, Westport, CT, pp 37È53.
Box G E P, Hunter W G, Hunter J S 1978 Randomized blocks and two way factorial designs. In : Statistics for Experimenters : An Introduction to Design, Data Analysis and Model Building. Wiley, New York, pp 208È244.
Case R A, Bradley R L, Williams R R 1985 Chemical and physical methods. In : Standards Methods for the Exami-nation of Dairy Products, ed Richardson G H. American Public Health Association, Washington, DC, pp 327È394. Coppini D, Monzani A, Parenti C, Plessi M 1979 Indagine
spettrofotometrica di assorbimento atomico sul contenuto di alcuni elementi metallici nel formaggio parmigiano reg-giano. Sci T ecn L att-Cas 30 263È279.
Feeley R M, Criner P E, Murphy E W, Toepfer E W 1972 Major mineral elements in dairy products. J Dairy Res 61 505È510.
Fresno J M, Prieto B, Uriales R, Martin Sarmiento R, Car-ballo J 1995 Mineral content of some Spanish cheese vari-eties : di†erentiation by source of milk and by variety from their content of main and trace elements. J Sci Food Agric 69 339È345.
Garc•a-Olmeda R, Dez-Marques M C, Coll Hellin L, Barrera Vazquez C 1981 Estudio de elementos minerales en leches de cabra y oveja. I) Macroelementos. Anal Brom 33 1È10. Haycock K, Roth J, Gagnon J, Finzer W F, Soper C 1992
StatviewTM v. 4.0 : T he Ultimate Integrated Data Analysis and Presentation System. Abacus Concepts, Berkeley, CA. Le Graet Y, Brule G 1988 Migration des macro et
oligo-elements dans un fromage a paüte molle de type Camembert. L ait 68 219È234.
Macedo A C, Malcata F X, Oliveira J C 1993 The technology, chemistry and microbiology of Serra cheese : a review. J Dairy Sci 76 1725È1739.
Macedo A C, Malcata F X, Hogg T A 1995 Microbiological proÐle in Serra ewesÏ cheese during ripening. J Appl Bacte-riol 79 1È11.
Macedo A C, Costa M L, Malcata F X 1996 Changes in the microÑora of Serra cheese : evolution throughout ripening time, lactation period and axial location. Int Dairy J 6 79È94.
Marcos A, Millan R, Esteban M A, Alcala M, Fernandez-Salguero J 1983 Chemical compositions and water activity of Spanish cheeses. J Dairy Sci 66 2488È2493.
Martin-Hernandez C, Amigo L, Martin-Alvarez P J, Juarez M 1992 Di†erentiation of milks and cheese according to species based on the mineral content. Z L ebensm Unters Forsch 194 541È544.
Misic D, Petrovic D 1976 Main compositional characteristics of ewesÏ milk in the Rtanj pasture area with particular regard to minerals. Mljekarstvo 26 175È182.
Moreno Rojas R, Pozo Lora R, Zurera Cosano G, Amaro Lopez M A 1994 Calcium, magnesium, manganese, sodium and potassium variations in Manchego-type cheese during ripening. Food Chem 50 373È378.
Shalichev Y, Tanev G 1967 Comparative study of the milk yield and composition of Zlatusha sheep, East Friesan sheep and of their crosses. Anim Sci 4 81È90.
Williams A P, Bishop D R, Cockburn J E, Scott K J 1976 Composition of ewesÏ milk. J Dairy Res 43 325È329. Wong N P, LaCroix D E, Vestal J H 1977 Trace minerals in