Universidade de Trás – os – Montes e Alto Douro
IRRIGATION ON CHESTNUT ORCHARDS:
UNDERSTANDING THE SOIL AND PLANT WATER RELATIONS TO OPTIMIZE THE WATER MANAGEMENT
- Final version -
Doctoral thesis in Agronomical Sciences and Forestry
MARIA MARGARIDA DE OLIVEIRA MOTA Supervisors:
Prof. Doctor José Carlos Esteves Gomes-Laranjo, Associate Professor at Universidade de Trás-os-Montes e Alto Douro;
Prof. Doctor Fernando Pedro Falcão Raimundo, Assistant Professor ar Universidade de Trás-os-Montes e Alto Douro;
Company supervisor:
Eng. João Carlos Caço, Chief Executive Officer at Hubel Verde, SA.
Universidade de Trás – os – Montes e Alto Douro
IRRIGATION ON CHESTNUT ORCHARDS:
UNDERSTANDING THE SOIL AND PLANT WATER RELATIONS TO OPTIMIZE THE WATER MANAGEMENT
- Final version -
Doctoral thesis in Agronomical Sciences and Forestry
MARIA MARGARIDA DE OLIVEIRA MOTA Supervisors:
Prof. Doctor José Carlos Esteves Gomes-Laranjo, Associate Professor at Universidade de Trás-os-Montes e Alto Douro;
Prof. Doctor Fernando Pedro Falcão Raimundo, Assistant Professor at Universidade de Trás-os-Montes e Alto Douro;
Company supervisor:
Eng. João Carlos Caço, Chief Executive Officer at Hubel Verde, SA.
Jury:
Prof. Doctor Ana Maria de Beja Neves Nazaré Pereira - President Prof. Doctor Francisco Lúcio dos Reis Borges - Vowel
Prof. Doctor Vicente Seixas e Sousa - Vowel Prof. Doctor Ana Maria da Silva Monteiro - Vowel Prof. Doctor Manuel Ângelo Rosa Rodrigues - Vowel Prof. Doctor José Carlos Esteves Gomes – Laranjo - Vowel
Prof. Doctor António Castro Ribeiro - Vowel
This thesis was exclusively made as an original dissertation to access the PhD degree in Agronomy and Forestry Sciences Engineering according to the RD law n. º 113/16 of July 13th.
The accomplishment of this thesis was supported by a PhD scholarship from Fundação para a Ciência e Tecnologia (Ref.: SFRH/BDE/52061/2012), co- financed by Fundo Social Europeu (FSE) and by Ministério da Educação e Ciência (MEC). The Hubel Verde SA, respecting the agreement entered into with the FCT under the PhD program in business environment, fulfilled the support provided during the course of the project
xi LIST OF CONTENTS ACKNOWLEDGEMENTS ... xv RESUMO ... xvii ABSTRACT ...xxi GRAPHICAL ABSTRACT ... xxv
LIST OF FIGURES ... xxvii
LIST OF SUPPLEMENTARY FIGURES ... xxxii
LIST OF TABLES ... xxxiii
LIST OF ABREVIATIONS ... xxxvii
THESIS STRUCTURE ... xli I. GENERAL INTRODUCTION ... 1
A. The project background: a partnership to strengthen the chestnut sector 1 B. Objectives ... 1
II. LITERATURE REVIEW ... 3
C. Taxonomy, botany and ecology of the sweet Chestnut tree ... 3
D. Past, present and future of the Portuguese chestnut sector ... 5
E. Irrigation management on fruit trees ... 11
Irrigation systems in fruit trees – how to irrigate? ... 11
Irrigation scheduling: when to irrigate and how much? ... 15
Deficit irrigation concepts ... 23
III. STUDY AREA ... 27
F. Site location and orchard characterization ... 27
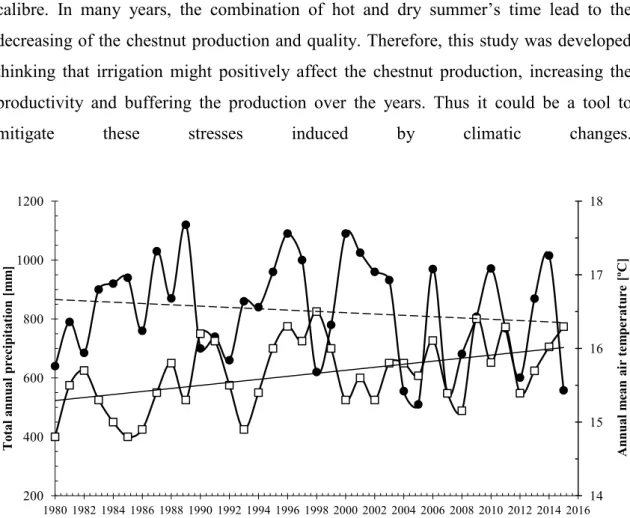
G. Meteorological characteristics ... 28
H. Soil physical and chemical characteristics ... 31
I. Experimental trial ... 33
IV. PHOTOSYNTHETIC TRAITS OF THE CHESTNUT TREE UNDER IRRIGATION ... 37
J. Efeitos da rega na produtividade fotossintética do castanheiro ... 37
Resumo ... 37
xii Introdução ... 39 Material e Métodos ... 39 Resultados e Discussão ... 41 Conclusões... 44 Agradecimentos ... 45
K. Understanding the photosynthetic productivity and stem water potential relationship in Castanea sativa to support irrigation decision ... 49
Resumo ... 49
Abstract ... 49
Abbreviations ... 50
Aknowledgments ... 50
Introduction ... 51
Material and methods ... 52
Results ... 55
Discussion ... 60
Conclusion ... 63
Tables and Figures... 64
Supplementary Figures ... 71
L. The effect of irrigation on chestnuts’ physiology and production (Castanea sativa) ... 75
Resumo ... 75
Abstract ... 75
Introduction ... 76
Material and methods ... 78
Results ... 80
Discussion ... 81
Conclusion ... 83
Acknowledgements ... 83
Tables and Figures... 84
V. THE EFFECT OF IRRIGATION ON CHESTNUT’S QUALITY ... 89
M. Irrigation positively affects the chestnut’s quality: the chemical composition, fruit size and sensory attributes ... 89
Resumo ... 89
Abstract ... 89
Introduction ... 90
xiii
Results ... 95
Discussion ... 99
Conclusions ... 104
Acknowledgments ... 105
Tables and Figures... 106
VI. SOIL AND PLANT WATER RELATIONSHIP AND THE WATER MANAGEMENT ... 113
N. Monitorizar para regar: o caso do castanheiro (Castanea sativa) ... 113
Resumo ... 113 Abstract ... 113 Introdução ... 114 Material e métodos ... 117 Resultados e discussão ... 120 Conclusão ... 123 Agradecimentos ... 123 Tabelas e Figuras ... 124
O. Relating plant and soil water’s content to encourage smart irrigation on chestnut trees ... 131
Resumo ... 131
Abstract ... 131
Introduction ... 132
Material and methods ... 134
Results and Discussion ... 137
Conclusion ... 141
Acknowledgements ... 141
Tables and Figures... 142
VII. ECONOMICAL ANALISYS OF THE CHESTNUT ORCHARD WHEN IRRIGATED VS. NON-IRRIGATED ... 147
P. Study on yield values of two irrigation systems in adult chestnut trees and comparison with non-irrigated chestnut orchard ... 147
Resumo ... 147
Abstract ... 147
Introduction ... 148
Material and Methodology ... 150
Results ... 152
xiv
Conclusion ... 159
Acknowledgements ... 159
Tables and Figures... 160
VIII. CONCLUSIONS ... 165
Q. General Discussion ... 165
R. Final considerations ... 171
xv
ACKNOWLEDGEMENTS
I could not fail to express my gratitude to all those who, in a different way, contributed to the conclusion of this work. I want to express my sincere gratitude to all of them. Firstly, I want to thank the person that challenged me to do a PhD programme and so gave me the opportunity to do it. I want to thank for all the trust and support from the beginning and for the continued encouragement over the years. Without her vision and openness to do things differently nothing would have started. Thank you to Drª Isabel Conceição.
Thank you to Prof. Doctor José Gomes-Laranjo, who from the beginning was the greatest enthusiast of this project and thanks for having maintained the trust, determination and commitment over the years. His deep knowledge on Chestnut trees was valuable across these years of study and his passion for the Chestnut tree is contagious and, thanks to that, this work has been carried out as well as many other projects that have arisen in the Portuguese chestnut sector.
Thank you to Prof. Doctor Fernando Raimundo for his valuable scientific knowledge and for its availability on the implementation and accompaniment of the project. Thank you for your critical comments and support on the field work.
Thank you to Prof. Doctor Teresa Pinto for your unconditional support since the beginning of the project, in the field measurements and, in the text revision, always with your pertinent questions and sensitivity to the details.
Many thanks to all people that work in Geosil – Empreendimentos Agro-Silvícolas, for allowing the use of part of the chestnut orchard for the experiment and for their help in the field. Thank you to Eng.º Vasco Veiga, Mr. João, Mis. Luísa and Eng.º Bruno Veiga. Special thanks to Eng.º António Borges, for his tireless work, dynamism and constant support since the project's design, implementation and accompaniment during the years.
Many thanks to all the people of Hubel Verde SA that, in one way or another, supported this work. Thank you to Eng.º João Caço, Eng.º Humberto Teixeira and Eng.º Luís Gamito, for your constant support and immeasurable patience. Thank you to Michaela
xvi
Mestre for your tireless work, intelligence and professionalism. Thank you to João Silva for your valuable support on the working of the devices used during the experiment. Thank you to Prof. Doctor Nazaré-Pereira and Prof. Doctor José Luis Louzada as Directors of the Doctoral Class of Agronomy and Forestry Sciences Engineering.
Many thanks to all other Professors at the University of Trás-os-Montes and Alto Douro that contributed to the progress of the work and that gave me motivation through the years, mainly the Prof. Doctor Rosário Anjos, Prof. Doctor Jorge Ferreira-Cardoso, Prof. Doctor Alice Vilela, Prof. Doctor Afonso Martins and Prof. Doctor João Coutinho. Many thanks to the Fundação para a Ciência e Tecnologia, FCT, for the financial support of the scholarship and for creating PhD programmes that pulls together enterprises and research centres.
Thank you to Tiago Marques for helping in the field and in the laboratory, your constant availability and hard work was priceless. Thank you to Helena Ferreira and Cesaltina Carvalho for your valuable help in the laboratory.
Thank you to all my friends who motivated me all the time. Thank you especially to Pedro Fonseca who, besides his valuable help in the English revision, has been a precious partner with all his love, confidence and patience.
Finally a deep thank you to my family that always believed in me and in my work and that had an infinite patience and comprehension when I arrived late to the family meetings or when I had to get up early for the field work and my daughter was in their care. Thank you to my uncles and cousins, to my grandmother, to my brother and, particularly, to my parents to whom I owe all my education, and personal growth. Thank you to Núria, my daughter, for being my source of strength and for being a child so sweet and patient to her mother. This is for you.
xvii
RESUMO
Em Portugal as maiores manchas de castanheiro (Castanea sativa Mill) situam-se nas regiões de Trás-os-Montes e Alto-Douro, Beira Alta e Minho. O castanheiro é tradicionalmente cultivado em condições de sequeiro, tipicamente em zonas montanhosas, em diferentes condições edáficas e climáticas, mas que transversalmente possuem verões quentes e secos e invernos húmidos e frios. Nos últimos anos, devido a uma série de fatores de natureza económica (competitividade dos mercados internacionais e forte incremento na procura de castanha em quantidade e qualidade) e climática (verões cada vez mais quentes, secos e prolongados) têm obrigado a uma adequação do modelo de cultura, nomeadamente a introdução da rega no castanheiro, de forma a promover uma maior regularidade da produção e o aumento da produtividade do souto. No entanto, há uma série de questões que se levantam à volta deste tema, tão inexplorado no sector: qual o custo/benefício da rega no castanheiro? Qual o efeito na produção? Qual o sistema de rega mais adequado? Como fazer a gestão da rega por forma a usar conscientemente os recursos hídricos? Foi no sentido de dar resposta a estas questões que traçaram-se os objetivos gerais deste trabalho: caracterizar o potencial produtivo do castanheiro regado e encontrar a melhor forma de gerir a água de rega.
O estudo realizou-se durante quatro anos (2013 a 2016) num souto plantado em 1993, no concelho de Bragança, com as variedades ‘Longal’ e ‘Judia’ enxertadas em porta-enxerto seminal de C. sativa., nas condições edafo-climáticas da região da Terra Fria em Trás-os-Montes. Inicialmente, 2013 e 2014, instalou-se no campo experimental um sistema de rega por micro-aspersão com o objetivo primário de avaliar a produtividade fotossintética do castanheiro sob diferentes regimes hídricos por forma a definir um valor de potencial hídrico que refletisse as melhores condições produtivas do castanheiro. Para isso, foram delineados três tratamentos: NI- sequeiro (não foi aplicada qualquer rega ao longo do ciclo), DI - rega deficitária (a rega foi ativada sempre que o potencial hídrico às 9 h da manhã fosse inferior a -0.8 MPa) e FI - rega máxima (a rega foi ativada sempre que o potencial hídrico às 9 h da manhã fosse inferior a -0.6 MPa). Mais tarde, em 2015 e 2016 instalou-se uma parcela experimental no mesmo souto com dois tipos diferentes de sistemas de rega. Os tratamentos aplicados foram NI-sequeiro (não foi aplicada qualquer rega ao longo do ciclo), TI - rega gota-a-gota (a rega foi
xviii
ativada cada vez que o potencial hídrico de ramo do meio-dia fosse inferior a -1.2 MPa) e SI – rega micro-aspersão suspenso (a rega foi ativada sempre que o potencial hídrico de ramo do meio-dia fosse inferior a -1.2 MPa). Nesta fase, pretendeu-se avaliar a resposta fisiológica do castanheiro, a sua produção e a qualidade da castanha; fazer um balanço económico sobre custo/benefício da rega nos soutos; e por fim, estabelecer guias orientadoras para a gestão da rega no castanheiro com base em parâmetros da planta e do solo. Foram avaliados diversos parâmetros às plantas (potencial hídrico, temperatura foliar, pigmentos foliares fotossintéticos, fluorescência da clorofila, análises minerais e trocas gasosas), ao solo (conteúdo da água no perfil do solo, potencial mátrico do solo e análises minerais), à castanha (produção, curva de crescimento do fruto, calibre, análise química e sensorial) e clima (precipitação, soma das temperaturas, temperatura do ar, humidade relativa e evapotranspiração de referência).
O ano de 2014 foi um verão excecionalmente húmido e as regas não foram ativadas. Não obstante, este facto reflete a otimização do uso da água quando a rega é baseada no potencial hídrico da planta. Em 2013, as regas realizadas (num total de 1490 m3 ha-1 em
FI e 600 m3 ha-1 em DI) foram suficientes para se observarem diferenças nomeadamente
nas medições feitas ao meio-dia. As árvores regadas apresentaram potenciais hídricos mais altos, maiores taxas fotossintéticas e maiores níveis de transpiração que, por sua vez, tiveram um efeito termorregulador na temperatura foliar e, no final, produziram mais 72% de castanha. Nas condições deste ensaio, verificou-se que as árvores de todos os tratamentos, incluindo as não regadas, apresentavam ao início da manhã valores elevados de potencial hídrico, provavelmente devido à absorção de água, existente nas camadas mais profundas do solo e cuja presença não é tão facilmente influenciada por condições de rega. No entanto a presença ou não de níveis hídricos adequados nas camadas mais superficiais, que permitam processos de absorção mais rápidos, induziram diferenças significativas no potencial hídrico ao meio-dia sugerindo o interesse deste parâmetro na gestão da rega. Uma vez que as maiores taxas fotossintéticas foram observadas quando os potenciais hídricos ao meio-dia se situavam entre -1.0 e -1.2 MPa, este último foi o valor definido para se ativar a rega no ensaio de 2015 e 2016.
O ano de 2016 revelou-se mais quente e mais seco do que o de 2015 e registaram-se frequentemente potenciais hídricos abaixo de -1.2 MPa, implicando maior aporte de
xix
água em 2016 (870 m3 ha-1 em TI e 979 m3 ha-1 em SI) do que em 2015 (460 m3 ha-1 TI
e 480 m3 ha-1 em SI). No que diz respeito à produção, esta foi sempre superior nas árvores regadas embora a produção decrescesse dum ano para o outro (de 52 para 44 kg árvore-1 em SI; de 54 para 43 kg árvore-1 em TI e de 44 para 33 kg árvore-1 em NI de 2015 para 2016, respetivamente). O tamanho da castanha também decresceu de um ano para o outro, embora tenha sido sempre maior nos tratamentos regados (de 65 para 122 frutos kg-1 em NI; de 62 para 89 frutos kg-1 em TI e de 63 para 79 frutos kg-1 em SI de 2015 para 2016, respetivamente). Não foram encontradas diferenças significativas entre os tratamentos quanto à composição química e sensorial da castanha. Estes resultados são importantes pois revelaram que a rega acrescentou valor comercial à castanha, não só porque aumentou a produção e melhorou o seu tamanho, mas sobretudo porque estas vantagens não interferiram negativamente na qualidade nutricional e sensorial da castanha. A nível fisiológico, os potenciais hídricos, as taxas fotossintética e de transpiração foram mais altos nas árvores regadas. A fluorescência da clorofila revelou-se um método pertinente na avaliação da performance fotossintética do castanheiro. O estudo económico revelou que os custos anuais foram maiores em SI (4.654 € ha-1) e TI
(4.549 € ha-1) do que em NI (1.530 € ha-1), tendo a maior receita (22.126 € ha-1 em TI,
21.984 € ha-1 em SI e 16.174 € ha-1em NI) compensado o investimento. O sistema de
gota-a-gota tem um investimento menor do que o de micro-aspersão suspenso e, para resultados semelhantes, consome menos água. No entanto, o sistema de micro-aspersão apresenta vantagem pela facilidade de limpeza de infestantes na linha e, tendo maior área regada, pode aumentar o potencial de produção de cogumelos não obstante poder ser limitativo se potenciar a dispersão de doenças, como o cancro. No final, as correlações positivas obtidas entre o potencial hídrico do castanheiro, a taxa fotossintética, conteúdo de água no solo e do potencial mátrico do solo permitiram indicar um modelo de gestão da água no castanheiro baseado em parâmetros do solo que, por sua vez, podem ser monitorizados à distância num lógica de “rega inteligente”. Este estudo contribuiu para aprofundar o conhecimento sobre as relações hídricas entre solo e planta, definir valores de referência para a gestão da água no castanheiro e avaliar os benefícios da rega no castanheiro. No entanto, e como seria de esperar de um tema tão recente no sector da “castanhicultura”, ainda é muito escassa a informação que existe e demasiadas as interrogações que se colocam. Futuramente, devem ser conduzidos estudos com vista a testar e aperfeiçoar outras formas de gestão da água de
xx
rega, introduzir e avaliar outros tipos de sistema de rega que não só sejam mais eficientes como também se coadunem com as práticas culturais do souto, e estudar o efeito da rega em soutos com diferentes sistemas de condução, com outras variedades e noutros tipos de solo.
xxi
ABSTRACT
The largest chestnut tree (Castanea sativa Mill) areas in Portugal are situated in the Trás-os-Montes, Alto-Douro, Beira Alta and Minho regions. The Chestnut tree is typically cultivated in mountainous places with different types of soil and climatic conditions that, however, usually have dry and warm summers and cold and wet winters. Due to a series of economic (for example; competition of foreign markets and the increased demand for quality chestnuts) and climatic factors (longer, drier and hotter summers) the introduction of irrigation on the chestnut orchards has become a standard practice in order to achieve production increase and regularity. There are however a few questions that arise around this unexplored theme; what is the cost/benefit of the irrigation for Chestnut trees? What is the most adequate system? How to manage irrigation in order to save precious hydrological resources? Answering these questions was the driver behind the objectives of this work: characterizing the productive response of the chestnut tree after the introduction of irrigation and finding the best way to manage the available water.
The study was conducted during four consecutive years (2013 to 2016), with the soil and climatic conditions of Trás-os-Montes, on a 20-year-old orchard with ‘Longal’ and ‘Judia’ varieties, and the trees were 5 meters apart on the row and 10 meter on the inter row. The study evolved from an experimental trial in 2013 and 2014 on which a micro-sprinkler system was installed. Evaluating the photosynthetic productivity of the chestnut tree under different hydrological regimes was the main objective of this study in order to define a water potential value that better reflects the best productive conditions of the chestnut tree. And so, three treatments were done: NI – non-irrigated (no irrigation was applied during the cycle), DI – deficiently irrigated (irrigation was activated every time the water potential was below -0.8 MPa) and FI – fully irrigated (irrigation was activated every time the dawn water potential was below -0.6 MPa). Later, in 2015 and 2016 a trial was set up on the same orchard with two types of irrigation systems. The applied treatments were NI (no irrigation was applied during the cycle), TI – drip irrigation (it was activated every time the midday stem water potential was below -1.2 MPa) and SI – micro-sprinkler irrigation (it was activated each time the midday stem water potential was below -1.2 MPa). This trial’s main objective was to evaluate the chestnut tree’s physiological response, production and nut quality; to make
xxii
an economical assessment about the cost/benefit of the irrigation and on the absence of it and, at last, to establish guidelines for the management of irrigation of the chestnut trees based on soil and plant parameters. Several data points from the plants were gathered (water potential, foliar temperature, foliar photosynthetic pigments, chlorophyll fluorescence, mineral analysis and gaseous exchanges), from the soil (water content, water potential and mineral analysis), from the chestnuts (production per tree, fruit growth, calibre and a sensorial and chemical analysis) and from the climate (precipitation, temperature sums, air temperature, relative humidity and reference evapo-transpiration).
2014 was an exceptionally humid summer and since every plant’s water potential was above the limits set to initiate irrigation no treatment was applied. Regardless, this fact reflects the optimization of water use for irrigation whenever this is triggered/ managed by the water potential. For 2013 the applied irrigation (a total of 1490 m3ha-1 for FI and
600 m3ha-1 for DI) wetted the soil’s superficial layers and it was enough to make a
difference on the midday measurements. The irrigated trees produced more chestnuts, presented a higher water potential, higher photosynthetic rates and higher transpiration levels that, in turn, had a thermoregulatory effect on the foliar temperature. Every tree recovered their hydric comfort during the night, independently of the irrigation, most likely because of the water absorption by the deeper roots. Therefore, for irrigation management look more interesting to use the readings of the water potential at midday. Since the highest photosynthetic rates were found when the midday water potential was between -1.0 and -1.2 MPa this last one was the chosen value to trigger irrigation on the 2015 and 2016 trials.
2016’s summer was warmer and drier than 2015 and, consequently, the midday stem water potential values was several times below -1.2 MPa. As consequence, it was necessary to use more water in this year (870 m3ha-1 in TI and 979 m3ha-1 for SI) than in
2015 (460 m3ha-1 in TI and 480 m3ha-1 for SI). The chestnut production was always
higher on the watered trees although it decreased from one year to the next (52 to 44 kg tree-1 in SI; 54 to 43 kg tree-1 in TI and 44 to 33 kg tree-1 in 2015 and 2016,
respectively) and this happened to the nut size as well although it was always bigger in the watered treatments (65 to 122 fruits kg-1 for NI; 62 to 89 fruits kg-1 for TI and 63 to
79 fruits kg-1 for SI in 2015 and 2016, respectively). No significant differences between
xxiii
the irrigation added commercial value to the chestnut because it not only increased the production as it increased fruit size and did not interfere with the chemical and sensorial compositions of the fruit. At a physiological level, the stem water potential, the photosynthetic and transpiration rates were higher for irrigated trees and the chlorophyll fluorescence has proved to be a relevant method when evaluating the chestnut tree’s photosynthetic performance. The economic study revealed that the annual costs were higher for SI (4.654 € ha-1) and TI (4.549 € ha-1) than for NI (1.530 € ha-1) but a higher revenue (21.984 € ha-1for SI, 22.126 € ha-1 for TI and 16.174 € ha-1 for NI) made up for
the investment. The drip system required a smaller investment than that of the suspended micro-sprinkler system and, for similar results, it consumes less water. The micro-sprinkler system has the advantage to be easier to clean the line weeds and also the larger wet area may promote larger mushroom growth’s area; however, it can also promote disease spread. In the end, the positive correlations between the plant’s water potential, photosynthetic rate, soil water content and soil water potential allow the formation of a water management model based on soil parameters that, in turn, can be monitored remotely and help to the decision to irrigate.
This study has contributed to build knowledge on hydric relations between soil and plant, to define reference values for chestnut tree water management and to evaluate the benefits of the introduction of irrigation in this culture. As expected however, there are too many questions to answer and information is still scarce on this new sector of the chestnut production. Future studies should test and perfect other types of irrigation water management, introduce and evaluate other types of irrigation systems, to determine the water needs of the chestnut tree based on evapo-transpiration values of trees with different ages and of other varieties and in different types of soil and different training systems.
xxv
GRAPHICAL ABSTRACT
xxvii
LIST OF FIGURES
Fig. C-1 - Castanea sativa detailed photos. ... 4 Fig. D-1 - Castanea sativa dispersion map. ... 5 Fig. D-2 - Climatic features over the last few decades on the Bragança Region. ... 10 Fig. E-1 - Examples of drip line with sublateral loop and drip system with single or
double line ... 12
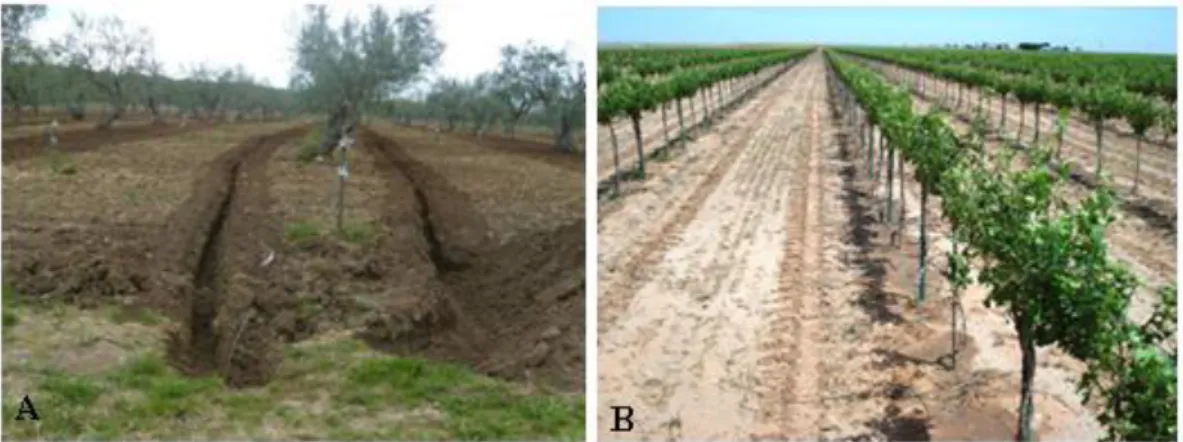
Fig. E-2 - Hanging micro-sprinkler irrigation and micro-sprinkler irrigation. ... 13 Fig. E-3 - Double surface drip line in olive trees and simple subsurface drip line in
vineyards ... 14
Fig. E-4 - Representation of the incoming and outgoing water flux into the crop root
zone, the soil water balance...17
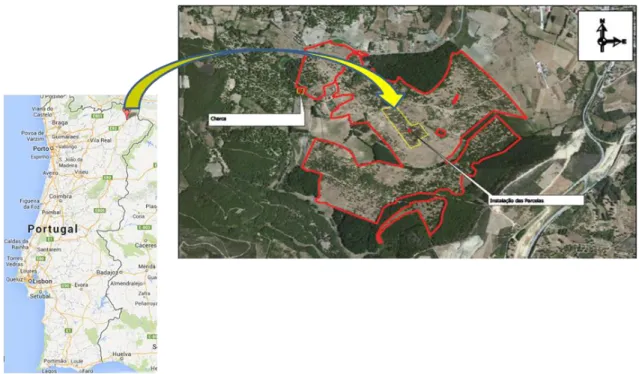
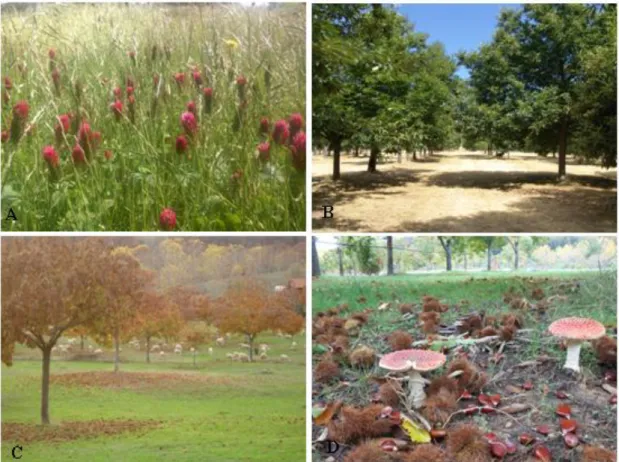
Fig. E-5 - Soil-Plant-Atmosphere Continuum representation...25 Fig. F-1 – Location of the study area ... 27 Fig. F-2 - Landscape of the farm and study area... 28 Fig. G-1- Climatic features over the study years ... 30 Fig. H-1- Photos of the soil profile for detailed soil characterization. ... 33 Fig. I-1- Experimental plot of 2013 and 2014 with micro-sprinkler system (FI and DI),
non irrigated trees (NI).. ... 34
Fig. I-2- Experimental plot of 2015 and 2016 with micro-sprinkler system (SI), drip
system (TI), non irrigated trees (NI) and border trees (Br).. ... 35
Fig. J-1- Potencial hídrico (MPa) em 2013. Potencial hídrico foliar de base (Ψwpd),
potencial hídrico foliar às 9h (Ψwm) e potencial hídrico foliar ao meio-dia
(Ψwmd) no tratamento não irrigado (NI), Rega deficitária (DI) e Rega plena
(FI). ... 45
Fig. J-2- Conteúdo de água no solo (%) no tratamento não regado (NI), na rega
deficitária (DI) e em rega plena (FI) para 10, 20, 30, 40, 60 e 80 centímetros de profundidade em 2013. . ... 46
Fig. K-1 - Time course of dawn water potential (Ψwd, MPa) for non-irrigated treatment
(NI), deficiently irrigated (DI) and fully irrigated (FI) system, in 2013. Precipitation (PP, mm) is represented by grey columns and Irrigation (I, mm) is represented by dashed columns for FI and by full black columns for DI and FI in 2013. ... 64
xxviii
Fig. K-2 - Time course of water potential (in MPa) at predawn, dawn and midday for
non-irrigated treatment (NI), deficiently irrigated (DI) and fully irrigated (FI) systems. Vertical dashed line refers to FI irrigation date and vertical full line refers to DI and FI irrigation date ... 65
Fig. K-3 - Time course of RWC of non-irrigated treatment (NI), deficiently irrigated
system (DI) and fully irrigated system (FI) in 2013. Vertical dashed line refers to FI irrigation date and vertical full line refers to DI and FI irrigation date in 2013. ... 66
Fig. K-4 - Gas exchanges during dawn period respectively for A) photosynthetic rate
PNd [μmol CO2 m-2 s-1], B) transpiration rate Ed [mmol H2O m-2 s-1] and C)
stomatal conductance gsd [mmol m-2 s-1] for non irrigated (NI), full irrigated
(FI) and deficit irrigated (DI) systems. Vertical dashed line refers to FI irrigation date and vertical full line refers to DI and FI irrigation date in 2013.
... 67 Fig. K-5 - Gas exchanges during midday period respectively for A) photosynthetic rate
PNmd [ μmolCO2 m-2 s-1], B) transpiration rate Emd [mmolH2O m-2 s-1] and C)
stomatal conductance gsmd [mmol m-2 s-1] for non irrigated (NI), full irrigated
(FI) and deficit irrigated (DI) systems. Vertical dashed line refers to FI irrigation date and vertical full line refers to DI and FI irrigation date in 2013.
... 68 Fig. K-6 - Relationship between photosynthetic rate PN [μmol CO2 m-2 s-1] and
transpiration rate Ed[mmol H2O m-2 s-1] at the dawn time and midday time. 69 Fig. K-7 - Relationship between transpiration rate E [mmol H2O m-2 s-1] and water
potential Ψw [MPa] at dawn (A) and midday (B) time, and relationship between photosynthetic rate PN [μmol CO2 m-2 s-1] and water potential Ψw
[MPa] at dawn (C) and midday (D) time. ... 69
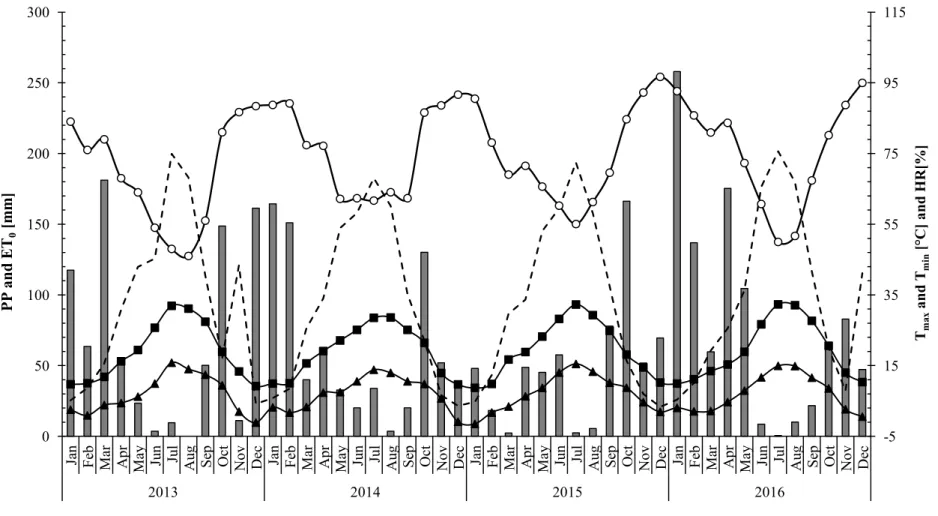
Fig. L-1 - Monthly total precipitation (PP, in mm) and evapotranspiration of reference
(ET0, mm), monthly minimal (Tmin) and maximal (Tmax) air’s temperature
(°C) and air relative humidity (HR, %) during 2015 and 2016 in Bragança region ... 84
Fig. L-2 - Time course of midday stem water potential (Ψwmd, MPa) in 2015 and 2016
for non irrigated, drip irrigated and micro sprinkler irrigated trees. Grey bars represents the irrigation events. ... 84
xxix
Fig. L-3 - A ‘spider plot’ of selected parameters characterizing the behaviour of
Photosystem II in non-irrigated, drip irrigated and micro-sprinkler irrigated trees, in September 11th 2015 (left) and at September 28th 2016 (right). All values are shown as percent of control (control plants = 100). ... 85
Fig. L-4 - Photosynthetic rate (Amd, µmolCO2.m-2.s-1) and transpiration rate (Emd,
mmol H2O.m-2.s-1) measured at midday in non irrigated (NI), drip irrigated
(TI) and micro-sprinkler irrigated (SI) trees in 2015 and 2016. ... 85
Fig. L-5 - Curve of the chestnut growth given in fresh weight per individual fruit for
none irrigated, drip irrigated and micro-sprinkler irrigated trees, in 2016. ... 86
Fig. M-1- Experimental plot in 2015 and 2016 with micro-sprinkler system (SI), drip
system (TI), non-irrigated trees (NI) and border trees (Br).. ... 106
Fig. M-2 - Monthly total precipitation (PP, mm) for 2015 and 2016 and on the average
of the decades 1980-2010; Evapotranspiration (ET0, mm), mean monthly air’s
temperature (Tmed, °C) during 2015 and 2016 and on the decades 1980-2010
in Bragança region. ... 107
Fig. M-3- Principal Components Analysis based on correlation (Corr-PCA) projection
of the chestnut chemical composition and production in 2015 and 2016.. .. 109
Fig. M-4 - Sensory profile of the cooked chestnuts from non-irrigated (NI), drip
irrigated (TI) and micro-sprinkler irrigated (SI) treatment in 2016.. ... 109
Fig. M-5 - Principal Components Analysis based on covariance (Cov-PCA) projection
of the sensorial attributes evaluated in the cooked chestnuts... 110
Fig. M-6 - Principal Components Analysis based on correlation (Corr-PCA) of
chemical and sensory data obtained in the 2016 harvest. NI 2016 - non-irrigated, TI 2016 - drip irrigated and SI 2016 - micro-sprinkler irrigated. . 110
Fig. N-1 - Valores de temperatura média mensal (Tm, °C), humidade relativa do ar
média mensal (HR, %) , pecipitação total mensal (PP, mm) e somatório graus dias (GDD, °C) de janeiro 2015 a outubro 2015, registados pela estação meteorológica ET 2900. ... 124
Fig. N-2 - Evolução do potencial hídrico de ramo (MPa) e do Deficit Pressão Vapor
(KPa) ao longo do estudo para tratamento não regado (NR) e regado (RR) em 2015.. ... 125
Fig. N-3 - Evolução do conteúdo de água no solo (cm3 H
2O 100cm-3 solo) aos 30cm,
xxx
Fig. N-4 -Correlação entre potencial hídrico de ramo (MPa) e conteúdo de água no solo
(cm-3 H2O 100 cm-3 solo, gráfico A) e potencial hídrico de ramo (MPa) e
tensão matricial do solo (cbar, gráfico B) para os 30cm de profundidade e 60 cm em 2015.. ... 127
Fig. N-5 - Correlação entre potencial de ramo (MPa) das árvores regadas e Défice de
Pressão de Vapor (KPa) calculado às 13 horas em 2015. ... 128
Fig. N-6 - Correlação entre conteúdo de água no solo (cm3 H
2O 100cm-3solo) e a tensão
matricial do solo (cbar), a todas as profundidades ... 128
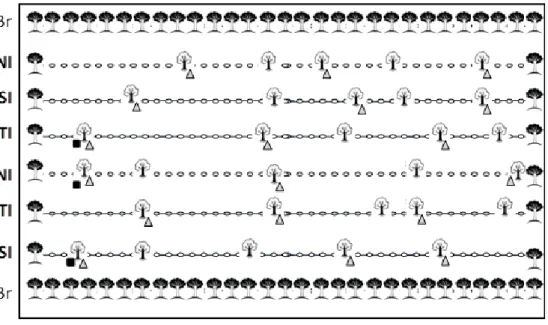
Fig. O-1 - Experimental plots: in 2013/14 with micro-sprinkler system (FI and DI), non
irrigated trees (NI) and border trees (Br); in 2015/16 with micro-sprinkler system (SI), drip system (TI), non irrigated trees (NI) and border trees (Br).
... 142 Fig. O-2 - Monthly total precipitation (PP, mm), total monthly evapotranpiration of
reference (ET0, mm), average of the water applied in the two irrigated
treatments in 2013 (FI - full irrigated and DI - deficit irrigated) and in 2015/2016 (SI - micro-sprinkler irrigation and TI - drip irrigation) (W, mm), monthly mean air temperature (Tmed, °C) and monthly mean air relative
humidity (HR, %), during the year 2013, 2014, 2015 and 2016. ... 142
Fig. O-3 - Season pattern for irrigated treatment and non-irrigated treatment of the
monthly mean midday stem water potential (Ψwmd, MPa); mean of the daily
maximum temperature occurred in the measuring days (Tmax, ºC), monthly
mean soil water content (ϴavg, %) on the 10 to 40 cm depth and on the 50-80
cm depth.. ... 143
Fig. O-4 - Photosynthetic rate (Amd, in µmolCO2 m-2 s-1) and midday stem water
potential (Ψwmd, in MPa) regression for all irrigated and non irrigated trees. A|100| is the maximal photosynthetic rate found with the regression and A|90| is
the admissible decay from the maximal photosynthetic rate (-10%) ... 144
Fig. O-5 - Regression between midday stem water potential (Ψwmd, MPa) for all
irrigated and non irrigated trees and the mean soil water content (ϴavg, %) of
the toppest 10 - 40 cm and of the 50-80 cm soil depth.. ... 144
Fig. O-6 - Midday stem water potential (Ψwmd, MPa) of watered trees and soil water
matric potential average of 30 and 60 cm (Ψwm soil, in cbar) relationship. ... 145
Fig. P-1 - Photos of the irrigated systems plots. Left: Drip system, two pipes per row of
xxxi
Fig. P-2 - Delimited area of harvesting below the trees canopy by a red stripe tape for
determination of chestnut production per tree. ... 160
Fig. P-3 - Mean monthly maximal (Tmax) and minimal (Tmin) temperature (°C), mean
monthly relative air humidity (HR, %), total monthly precipitation (PP, mm) and total evapotranspiration of reference (ET0, mm) for 2015 and 2016. ... 161 Fig. P-4 - Monthly mean of midday stem water potential (Ψwmd, MPa) for non-irrigated
(NI), drip irrigated (TI) and micro-sprinkler irrigated (SI) treatment. Monthly mean soil water content on the average 10 to 40 cm soil depth (θ10—40cm, %)
for NI (black bars), TI (white bars) and SI (grey bars). Monthly mean maximum air temperature on the measurement days (Tdmax, in °C) is
xxxii
LIST OF SUPPLEMENTARY FIGURES
Supplementary Fig. K-1 - A: Mean monthly temperature (Tmed,°C) , growing degree
days (GDD, °C) in 2013 and on the decade 1981-2010 for Bragança region. B: Monthly precipitation on the decade 1981-2010 (PP1981-2010,
mm); monthly precipitation in 2013 (PP2013, mm), cumulative monthly
evapotranspiration of reference (ET0, mm), air water potential (Ψwair,
MPa) in 2013. ... 71
Supplementary Fig. K-2 - Time course mean daily air temperature (Tmedd, °C) and leaf
temperature (Tleaf, °C) onthe shadowy canopy at dawn time and at
midday fornon-irrigated treatment (NI), deficiently (DI) and full (FI) irrigated system.. ... 72
Supplementary Fig. K-3 - A ‘spider plot’ of O-J-I-P test parameters of chestnut leaves
from non-irrigated (NI), deficiently (DI) and full (FI) irrigated treatments measured on dawn time (A) and midday (B) time. All values are shown as percent of control plants (NI plants = 100).. ... 73
Supplementary Fig. K-4 - Time course for total chlorophyll [mg cm-2] (A), total
carotenoids [mg cm-2] (B), chlorophyll/carotenoids ratio (C) and Chlorophyll a/b ratio (D) for non irrigated (NI), full (FI) and deficit irrigated (DI) treatment. ... 74
Supplementary Fig. O-1 - Variation of the soil water content at 20 cm, 40 cm, 60 cm
and 80 cm soil’s depth for non irrigated (NI), drip irrigated (TI) and micro-sprinkler irrigated (SI) treatments in 2015 (left) and 2016 (right). ... 146
xxxiii
LIST OF TABLES
Tab. D-1 - Total area (hectares), production (t) and calculated yield (t/ha) of chestnut
trees for the main producing countries and for the Portuguese regions. ... 7
Tab. H-1 - Morphological description of the soil profile of the hapli-dystric cambissol
of the trial ... 31
Tab. H-2 - Concentration of coarse elements (EC), coarse sand (SC), fine sand (FS), silt
(S), clay (C), organic matter content (OM) and pH values for different soil depth. ... 32
Tab. H-3 - Exchangeable Ca2+, Mg2+, K+ and Na+, Exchange acidity (EA), effective
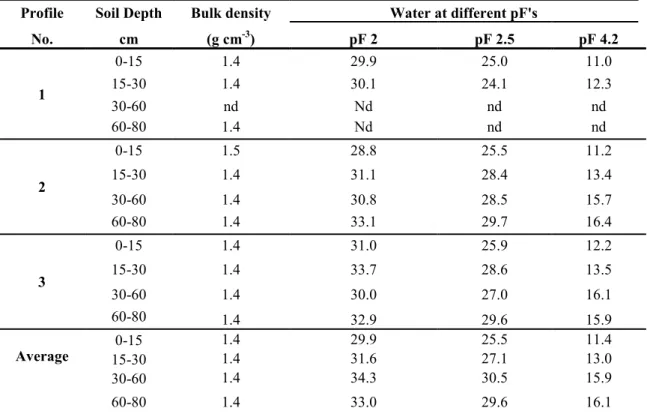
cation exchange capacity (ECEC), degree of base saturation (DBS) and extractable P2O5 and K2O from different soil depth. ... 32 Tab. H-4 - Volumetric soil water content (cm3 H
2O 100 cm-3soil) at field capacity (pF =
2.0), wilting point (pF = 4.2) and Bulk density for different soil depth. The ‘nd’ means not determined. ... 33 Tab. J-1- Transpiração, E (mmol H2O m-2 s-1), Fotossíntese, A (µmol CO2 m-2 s-1),
condutância estomática, gs (mmol m-2 s-1), eficiência carboxílica, A/ci (µmol
CO2 μbar-1) e Temperatura da folha, Tfolha. ... 47 Tab. J-2- Produção (kg/árv), calibre (n.º castanha/kg), n.º frutos viáveis por ouriço e n.º
ouriços por árvore em 2013. ... 48
Tab. K-1 - Average chestnuts’ production per canopy area P [kg m-2], chestnut’s calibre
[nuts tree-1], fruit setting (%), chestnuts’ density [g Ml-1], dry matter DM [g 100g-1fresh weight], ashes [g 100g-1DM], crude fat CF [g 100g-1DM] and crude protein CP [g 100g-1DM] (±se) for non-irrigated (NI), deficit (DI) and
fully (FI) irrigated treatment.. ... 70
Tab. L-1 - Chlorophyll a fluorescence parameters of non irrigated (NI), drip irrigated
(TI) and micro-sprinkler irrigated (SI) in chestnut trees of ‘Judia’, in 2016, before irrigation (June 30th and July 20th) and after irrigation (August 23rd and
September 28th). ... 87 Tab. M-1- Irrigation period, number of irrigation events and total water volume applied
in to the drip system (TI) and micro-sprinkler system (SI) in 2015 and 2016.
xxxiv
Tab. M-2 - Chestnut leaves’ mineral content for macronutrients and micronutrients for
non-irrigated (NI), drip irrigated (TI) and micro-sprinkler irrigated (SI) trees, in different dates along the vegetative cycle. ... 108
Tab. M-3 - Calibre (fruits per kilogram, mean ± SE) and density (g ml-1) for
non-irrigated (NI), drip non-irrigated (TI) and sprinkler-non-irrigated (SI) systems, in 2015 (n=185) and 2016 (n=211).. ... 108
Tab. M-4 - Dry matter (DM), organic matter (OM), ashes, soluble sugars (SS), starch,
crude fat (CF) and crude protein (CP) in the chestnuts from non-irrigated (NI), drip irrigated (TI) and sprinkler-irrigated (SI) systems, in 2015 (n=108) and 2016 (n=115), average of two years, and respective standard error (± SE).. ... 111
Tab. N-1 - Potencial hídrico foliar de base (Ψbase), potencial hídrico foliar ao meio-dia
(Ψmd), potencial hídrico de ramo (Ψramo) em MPa, referentes ao ano de 2014. ... 124 Tab. N-2 - Produção de castanha por árvore (kg), percentagem de castanhas boas ou
chocas por ouriço, calibre, densidade e matéria seca da castanha, em 2015, e respetivos desvio padrão (sd) e erro padrão (se).. ... 129
Tab. 0-1 - Bulk density and volumetric water content at field capacity (FC) measured
with a pF value of 2.0 (10 KPa) and permanent wilting point (WP) measured with a pF value of 4.2 (1500 KPa) on different soil depths from an adult chestnut orchard in the northeast of Portugal, obtained in laboratory by the method of the pressure plate. ... 145
Tab. P 0-1 - Irrigation system features and hydraulic data for drip and micro sprinkler
systems given by the irrigation system provider (Magos Irrigation System).
... 162 Tab. P 0-2 - Irrigation period, number of irrigation events and total water volume
supplied to drip system (TI) and micro sprinkler system (SI) in 2015 and 2016. ... 162
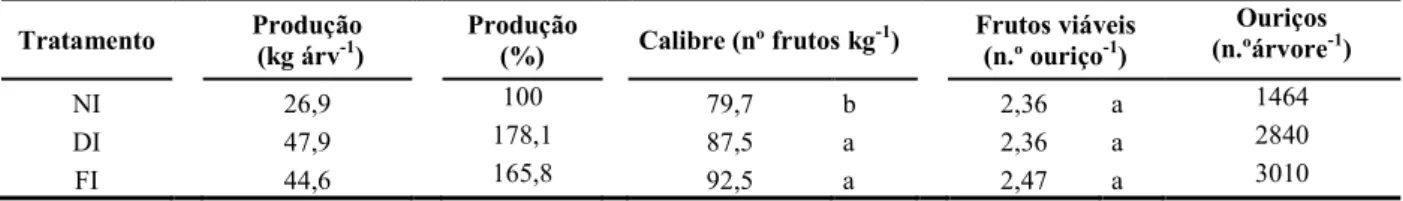
Tab. P 0-3 - Mean chestnut production per tree (kg of fresh weight/tree) and per square
meter of canopy area (kg of fresh weight/m2) with respective standard error
(± se) for drip (TI), micro sprinkler (SI) and non-irrigated (NI) treatments in 2015 and 2016. Comparisons were made within treatments.. ... 162
Tab. P 0-4 - Chestnut calibre (number of fruits per kilogram of fresh weight) with
xxxv
irrigated (NI) treatment in 2015 and 2016. Comparisons were done within treatments on the same year.. ... 163
Tab. P 0-5 - Chestnut market price to the producers in 2015 and 2016. Minimum price
(Min), maximum price (Max) and the most frequent price (Frequent). . .... 163
Tab. P 0-6 - Units and costs of the economic, water and labour resources in each 0.5 ha
of drip system (TI), sprinkler system (SI) and non irrigated system (NI) in 2015 and 2016, in an adult chestnut’s orchard with 200 trees per hectare. . 163
Tab. P 0-7 Annual costs during the amortization period (€/ha), annual income (€/ha)
and profits (€/ha) generated in one hectare of an adult chestnut orchard with tree density of 200 plants per hectare with drip system (TI), micro-sprinkler system (SI) and in non irrigated system (NI), considering a hotter (hot- growing degree days > 2400°D) and less hotter (mild - growing degree-days < 2400°D) year. ... 164
Tab. P 0-8 - Investment costs (in euros, €) of different components of drip (TI) and
micro-sprinkler (SI) irrigation systems on five hectares, including the equipment for monitoring leaf water potential and soil water content. ... 164
Tab. P 0-9 - Annual costs during the amortization period and income for five hectares
of a chestnut orchard more than 20 years old and with a tree density of 200 plants per hectare with drip system (TI) and micro-sprinkler system (SI) and in non irrigated system (NI), considering a hotter (hot- growing degree days > 2400°D) and less hotter (mild - growing degree-days < 2400°D) year. ... 164
xxxvii
LIST OF ABREVIATIONS
Chestnut chemical composition DM - Dry matter (g 100 g-1 FW); SS - Soluble sugars (g 100 g-1 DW); CF – Crude fat (g 100 g-1 DW); CP – Crude protein (g 100 g-1 DW); Meteorological parameters
GDD - Annual growing degree day (°D); VPD – Air vapour deficit;
Tleaf or Tfolha – Leaf’s temperature (°C);
Tmed - Mean monthly temperature (°C);
Tmédia d – Temperatura média diária (°C);
Tmax – Mean maximal monthly temperature (°C);
Tmax d Temperatura máxima diária (°C);
Tmin – Mean minimal monthly temperature (°C);
PP – Total monthly precipitation (mm); ET0 – Evapotranspiration of reference (mm)
Etc – Crop evapotranspiration (mm); Chlorophyll fluorescence parameters
ABS/RC - Absorbed energy flux per reaction centre (RC); TR0/RC - Trapped energy flux;
xxxviii
ET0/RC - Electron transport flux;
DI0/RC - Dissipated energy flux;
TR0/CS - Trapped energy flux per CS;
ET0/CS - Electron transport flux per CS;
DI0/CS - Dissipated energy flux per CS;
PIABS - Performance index on an absorption basis;
F0 - Chlorophyll fluorescence intensity measured when all PSII reaction centres are
assumed to be open, however, the measured value may be affected by several other parameters (at t=0);
FJ - Fluorescence intensity at the J-step during fluorescence induction (at 2 ms);
FI - Fluorescence intensity at the I-step during fluorescence induction (at 30 ms);
FM - Maximal chlorophyll fluorescence intensity measured when all PSII reaction
centres are closed;
TFM - Time needed to reach FM; FV/F0 - a value that is proportional to the activity of the
water-splitting complex on the donor side of the PSII; Area - the area above the chlorophyll fluorescence curve between F0 and Fm (reflecting the size of the
plastoquinone pool);
SM - (Area)/(Fm −Fo), Representing energy necessary for the closure of all reaction
centres;
N - The number indicating how many times QA is reduced while fluorescence reaches
its maximal value; VJ - relative variable fluorescence at time J; jpo/(1− jpo) - A ‘conformation’ term for primary photochemistry;
Y0/(1− Y0) - Conformation’ term for thermal reactions (nonlight dependent reactions);
xxxix
SFiABS - An indicator of PSII ‘structure and functioning’, calculated as (RC/ABS)×jpo; Fv/Fm - Maximum quantum yield of primary photochemistry (at t = 0).
Gas exchange parameters
A or PN - Photosynthetic rate (µmol CO2 m-2 s-1);
Amd or PNmd– Photosynthetic rate at 12:00 h (µmol CO2 m-2 s-1);
Ad orPNd – Photosynthetic rate at 09:00 h (µmol CO2 m-2 s-1);
E – Transpiration rate (mmol H2O m-2 s-1);
Emd or E12h– Transpiration rate at 12:00 h (mmol H2O m-2 s-1);
Ed or E9h – Transpiration rate at 09:00 h (mmol H2O m-2 s-1);
gs - Stomatal conductance (mmol m-2 s-1);
A/ci – carboxylic efficiency (µmol CO2 μbar-1) Photosynthetic pigments
Cartot – Total carotenoids (mg cm-2);
Chltot – Total chlorophyll (mg cm-2);
Chla/Chlb– Ratio of chlorophyll a and chlorophyll b; Chl/Car– Ratio of chlorophyll and carotenoids; Soil parameters
θsoil or θsolo – Soil water content (cm-3 H2O 100cm-3soil); θWP - Soil water content at wilting point (m3 m-3);
θFC - Soil water content at field capacity (m3 m-3);
xl
Zr - Rooting depth (m);
Ψwmsoil – Soil water matric potential (MPa);
Plant water parameters
Ψwd or Ψwm - Dawn water potential measured at 09:00 h (MPa);
Ψwpd or Ψwbase - Predawn water potential measured before sunrise (MPa); Ψwmd orΨwramo– Midday stem water potential (MPa);
Ψwl orΨww folha– Leaf water potential measured at daylight (MPa)
Ψws -Stem water potential (MPa)
RWC–Relative leaf water content (%);
Tleaf or Tfolha – leaf temperature (°C);
Treatments
NI – Trees were not irrigated during the whole chestnut’s vegetative cycle.
DI – Trees were deficiently irrigated – micro-sprinkler irrigation started when dawn
water potential was below -0.8 MPa
FI – Trees were full irrigated – micro-sprinkler irrigation started when dawn water
potential was bellow -0.6 MPa
SI – Trees were irrigated with a hanging micro-sprinkler when midday stem water
potentialwas below -1.2 MPa
TI - Trees were irrigated with a double line drip system when midday stem water
potentialwas below -1.2 MPa
RR – Árvores regadas por micro-aspersão e gota-a-gota sempre que potencial hídrico de
ramo ao meio dia era inferior a -1.2 MPa
xli
THESIS STRUCTURE
This manuscript was written based on four years of field work where two experimental trials were performed. The database from the field work was gathered according to specific objectives approached in different scientific articles which, by their turn, aim to answer the main objective of this project. The scientific articles are shown in the original language in what they were published. So, the thesis structure is composed by the following chapters:
CHAPTER I – GENERAL INTRODUCTION explains the background of this
project in terms of its conception and the entities evolved. It is made a brief statement of the irrigation problem on chestnut tree and the objectives are defined.
CHAPTER II- LITERATURE REVIEW makes a general characterization of the
European and in particular the Portuguese chestnut sector context. The chapter deals with the challenges that the chestnut sector will have in the near future which makes the bridge for the existence of this study. Because the main problematic is about water management, it is made an overview of this theme in other fruit crops that underpin the methodology used in this study.
CHAPTER III - STUDY AREA gives an overview of the study area; its location,
soil features and climatic condition as well as it describes the experimental trials.
CHAPTER IV – PHOTOSYNTHETIC TRAITS OF THE CHESTNUT TREE UNDER IRRIGATION is about various physiological features evaluated on the chestnut
trees and soil behaviour under different water regimes. It is composed by two scientific articles with data mainly from 2013, and by a third scientific article with data from 2015 and 2016.
CHAPTER V – THE EFFECT OF IRRIGATION ON THE CHESTNUT’S CHEMICAL COMPOSITION, FRUIT SIZE AND SENSORIAL ATTRIBUTES is
composed by one scientific article and it approaches the effect of irrigation on the chestnut fruit quality which concerns its biochemistry composition and sensorial parameters; results are from the years 2015 and 2016.
xlii
CHAPTER VI - UNDERSTANDING THE SOIL AND PLANT WATER RELATIONS ON CHESTNUT TREES TO IMPROVE WATER MANAGEMENT is
composed by two scientific articles which essentially reflect upon the soil and plant water relationship and gives primary directions about managing water in the chestnut orchards.
CHAPTER VII - ECONOMICAL ANALISYS OF THE CHESTNUT TREE IN IRRIGATED OR NON-IRRIGATED ORCHARDS is composed by one scientific article
which deals with the study on yield of the chestnut orchard when in rainfed or under two irrigation systems types and the database is from 2015 and 2016.
CHAPTER VIII - CONCLUSION finally, there is a general discussion about all
the works presented in this study and a general reflection on the objectives achievement.
CHAPTER VIII – REFERENCES where the references used to support this work
1
I. GENERAL INTRODUCTION
A. The project background: a partnership to strengthen the
chestnut sector
In Europe, chestnut production fruit (Castanea sativa Mill) are mainly from the Mediterranean countries and from traditionally rainfed orchards. In a context of climate change there is a prediction that summers will be longer, hotter and drier than in the past thus affecting healthy trees and inducing strong variations in fruit production. The chestnut is specie with considerable water needs during its vegetative cycle, especially during August and September. The introduction of irrigation with high water use efficiency by the trees might be the option for the future due to the increasing water restrictions in the Mediterranean countries.
The necessity to increase knowledge and innovation to face the upcoming challenges for this crop were on the basis of the present partnership between different entities over the last four years; GEOSIL – Empreendimentos Agrosilvícolas SA, a chestnut producing company and the owner of the orchard where the study was conducted; the specialized private company in irrigation systems, management and plant nutrition, Hubel Verde SA – Engenharia Agronómica; and the public scientific research entity with great experience in chestnut research, CITAB-UTAD – Trás-os-Montes e Alto Douro University. The collaboration of the Portuguese Association on Chestnut – Refcast was also very important.
The present thesis is the first study about chestnut irrigation and intends to answer many basic questions in order to give primordial information about a smart irrigation for chestnut trees and hopefully being useful for further studies.
B. Objectives
The starting point for this study is based on the certainty that water restriction influences the production of a chestnut orchard. Therefore, the main objective of this research work is to evaluate the contribution of irrigation on the increasing productivity and stabilizing annual production through a water management based on soil and plant water relations.
2 The following specific objectives were defined:
To evaluate the influence of irrigation on the chestnuts’ quality (production, calibre, chemical composition and sensorial attributes).
To deepen knowledge on the chestnut tree’s nutrition for further use in fertigation.
To identify, select and define values of plant parameters that are able to be used in water management;
To relate the plant with soil parameters to optimize the irrigation scheduling based on communicable soil devices;
To compare two irrigation systems: the hanging micro-sprinkler and the drip system;
To evaluate the economic feasibility of two types of irrigation systems on the chestnut orchard;
3
II. LITERATURE REVIEW
C. Taxonomy, botany and ecology of the sweet chestnut tree
The latin name of the European sweet chestnut specie is Castanea sativa Mill.. According to Cronquist (1968), the European chestnut presents the following taxonomic classification:
Kingdom: Plantae
Sub-Kingdom: Embryophyta (Cornophyta) Division: Spermatophyta (Anthophyta) Sub-Division: Angiospermae (Magnoliophytina) Class: Dicotyledonae (Magnoliopsida) Sub-Class: Hamamelidae
Order: Fagales Family: Fagaceae Sub-Family: Castaneoideae Genus: Castanea Specie: Castanea sativa
The Castanea sativa is a deciduous plant, with simple and alternate leaves, with oblong-lanceolate limbus, acute or acuminate apex, and crenate-serrated or serrated marginal cut (Fig. C-1, A). The root system is deep and steep, with most roots on the first 50 cm of soil (Fig. C-1, B) but the root’s depth naturally depends on the soil’s thickness and mobilization before plantation (Portela et al, 2007).
The chestnut tree is a monoecious tree with male and female flowers on the same plant. The male flowers are called catkins and can be unisexual (Fig. C-1, A) or androgynous with female inflorescences at the base of the catkin (Fig. C-1, C). Chestnut flowers are not self-compatible, so the pollination of the chestnut tree is mainly crossed. In general, and depending on climatic factors, the bloom happens from June to July, and it starts as soon as the sum of temperatures is at least 3,200 ºC (Fenaroli, 1945) and after the completed vegetative growth of the new branches where the catkins showed up (Guerreiro, 1957).
The fruit is a voluminous, reddish-brown achene that is protected by a dome (urchin) formed from the receptacle and covered by thorny bracts (Fig. C-1, D). The urchin is normally dehiscent and two to three fruits are released. The fruit maturation takes about 75 to 120 days since the pollination and it needs a sum temperature of about 2,100 to 2,500ºC after flowering (Gomes-Laranjo et al, 2007). In natural conditions, generally
4
the first yield occurs in 15 year-old trees but in grafted-chestnuts the first yield can happen after only 5 years.
The chestnut tree is widely dispersed in Europe between the 37°N to 53°N latitudes. In Portugal, it occupies soils from sea level on the sea cost (Madeira Island, Azores Island and Minho Region) up to 1000 m a.s.l. in the inner regions (Trás-os-Montes region) where annual mean maximal air temperature ranges from 27°C up to 31°C, respectively (Gomes-Laranjo et al, 2007). The annual mean precipitation must range between 600 and 2000 mm year-1 and solar radiation between 1,600 to 2,600 hours (Gomes-Laranjo et al, 2007). The sweet chestnut tree grows on a wide variety of soils but preferably in
deep, moderately fertile and acid soils with pH values around 6.0 (Portela et al, 2007; Dengiz et al, 2011).
Fig. C-1Castanea sativa detailed photos of: A) serrate leaves and unisexual catkins in bloom; B)
deep roots; C) androgynous catkins with the female flower at the base; D) bur with three sweet chestnuts.
5
D. Past, present and future of the Portuguese chestnut sector
Chestnut trees have a millenary presence in Portugal witnessed by trace fossils from different ages (Abreu, 2007). Most probably, the European chestnut tree has its origin in the Chinese chestnut (Castanea molissima Bl.) and its European dispersion began in the mountain regions of Anatolia in Turkey (Villani et al., 1999). The ancient Greeks played a fundamental role in developing the cultivation of chestnut especially in the Italian Greek colonies and later it was spread throughout the empire by the Romans without no evidence of systematic tree planting (Conedera et al., 2007). The chestnut tree assumed an important role in certain historical periods for the survival of the mountain people of most Mediterranean and southern parts of Central Europe either as a food source or timber production (Conedera et al., 2007). Nowadays it is still mainly dispersed throughout Mediterranean countries and Central Europe as shown in Fig. D-1.
Fig. D-1- Castanea sativa dispersion map (source: EUFORGEN, 2016).
The “golden age” of the chestnut started in the Renaissance period and lasted until the XIX century (Abreu, 2007) but the decline of the traditional European chestnut culture took place in different countries at different times, including Portugal, from common driving factors (Ferreira-Cardoso, 2007) such as: the introduction and spread of the soil-born plant pathogen Phytophthora spp. (ink disease) and the wound-parasite
6
and efficient logistic such as potatoes or maize that allowed a greater production of calories with shorter rotation cycle, causing the progressive substitution of the chestnuts as a staple food; the industrial revolution had changed the social and economical system in rural areas because it led to urban migration with consequent rural depopulation and population aging in rural areas; the inconsequent and systematic cut of chestnut groves for tannin production from the wood without re-plantation of chestnut trees; and finally the forest fires that systematically occur in Portugal that burn the chestnut trees.
The above factors explained the decrease of the chestnut area in Portugal from an estimated 70.000 hectares in the fifties of 20th Century, to 30,048 hectares in 2014 (INE,
2016). The last available data revealed that Portugal had increased its chestnut area up to 35,595 ha and most of it is located in the northern region (31,346 ha) (INE, 2016). This increment in area is attributed to several financial incentives given by National and European programmes but, even so, the mean productivity is far from other chestnut producing countries (Tab. D-1). Portugal has the lowest productivity values (0.7 t ha-1),
with the exception of Alentejo (3 t ha-1). However, these values may be erroneous
because it considers the unproductive new plantations, the unproductive area due to illness and mortality plus the parallel market or auto-consumption that is not contemplated. Many studies refer an average tree production ranging between 40 and 60 kg of chestnut (Martins et al., 2011) which represents a yield of 4 to 6 t ha-1 (with 100
trees ha-1). So, it is acceptable to say that a healthy adult chestnut orchard in Portugal produces more than 4 t ha-1. Nevertheless, during the time of this study (2013 to 2016), the National chestnut production varied from 24,739 t in 2013 to 18,465 t in 2014, being this decay mainly justified by unfavourable climatic conditions and disease development in 2014 (INE, 2015). In 2015, the production was about 27,628 t and in 2016, Portugal produced 26,780 t (INE, 2017) being the third biggest European producer of chestnuts (Tab. D-1). The producer’s price increased from 2013 to 2014 (171.60 € to 212.37 € per 100 kg, respectively) but decreased in 2015 to 149.94 € 100 kg-1 (INE, 2016), increasing again in 2016 (179.09 € 100 kg-1) (INE, 2017). Concerning
exportations, in 2016, Portugal sold 19,783 t of chestnuts which represented about 51 million Euros of gains to the Portuguese economy and merely imported 1,292 t (INE, 2017).
7
Tab. D-1 - Total area (ha), production (t) and calculated yield (t ha-1) of chestnut trees for the main
producing countries and for the Portuguese regions.
Main
countries/region Total Area Total production Calculated yield
China* 305,000 1,650,000 5.4 Republic of Korea* 36,500 70,000 1.9 Turkey* 38,780 59,789 1.5 Italy* 25,000 52,000 2.1 Japan* 21,000 20,900 1.0 Portugal** 35,718 26,780 0.7 North region 31,439 22,136 0.7 Centre region 3,582 2,819 0.8 Lisbon region 5 6 1.2 Alentejo region 522 1,562 3.0 Algarve region 16 15 0.9 Spain* 7,000 10,000 1.4 France* 7,165 8,581 1.2 Greece * 6,900 8700 1.3
* Last available data from FAO, 2012. ** Last available data from INE, 2017.
The Portuguese chestnut production system has some features we can highlight such as:
The chestnut trees are mainly located in mountainous regions that are sparsely inhabited and market isolated populations (Gomes-Laranjo et al., 2016);
The majority of the chestnut trees are seedlings from C. sativa grafted with autochthonous varieties; recently, autochthonous varieties have been grafted on ink resistant rootstock (Ca90; COLUTAD) (Gomes-Laranjo et al., 2016);
Some new plantations use hybrid varieties (usually French developed varieties such as Marigoule or Bouche Betizac) (Gomes-Laranjo et al., 2016);
The majority of the orchards are old and most of them are affected by ink or blight (Gomes-Laranjo et al., 2016);
Traditional tree spacing was usually of 12 x 12 m or 10 x 10 m. Nowadays, when used hybrid rootstocks the space has been adjusted to 9 x 9 m or eventually 8 x 8 m (Gomes-Laranjo et al., 2016);
Soil mobilization is commonly done in spite of warnings about its prejudicial effects (Martins et al. 2010, Raimundo et al. 2007);
8
Very few producers incorporate manure or fertilizers to the soil as well as liming for soil’s pH correction according soil analysis (Gomes-Laranjo et al., 2016);
Sanitary cuttings and initial formation pruning are frequently done (Gomes-Laranjo et al., 2016);
The majority of chestnut trees do not have an irrigation system (Gomes-Laranjo
et al., 2016);
The ink and cancer diseases are still in expansion (Martins et al., 2016);
The Dryocosmus kuriphilus Yasumatsu was installed in Portugal since 2014, being in expansion (DRAPN, 2016);
The high Asiatic chestnut production influences the market price (Bertoncello, 2016);
The chestnut groves are located in regions with dry a hot summers (Gomes-Laranjo et al., 2007).
The 21st century brings new challenges to the world and this is transversal to the
chestnut sector. FAO (2011) describes a few challenges for food security in the 21st
century many of which the chestnut sector must be aware of in order to inspire itself to guide its own future. The primary concerns/challenges exposed by FAO (2011) are related with a) the rapidly growing and urbanizing population which is expected to be of about 9.2 billion people in 2050; b) the availability of quality land and water resources to assure food security based on the intensification of their use but at same time aiming to mitigate the environmental impact; c) the climate change which is manifested in more frequent extreme weather episodes and shifts in seasons that affect food production in many areas of the world and finally d) globalization which is spurred by market liberalization, growth of international trade, increased international financial transactions and capital flows, advances in information and communication technologies and logistics systems.
Meeting the considerations made by Conedera et al. (2007) about the European chestnut tree, the Portuguese chestnut sector must embrace the new opportunities that arise from the changing needs of a society that has moved from being rural to industrial and urban-oriented and whose people are more and more sensitive to the new services and goods related with ecological source of food and environmentally friendly products, especially