w w w . e l s e v i e r . p t / r p s p
Original
article
Type
and
quantity
of
physical
activity
and
screen
based
activities
of
students
from
the
7th
to
the
12th
grades:
Characterization
and
association
Anabela
G.
Silva
a,b,∗,
Alexandra
Queirós
a,c,
Maritza
Neto
d,
Nelson
P.
Rocha
c,eaSchoolofHealthSciences,UniversityofAveiro,Aveiro,Portugal
bCenterforHealthTechnologyandServicesResearch(CINTESIS.UA),Aveiro,Portugal
cInstituteofElectronicsandTelematicsEngineeringofAveiro(IEETA),UniversityofAveiro,Aveiro,Portugal dPrimaryHealthcareCenter,Ílhavo,Portugal
eDepartmentofMedicalSciences,UniversityofAveiro,Aveiro,Portugal
a
r
t
i
c
l
e
i
n
f
o
Articlehistory:
Received14February2016 Accepted19July2016
Availableonline20October2016 Keywords:
Physicalactivity Students Screentime
a
b
s
t
r
a
c
t
Aim:Toexaminetheassociationbetweenself-reportedphysicalactivityandself-reported screenbasedtime.
Materialsandmethods:969highschoolstudentsfilledinaquestionnaireonphysicalactivity andscreenbasedactivities.Correlationanalysisbetweentimespentinmoderate/vigorous physicalactivitiesandtimespentinscreenbasedactivitieswereperformed.
Results:NoassociationwasfoundbetweenphysicalactivityandtimespentwatchingTV, playingorusingcomputers.Alowcorrelationwasfoundbetweentimeusingmobilephones andtimespentperformingmoderatephysicalactivities(r=0.09,p<0.05),andvigorous phys-icalactivities(r=0.13,p<0.05).
Conclusions:Thesefindingssuggestthatscreentimeisnotdisplacingphysicalactivity. ©2016TheAuthors.PublishedbyElsevierEspa ˜na,S.L.U.onbehalfofEscolaNacionalde
Sa ´udeP ´ublica.ThisisanopenaccessarticleundertheCCBY-NC-NDlicense(http:// creativecommons.org/licenses/by-nc-nd/4.0/).
Tipo
e
quantidade
de
atividade
física
e
uso
de
dispositivos
eletrónicos
de
estudantes
do
7.
◦ao
12.
◦ano:
caracterizac¸ão
e
associac¸ão
Palavras-chave: Atividadefísica Estudantes
Dispositivoseletrónicos
r
e
s
u
m
o
Objetivos:Explorara associac¸ãoentreoníveldeatividadefísicaeousode dispositivos eletrónicos.
Materiaisemétodos:Novecentosesessentaenovealunosdosecundáriopreencheramum questionáriosobre atividadefísicae usodedispositivos eletrónicos.Foirealizada uma análisedecorrelac¸ãoentreotempodespendidoematividadefísicamoderadaeintensa eousodedispositivoseletrónicos.
∗ Correspondingauthor.
E-mailaddress:[email protected](A.G.Silva). http://dx.doi.org/10.1016/j.rpsp.2016.07.001
0870-9025/©2016TheAuthors.PublishedbyElsevierEspa ˜na,S.L.U.onbehalfofEscolaNacionaldeSa ´udeP ´ublica.Thisisanopenaccess articleundertheCCBY-NC-NDlicense(http://creativecommons.org/licenses/by-nc-nd/4.0/).
Resultados: Nãohácorrelac¸ãoentreaatividadefísicaevertelevisão,jogarouusar com-putadores.Háumacorrelac¸ãobaixaentreousodetelemóveiseaatividadefísicamoderada (r=0,09,p<0,05)evigorosa(r=0,13,p<0,05).
Conclusões: Estesresultadossugeremqueousodedispositivoseletrónicosnãointerfere comapráticadaatividadefísica.
©2016OsAutores.PublicadoporElsevierEspa ˜na,S.L.U.emnomedeEscolaNacional deSa ´udeP ´ublica.Este ´eumartigoOpenAccesssobumalicenc¸aCCBY-NC-ND(http:// creativecommons.org/licenses/by-nc-nd/4.0/).
Introduction
Theevidenceofthebenefitsofphysicalactivityin maintain-inggoodhealthandfunctionisunquestionable.Forchildren and adolescents in particular, physical activity has been showntobe associatedwithpositivechanges inadiposity, skeletalhealth,psychologicalhealth,improvedself-esteem, fewerdepressivesymptoms1andimprovedcardiorespiratory fitness.2Furthermore,itappearstohavelongterminfluence onpreventing weightgain,obesity, coronaryheart disease, type2diabetesmellitus,Alzheimer’sdiseaseanddementia.3 Despitetheconsensualbenefitsofphysicalactivityacrossthe lifespan, studies haveshown a declinein physicalactivity andanincreaseinsedentarybehaviorsduringadolescence.3,4 Increased sedentary behaviors in adolescence have been associated with time spent using electronic devices such asmobile phones,computers, television (i.e.,screen time), which in turn, has been shown to be related with hyper-activity/inattentionproblems,lesspsychologicalwell-being, less perceived quality of life,5 obesity6 and increasedpain prevalence.7
Thehypothesisthat screentimecould displacephysical activity hasbeen proposed.8 However, theevidence onthe association between increased screen time and decreased physical activity is conflicting. A few studies have found aninverseassociationbetweenphysicalactivityandscreen time,9–11 while others have found no association between these factors.12,13 A recent systematic review identified a negative association between screen time and physical activity/fitness,11whilealongitudinalstudyfoundaninverse but non-substantive association between TV/DVD use and leisure physical activity and no association between com-puter/gameuseandleisurephysicalactivity,14suggestingthat the associationmight dependon the typeofscreen based activity.Furthermore,acrosscountrystudy9suggeststhatthe strengthofthe associationbetweenscreen basedactivities andphysicalactivitydependsongender,country/region,type ofscreen-basedactivityandintensityofphysicalactivity.For example,watchingtelevision,gamingandusingacomputer showeddifferentpatternsofassociationwithphysicalactivity andthestrengthofassociationdependedonwhether vigor-ousphysicalactivityormoderatetovigorousphysicalactivity was considered in the analysis. In addition, the strength and directionof the association variedbetween the South European countries and the Nordic European countries.9 Therefore,moreresearchisneededinPortugalinvestigating thepotentialassociationbetweenscreen timeandphysical activity forstudents, in particular whether an association
betweenthesevariablesmightdependontheintensityand type of physical activity or type of screen based activity. The main aim of this study is to investigate whether an associationexistsbetweenself-reportedphysicalactivityand self-reportedscreenbasedtimewhenconsideringthe inten-sity (moderate or vigorous)and type (e.g. football, skating, cycling)ofthephysicalactivityandthetypeofscreenbased activity(watchingTV/DVD,playing,usingmobilephonesand computers)inasampleofPortuguesestudentsfromthe7th tothe 12thgrades. Secondaryaimsare tocharacterize the typeofphysicalactivitiesandscreenbasedactivitiesinwhich students areinvolvedand timeperweekspentperforming them.
Methods
This study received Ethical approval from the Council of Ethics and Deontology, University of Aveiro. Written con-sent was obtained from the students or from both the students and their parents if students were younger than 16yearsold.
Studydesignandpopulation
ThisstudytookplaceintheCouncilofÍlhavo.ThisCouncil spentapproximately1.002.6eurosintheyearof2012ingames and sports,aninvestmentthatishigherthan theNational average (dataretrieved from http://www.pordata.pt/on the 30th ofMay 2016) andits offer interms ofsports/physical activityincludes:swimming,athletics,handball,basket, foot-ball, martialarts, ballet,tennis, sailing, surf andcanoeing. This Council has5 schools withthe 7th or higher grades. These5schoolshadapproximately 1330studentsfrom the 7thtothe12thgradeatthetimeofdatacollection.Allthese students were invited to participate in the study. A ques-tionnairewasadministeredusinganElectronicDataCapture (uEDCTM)Solutiondevelopedforthisstudy.ThisuEDCTM
solu-tion (uedc.iuz.pt)isanElectronic DataCapturesolutionfor thehealthcarefield,usinganinformationsystemtocollect andprocessclinicaldata,involvingpatients,researchersand healthcare professionals. It enables the setup of a clinical study,inaccordancewithanestablishedprotocoldefinedby thestudypromotor.Duringaphysicaleducationlessoneach studentwasgivenanindividualpasswordandloginandasked tocompletetheonlinequestionnaire.Studentsnotatschool onthedayofdatacollectionwereinvitedtoparticipateon another day. Data were collected betweenMarch and June 2014.
Measures
Demographicdata
Studentswereaskedtoenterdataonsex,ageandschoolyear.
Physicalactivity
Studentswereaskedwhether:(1)theyparticipatedregularly inthephysicaleducationclasses;(2)theyparticipatedin mod-erate physicalactivities other than the physical education classes;andwhether(3)theyparticipatedinvigorous physi-calactivitiesotherthanthephysicaleducationclasses.Those reportingtoparticipateinmoderateorvigorousphysical activ-ityhadtoanswerthreeadditionalquestionsrelatedto:type ofactivity,number ofdaysperweek(1–7)and mean dura-tion ofeach activity per session (minimum10min).These questions were adaptedfrom Lang.15 Responseoptions for the moderate physicalactivities question were: walking to school,walkingingeneral(otherthantoschool),cycling, skat-ing,rollerskating,others.Responseoptionsforthevigorous physicalactivitiesquestionwere:handball,running,martial arts,basket,ballet,football,gymnastics,rowing,swimming, volleyball or other. These lists of activities were based in published guidelines.16–18 Moderate and vigorous physical activitiesweredescribedintermsofnumberofactivities,type ofactivitiesandmeandurationofactivitiesperweek.Total timeofmoderateandvigorousphysicalactivityperweekwas computedmultiplyingthedailyamountoftimespentineach activitybyitsweeklyfrequency(i.e.numberofdaysperweek) andthenaddingtheindividualtimeperweekforall activi-tiesreportedbythesameparticipant.Totaltimeofmoderate andvigorousphysicalactivitywasusedtocalculatethe num-berandpercentageofparticipantsreportingatleast420min ofactivity per weekasrecommendin international guide-linesofphysicalactivityforhealthofthoseaged5–17years old(atleast60minofmoderatetovigorousphysicalactivity daily).19
Screenbasedactivities
Screenbasedactivitieswereassessedwith4closedquestions adaptedfromHakalaetal.,20Studentswereaskedtoreport onthenumberofhoursthattheytypicallyspenteachday: (1) WatchingTV/DVDs:usingTVsandDVDstowatchTV
pro-gramsandvideos;
(2) Playing:usingcomputers,TVorPlayStationtoplaywired orstandalonegames;
(3) Usingmobilephones:usingmobilephonesto communi-cateorplay;
(4) Using computers: using desktopor portable computers and tabletsforcommunicatingand managing informa-tion.
Responseoptionsforeachquestionwere:(1)donotuse;(2) use1horlessperday;(3)use2–3hperday;(4)use4–5hper day;and(5)morethan5hperday.Hakalaetal.,20assessed test-retestreliabilityofthesequestionsusingaKcoefficient andreportedKvaluesbetween0.45and0.65indicatingafair togoodagreementbeyondchance.
Dataanalysis
ThePredictiveAnalyticsSoftwareversion22(PAWSsoftware) (IBM,NewYork)wasusedforstatisticalanalysis.Descriptive statisticswereusedtocharacterizethesampleintermsofage, sex,yearsofformaleducation,physicalactivityand screen time.Meanandstandarddeviation(SD)werereportedfor con-tinuousvariablesandcountandproportionwerereportedfor categoricalvariables.AChi-squaretestwasusedto investi-gate differencesin thedistribution ofboysand girls for(i) attendanceofphysicalactivity classes,(ii)compliancewith international guidelines for physical activity, (iii) type and intensityofphysicalactivityand(iv)timespent(ordinal vari-able)ineachofthefourscreenbasedactivities.Differences betweenboysandgirlsfornumberofphysicalactivitiesand time spentinmoderate andvigorous activitieswere inves-tigatedusinganindependentsamplet-test.Thecorrelation betweentimeperweekspentinphysicalactivityandscreen time was investigated using the Spearman rho correlation coefficientandthestrengthofthecorrelationwasinterpreted aslowifthecoefficientwas<0.3,moderateifitwasbetween 0.3and0.5,andstrongifitwas>0.5.21 Levelofsignificance wassetatp<0.05.
Results
Atotalof969(72.9%)studentsoutofthetotalnumberof stu-dents(n=1330)answeredtheonlinequestionnaire.Ofthese, 502(51.8%)weregirlsand467(48.2%)wereboysranginginage from13to21yearsold(mean±SD=15.6±1.8years).
Physicalactivity
Ofthe969respondents,939(97.0%)reportedtoregularly par-ticipate inthe physical education classes against29 (3.0%) whoreportednottoparticipateintheseclasses(oneresponse missing). Moregirlsthan boysmissthe physicaleducation classes( 2(1)=9.01,p=0.002).
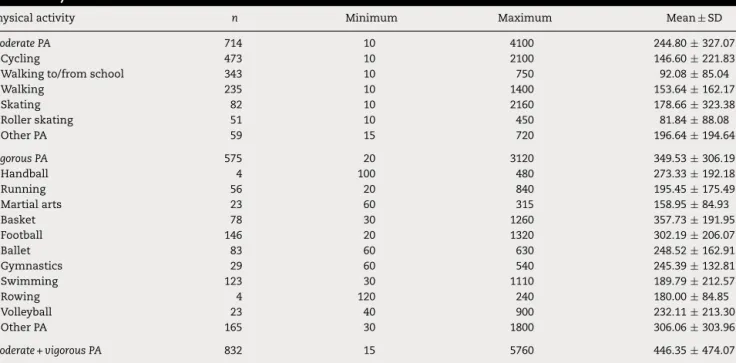
Regardingmoderatephysicalactivity,714(73.7%) respon-dentsreportedtobeinvolvedinatleastonemoderatephysical activity.Fromthese714students,18(2.5%)didnotreporton theactivity(ies)performed.Oftheremaining696respondents, 304 (43.7%)reported oneactivity only,265 (38.1%)reported 2activities,104(14.9%)reported3activities,20(2.9%)reported 4 activities, 1 (0.01%) reported 5 activities and 2 (0.03%) reported6activities.Themeannumberofmoderateactivities per student was significantly higher for girls (mean±SD= 1.49±1.17) compared to boys (mean±SD=1.23±0.97; p=0.003).Theactivitiesmostreportedwerecycling(n=473, 66.2%) and walking to/from school (n=343, 48.0%). When consideringthedistributionofboysandgirlsperactivity,it was found that more boysthan girls reported cycling and skating and more girls than boys reported roller skating, walking to/from school and walking in general (Table 1). Nevertheless, whenconsideringtotaltimespentin moder-ate physicalactivities, no differences were found between boys and girls (boys: mean±SD=267.94±406.15; girls: mean±SD=211.99±225.22, p=0.25). Table 2 presents total timeperweekspentinmoderatephysicalactivityaswellas totaltimepertypeofactivityforthetotalsample.
Table1–Typeofphysicalactivityfortheoverallsampleandcomparisonbetweenboysandgirls.
Physicalactivity Number(%) Chi-square
Allrespondents(n=968a) Girls(n=501;51.8%) Boys(n=467,48.2%)
Yes No Yes No Yes No
Physicalactivityclasses 939(97.0) 29(3.0) 478(95.4) 23(4.6) 461(98.7) 6(1.3) 2(1)=9.01,p=0.002 ModeratePAb 714(73.7) 254(26.3) 374(74.7) 127(25.3) 340(72.8) 127(27.2) 2(1)=0.43,p=0.559
Cycling 473(66.2) 215(57.5) 258(75.9) 2(1)=26.95,p<0.001
Rollerskating 51(7.1) 37(9.9) 14(4.1) 2(1)=8.96,p=0.003
Skating 82(11.5) 33(8.8) 49(14.4) 2(1)=5.47,p=0.025
Walkingto/fromschool 343(48.0) 213(56.9) 130(38.2) 2(1)=24.99,p<0.001
Walking 235(32.9) 173(46.3) 62(18.2) 2(1)=63.63,p<0.001
Other 59(8.3) 28(7.5) 31(9.1) 2(1)=0.63,p=0.497
Didnotreport 18(2.5)
VigorousPAb 575b(59.4) 393(40.6) 253(50.5) 248(49.5) 322(69.0) 145(31.0) 2(1)=34.12,p<0.001 Handball 4(0.7) 2(0.8) 2(0.6) 2(1)=1.33,p=0.515 Running 56(9.7) 30(11.9) 26(8.1) 2(1)=2.31,p=0.156 Martialarts 23(4.0) 6(2.4) 17(5.3) 2(1)=3.12,p=0.089 Basket 78(13.6) 25(9.9) 53(16.5) 2(1)=5.23,p=0.027 Ballet 83(14.4) 80(31.6) 3(0.9) 2(1)=108.04,p<0.001 Football 146(25.4) 16(6.3) 130(40.4) 2(1)=86.70,p<0.001 Gymnastics 29(5.0) 23(9.1) 6(1.8) 2(1)=15.45,p<0.001 Rowing 4(0.7) 1(0.4) 3(0.9) 2(1)=0.59,p=0.634 Swimming 123(21.4) 65(25.7) 58(18.0) 2(1)=4.97,p=0.031 Volleyball 23(4.0) 21(8.3) 2(0.6) 2(1)=21.76,p<0.001 Other 165(28.7) 55(21.7) 110(34.2) 2(1)=10.69,p=0.001
Didnotreport 6(1.0)
PA–physicalactivity.
a Datamissingfromoneparticipant.
b Percentagesadduptomorethan100%asrespondentscouldreportonmorethanonemoderateandvigorousPA.
Table2–Totaltimespentineachtypeofphysicalactivityandinmoderateandvigorousphysicalactivitiesperweek (inminutes).
Physicalactivity n Minimum Maximum Mean±SD
ModeratePA 714 10 4100 244.80±327.07
Cycling 473 10 2100 146.60±221.83
Walkingto/fromschool 343 10 750 92.08±85.04
Walking 235 10 1400 153.64±162.17 Skating 82 10 2160 178.66±323.38 Rollerskating 51 10 450 81.84±88.08 OtherPA 59 15 720 196.64±194.64 VigorousPA 575 20 3120 349.53±306.19 Handball 4 100 480 273.33±192.18 Running 56 20 840 195.45±175.49 Martialarts 23 60 315 158.95±84.93 Basket 78 30 1260 357.73±191.95 Football 146 20 1320 302.19±206.07 Ballet 83 60 630 248.52±162.91 Gymnastics 29 60 540 245.39±132.81 Swimming 123 30 1110 189.79±212.57 Rowing 4 120 240 180.00±84.85 Volleyball 23 40 900 232.11±213.30 OtherPA 165 30 1800 306.06±303.96 Moderate+vigorousPA 832 15 5760 446.35±474.07 PA–physicalactivity.
Regardingvigorousphysicalactivities,atotalof575(59.4%) respondents reported to participate in these activities. Of the 575 participants, 6 (1.0%) participants did not specify theactivity inwhichtheywere involved. Ofthe remaining 569 participants, 438 (77.0%) reported one vigorous activ-ity, 103 (18.1%) reported 2 activities, 24 (4.2%) reported 3 activities, 2 (0.04%) reported 4 activities and another 2 (0.04%) reported 5 activities. The activities most reported were football(n=146, 25.4%)and swimming(n=123,21.4%) and a high number of participants signaled the response option “Other physical activities” (165, 28.7%). Despite the fact that more boys than girls reported to partici-pate in vigorous physical activities ( 2(1)=34.12, p<0.001),
no significant differences were found in the mean num-ber of vigorous activities per student between genders (boys: mean±SD=1.28±0.57; girls: mean±SD=1.30±0.62; p=0.34). When considering the distribution of boys and girls per activity, more boys than girls reported playing basket,football and other activities, whilemore girls than boysreported ballet, gymnastics, swimming and volleyball (Table1).Inaddition,boysspentmoretimeinvigorous phys-ical activities than girls (boys: mean±SD=381.06±317.45; girls:mean±SD=309.41±286.87,p=0.005).Table2presents totaltimeperweekspentinvigorousphysicalactivityaswell astimepertypeofactivityforthetotalsample.
Atotal of325 (35.3%)participants (from 832valid data) reportedat least420min ofmoderate tovigorous physical activityperweek.Boyswere morelikelythan girlstoreach atleast420minofphysicalactivity( 2(1)=30.94,p<0.001).
Atotalof128outof969(13.2%)respondentsdidnotreport performingmoderateorvigorousphysicalactivity(inaddition tophysicaleducationclasses).
Screenbasedactivities
Results concerning the use of electronic devices are pre-sented inTable3.Thepercentageofparticipantsreporting nottoperformscreen basedactivitiesvariedbetween5.4% whoreportednotwatchingTV,and11.7%whoreportednot using mobile phones. Aconsiderable percentage of partic-ipants report to spend 4h or more watching TV (11.0%), playing(20.6%),usingmobilephones(30.2%)andusing com-puters(19.6%).Boystend tospendmoretime playingthan girls ( 2(4)=46.6; p<0.001), while girls tend to use mobile
phonesmorethan boys( 2(4)=45.7,p<0.001). Respondents
whoreportedtospendmoretimeinonescreenbasedactivity tendtoalsospendmoretimeintheotherscreenbased activ-ities(Table4).Allbut5respondentsreportednottoperform anyofthefourscreenbasedactivitiesenquired.
Associationbetweenphysicalactivityandscreenbased
activities
Nosignificantdifferenceswerefoundbetweenthosereporting moderate or vigorous physical activity and those repor-ting no moderate or vigorous physical activity in terms oftime spentofwatching TV( 2(4)=4.85, p=0.77), playing
( 2(4)=5.83,p=0.67),usingmobilephones( 2(4)=7.76,p=0.46)
orusingcomputers( 2(4)=12.05, p=0.15). Whencorrelating
the amount of time spent in both moderate and vigorous T
able 3 – Dail y use of electr onic de vices (n = 962 a). Acti vity Do not use ≤ 1 h per da y 2/3 h per da y 4/5 h per da y >5 h per da y Chi-squar e All Girls Bo ys All Girls Bo ys All Girls Bo ys All Girls Bo ys All Girls Bo ys W atc hing TV 52 (5.4) 27 (5.4) 25 (5.4) 404 (41.7) 213 (42.4) 191 (41.3) 399 (41.2) 213 (42.4) 186 (40.3) 72 (7.4) 32 (6.4) 40 (8.7) 35 (3.6) 15 (3.0) 20 (4.3) 2(4) = 3.2 p = 0.52 Pla ying 105 (10.8) 75 (15.0) 30 (6.5) 345 (35.6) 205 (41.0) 140 (30.3) 313 (32.3) 143 (28.6) 170 (36.8) 116 (12.0) 45 (9.0) 71 (15.4) 83 (8.6) 32 (6.4) 51 (11.0) 2(4) = 46.6 p < 0.001 Using mobile phones 113 (11.7) 34 (6.8) 79 (17.1) 361 (37.3) 169 (33.8) 192 (41.6) 195 (20.1) 107 (21.4) 88 (19.0) 105 (10.8) 67 (13.4) 38 (8.2) 188 (19.4) 123 (24.6) 65 (14.1) 2(4) = 45.7 p < 0.001 Using computers 86 (8.9) 37 (7.4) 49 (10.6) 375 (38.7) 193 (38.6) 182 (39.4) 311 (32.1) 168 (33.6) 143 (31.0) 95 (9.8) 50 (10.0) 45 (9.7) 95 (9.8) 52 (10.4) 43 (9.3) 2(4) = 3.6 p = 0.46 a Data missing fr om 7 participants.
Table4–Correlationbetweendailyuseofdifferent electronicdevices.
Activity Playing Usingmobile
phones
Using computers
WatchingTV 0.29** 0.17** 0.27**
Playing 0.16** 0.41**
Usingmobilephones 0.41**
∗∗ p<0.01.
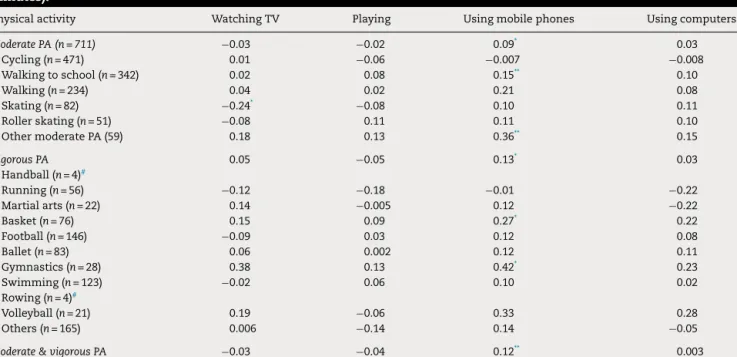
physicalactivity and theuse ofelectronic devices,asmall butsignificantpositivecorrelationwasfoundbetweenmobile phones and total timespent in moderate physicalactivity (r=0.09,p<0.05),totaltimespentinvigorousphysicalactivity (r=0.13, p<0.05), total time spent in moderate and vigor-ous physicalactivity (r=0.12, p<0.01), time spent in other moderatephysicalactivities(r=0.36,p<0.01),walkingto/from school(r=0.15,p<0.01),basket(r=0.27,p<0.01)and gymnas-tics(r=0.42,p<0.05)(Table5),suggestingthatanincreasein thetimespentinthesephysicalactivitiesisassociatedwith increaseduseofmobilephones.Asignificantnegative associ-ationwasfoundbetweenskatingandwatchingTV/videosor DVDs.
Wheninvestigatingdifferencesinthetimespentinscreen basedactivitiesbetweenthoseperformingatleast420minof moderatetovigorousphysicalactivitiesandthose perform-inglessthan240min,asignificantdifferencewasfoundonly formobile phones ( 2(4)=13.06, p=0.01), with those
repor-tinglessphysicalactivityalsoreportinglowermobilephone usage.
Discussion
Ourstudyresultssuggestalackofassociationbetween watch-ing TV, playing and using computers and time spent in moderateorvigorousphysicalactivity.Thislackof associa-tion was presentwhen examiningtheassociation forboth totaltimespentinphysicalactivityandtimespentin indi-vidualmodalitiesofphysicalactivity,withtheexceptionofa lownegativeassociationbetweenskatingand watchingTV. In contrast, a low but significant positive association was foundbetweenmobilephonesusageandtimespentwalking to/fromschoolandingymnasticsandalsobetweenmobile phones usageand totaltime spentinmoderate and vigor-ousphysicalactivity,suggestingthatanincreaseinphysical activity is associatedwithagreater useof mobilephones. Studiesinvestigatingtheassociationbetweenphysical activ-ityandscreenbasedactivitiesreportconflictingresults.Ina 4yearslongitudinalstudyinvolving10856USstudentsaged 10–15yearsold,noassociationwasfoundbetweenchanges intelevisionviewing,orsedentarybehaviorsingeneral,and changesinleisure-timemoderate/vigorousphysicalactivity.12 Incontrast,another2yearslongitudinalstudy10that exam-inedtherelationshipbetweenchangesintimespentwatching TVandplaying,andfrequencyofleisure-timephysical activ-ityfor4594USstudentsfoundthatadecreaseintimespent watching TVwasassociatedwithanincreaseinfrequency ofleisure-timephysicalactivity.Nevertheless,thecorrelation coefficientsbetweenphysicalactivityandwatchingTVwere smallandvariedbetween−0.11and−0.21.Theseresultsare inlinewiththesignificantnegativeassociationfoundinthe
Table5–Correlationbetweenuseofelectronicdevicesandtimespentinmoderateandvigorousphysicalactivities(in minutes).
Physicalactivity WatchingTV Playing Usingmobilephones Usingcomputers
ModeratePA(n=711) −0.03 −0.02 0.09* 0.03 Cycling(n=471) 0.01 −0.06 −0.007 −0.008 Walkingtoschool(n=342) 0.02 0.08 0.15** 0.10 Walking(n=234) 0.04 0.02 0.21 0.08 Skating(n=82) −0.24* −0.08 0.10 0.11 Rollerskating(n=51) −0.08 0.11 0.11 0.10 OthermoderatePA(59) 0.18 0.13 0.36** 0.15 VigorousPA 0.05 −0.05 0.13* 0.03 Handball(n=4)# Running(n=56) −0.12 −0.18 −0.01 −0.22 Martialarts(n=22) 0.14 −0.005 0.12 −0.22 Basket(n=76) 0.15 0.09 0.27* 0.22 Football(n=146) −0.09 0.03 0.12 0.08 Ballet(n=83) 0.06 0.002 0.12 0.11 Gymnastics(n=28) 0.38 0.13 0.42* 0.23 Swimming(n=123) −0.02 0.06 0.10 0.02 Rowing(n=4)# Volleyball(n=21) 0.19 −0.06 0.33 0.28 Others(n=165) 0.006 −0.14 0.14 −0.05
Moderate&vigorousPA −0.03 −0.04 0.12** 0.003
PA–physicalactivity.
∗ p<0.05. ∗∗ p<0.01.
presentstudybetweentimespentwatchingTVandtimespent skating. Across-sectional study including 200615students aged11–15yearsold from 39 differentcountries inEurope and NorthAmerica found thatthe presence/absence ofan associationbetweenphysicalactivityandscreentimeandthe strengthoftheassociation(whenfound)variedacrosstype ofscreen basedactivity and country.9 Therewere stronger negative associations between screen-based activities and physicalactivitiesinNorthAmericaandtheNordicEuropean countriesandpositiveornon-significantassociationsforEast andSouthern Europeancountries.Portugal wasnotamong the participating countries. Nevertheless, our study results areinlinewiththefindingsofMelkevicetal.,9fortheSouth EuropeanCountriesandaddtotheirclaimthatstrategiesto decreasesedentarybehaviorsandincreasephysicalactivity needtoconsidereachcountry/regionspecificities.
Inwhatconcernstimespentinmoderatephysical activi-ties,ourfindingsaresimilartotheestimatesofaNorwegian study including 908 children age 11–13 years old, which reportedameantimeofweeklyphysicalactivityof approxi-mately358min.14Inwhatconcernsvigorousphysicalactivity, thecrossnationsstudy ofMelkenik9 includingcountriesof the SouthEuropefoundthat adolescents aged11–15years oldspentapproximately124minperweekinvigorous physi-calactivity.Differencesintheageofrespondentsareunlikely tocontributetothedistinctresultsastimespentinphysical activitydecreaseswithage.22However,differencesinthetime periodofphysicalactivityconsideredfordatacollectionmay, atleastpartially,explainthehighermeantimespentin vig-orousphysicalactivitiesfoundinthepresentstudy.Whilein thepresentstudyallactivitiesperformedinboutsof10minor morewereincluded,inthestudyofMelkevik,9onlyactivities totalizingatleast60minwereconsidered.Furthermore,the extremelyhighstandarddeviationsfoundinthepresentstudy highlightthewidevariabilityoftypespentinphysical activ-ityamongstudents.Thefindingthatboysspendmoretimein vigorousphysicalactivitieswhencomparedtogirlsisinline withthefindingsofMelkeviketal.,9Nevertheless,Melkevik etal.,9reportedthatonly11%ofgirlsand21%ofboysmeet theinternationalguidelinesofatleast60minofmoderateto vigorousphysicalactivitydaily,19whileinthepresentstudy thisvalueishigherandreachesapproximately35%.
Aconsiderablepercentageofparticipantsreporttospend 4h or more watching TV (11.0%), playing (20.6%), using mobilephones(30.2%)andusingcomputers(19.6%).A system-aticreview23analyzingdatafrom 539independentsamples reportedthatapproximately28%ofyoungpeoplespendmore than4hdailywatchingTVand18% reportedplayingmore than4hperday.Inlinewiththepresentstudyfindings,boys weremorelikelytoreporthigherlevelsofplayingwhen com-paredtogirls(30%vs.7%,p<0.05),butcontrarytoourstudy findings,boysweresignificantlymorelikelytobehighusers ofTVcomparedtogirls.
Melkeviketal.,9reportedthatinSouthEuropeancountries, 43%(95%CI=41.49–42.82%)ofstudentsspendmorethan2h dailywatchingTV,17%(95%CI=15.81–16.79)spendmorethan 2hdailyplayingand15%(95%CI=14.91–15.94)spendmore than 2h dailyusing computers. Theseestimates are lower than those foundin the present study wherethe percent-age ofstudents reporting2 ormore hoursin thedifferent
screen-basedactivitiesvariedbetween50.3%and52.9%. Nev-ertheless,astudyin7725Canadianstudentsaged13–17years old,24reportedthat74%ofboysand59%ofgirlsspentmore than 2hdaily inscreen-based activities. Thesecontrasting resultsmaysuggestthatestimatesofdailyscreentimemay varyacrosscountries/regions,butmayalsobeassociatedwith theconstant evolutionofelectronicdeviceswhichdiversity and availabilitytothegeneralpopulationincreasesrapidly. Similarly,inthepresentstudythepercentageofparticipants reportingnotwatchingTV,playing,usingmobilephonesor computersvariedbetween5.4%and11.7%,whichare lower thanthosereportedbyMelkeviketal.,25inacross-national surveyfrom30differentcountries,includingPortugal.These authorsfoundthat23%ofgirlsand19%ofboysreportedno electronicdevicesusage,butindividualcountryestimatesare notpresented.
Takentogetherwebelievethatthisstudyresultsinformon thephysicalactivitiesandscreenbasedactivitiesinwhich stu-dentsareinvolvedaswellasonthetimetheyspendonthem. Itshowsthatanimportantpercentageofstudentsmaynotbe performingtherecommendeddailydoseofphysicalactivity, highlightingtheneedtocontinuethepromotionofphysical activityamongstudents.Furthermore,itaddstotheexisting studiesthatsuggestthatscreenbasedactivitiesarenot dis-placingphysicalactivityandthatinterventionstargetingeach ofthesefactors(i.e.aimingatincreasingphysicalactivityand decreasingscreenbasedtime)mayneedtopursuedifferent strategies.
Study
limitations
Onelimitationofthisstudyisthatwereliedonself-reported measuresforbothphysicalactivityand screentime,which couldhaveinfluencedtheresultsastheytendtobeless accu-ratethanobjectivemeasures.Furthermore,ourstudyincludes participantsfromaspecificregionofPortugaland,therefore, thegeneralizabilitytothewholecountrymaybelimited. Fac-torssuchasthefamilysocioeconomicstatus,thatseemstobe associatedwithbothphysicalactivityandscreenbasedtime andvaryacrosscountriesandregions,26werenotincludedin thepresentstudyandshouldbeconsideredinfuturestudies. Inaddition,itwouldhavebeeninterestingtostudythe asso-ciationbetweenphysicalactivityandthetotaltimespentin screenbasedactivitiestounderstandhowitcomparestothe individualassociationbetweenphysicalactivityandthetime spentineachofthefourscreenbasedactivitiesconsideredin thepresentstudy.Nevertheless,thiswasnotpossibledueto theordinalnatureofthisvariable.
Conclusion
Thisstudyfoundnoassociationbetweenplayingandusing computers and physical activity,neither whenconsidering typeofphysicalactivitynorwhen consideringoverall time spentinphysicalactivity.Anegativeassociationwasfound betweenwatchingTVandskatingandapositiveassociation was foundbetweenmobile phonesuse and physical activ-ity.Thesefindingssuggestthatscreentimeisnotdisplacing physicalactivityandthatinterventionsaimingtopromotethe
increaseofphysicalactivityandthedecreaseofscreentime mayneedtoaddressdifferentfactors.Furtherstudies,both quantitativeandqualitative,areneededtoconfirmandhelp understandthepositiveassociationbetweenmobileuseand physicalactivity.
Conflicts
of
interest
Theauthorshavenoconflictsofinteresttodeclare.
Acknowledgments
Authorswouldliketothankallstudentsthatparticipatedin thestudy,theDirectionofAgrupamentodeEscolasdeÍlhavo, thePhysicalEducationteachersandDr.aFernandaLoureiro
fromtheCentrodeSaúdedeÍlhavo.
r
e
f
e
r
e
n
c
e
s
1. EimeR,YoungJ,HarveyJ,CharityM,PayneW.Asystematic reviewofthepsychologicalandsocialbenefitsof
participationinsportforchildrenandadolescents:Informing developmentofaconceptualmodelofhealththroughsport. IntJBehavNutrPhysAct.2013;15:1–21.
2. LoprinziP,CardinalB,LoprinziK,LeeH.Benefitsand environmentaldeterminantsofphysicalactivityinchildren andadolescents.ObesFacts.2012;5:597–610.
3. ReinerM,NiermannC,JekaucD,WollA.Long-termhealth benefitsofphysicalactivity:Asystematicreviewof longitudinalstudies.BMCPublicHealth.2013;8:13. 4. NelsonM,Neumark-StzainerD,HannanP,SirardJ,StoryM.
Longitudinalandseculartrendsinphysicalactivity andsedentarybehaviorduringadolescence.Pediatrics. 2006;118:1627–34.
5. SuchertV,HanewinkelR,IsenseeB.Sedentarybehaviorand indicatorsofmentalhealthinschool-agedchildrenand adolescents:Asystematicreview.PrevMed.2015;76:48–57. 6. MarshS,NiMhurchuC,MaddisonR.Thenon-advertising
effectsofscreen-basedsedentaryactivitiesonacuteeating behavioursinchildren,adolescents,andyoungadults: Asystematicreview.Appetite.2013;71:259–73.
7. HarrisC,StrakerL,PollockC,SmithA.Children,computer exposureandmusculoskeletaloutcomes:Thedevelopment ofpathwaymodelsforschoolandhomecomputer-related musculoskeletaloutcomes.Ergonomics.2015;58:1611–23. 8. RobinsonT.Televisionviewingandchildhoodobesity.Pediatr
ClinNorthAm.2001;48:1017–25.
9. MelkevikO,TorsheimT,IannottiRJ,WoldB.Isspendingtime inscreen-basedsedentarybehaviorsassociatedwithless physicalactivity:Acrossnationalinvestigation.IntJBehav NutrPhysAct.2010;7:46.
10.MotlRW,McAuleyE,BirnbaumAS,LytleL.Naturally occurringchangesintimespentwatchingtelevisionare inverselyrelatedtofrequencyofphysicalactivityduringearly adolescence.JAdolesc.2006;29:19–32.
11.CostiganS,BarnettL,PlotnikoffR,LubansD.Thehealth indicatorsassociatedwithscreen-basedsedentarybehavior amongadolescentgirls:Asystematicreview.JAdolesc Health.2013;52:382–92.
12.TaverasE,FieldA,BerkeyC,Rifas-ShimanSL,FrazierAL, ColditzGA,etal.Longitudinalrelationshipbetweentelevision viewingandleisure-timephysicalactivityduring
adolescence.Pediatrics.2013;18:1199–216.
13.vanderSluisME,LienN,TwiskJWR,SteenhuisIH,BereE, KleppKI,etal.Longitudinalassociationsofenergy
balance-relatedbehavioursandcross-sectionalassociations ofclustersandbodymassindexinNorwegianadolescents. PublicHealthNutr.2010;13:1716–21.
14.GebremariamMK,BerghIH,AndersenLF,OmmundsenY, TotlandTH,BjellandM,etal.Arescreen-basedsedentary behaviorslongitudinallyassociatedwithdietarybehaviors andleisure-timephysicalactivityinthetransitioninto adolescence?IntJBehavNutrPhysAct.2013;10: 9.
15.LangC,BrandS,FeldmethAK,Holsboer-TrachslerE,PühseU, GerberM.Increasedself-reportedandobjectivelyassessed physicalactivitypredictsleepqualityamongadolescents. PhysiolBehav.2013;120C:46–53.
16.USDepartmentofHealth&HumanServices.Centersfor DiseaseControlandPrevention.Aerobic,muscleand bone-strengthening:Whatcounts?Atlanta,GA:Division ofNutrition,PhysicalActivity,andObesity.NationalCenter forChronicDiseasePreventionandHealthPromotion;2014. 17.AinsworthB,HaskellW,HerrmannS,MeckesN,BassettDRJr,
Tudor-LockeC,etal.2011compendiumofphysicalactivities. MedSciSportExerc.2011;43:1575–81.
18.AinsworthBE,HaskellWL,WhittMC,IrwinML,SwartzAM, StrathSJ,etal.Compendiumofphysicalactivities:Anupdate ofactivitycodesandMETintensities.MedSciSportsExerc. 2000;32:S498–504.
19.ProchaskaJ,SallisJ,LongB.Aphysicalactivityscreening measureforusewithadolescentsinprimarycare.Arch PediatrAdolescMed.2001;155:554–9.
20.HakalaPT,RimpeläAH,SaarniL,SalminenJJ.Frequent computer-relatedactivitiesincreasetheriskofneck-shoulder andlowbackpaininadolescents.EurJPublicHealth. 2006;16:536–41.
21.CohenJ.Statisticalpoweranalysisforthebehavioral sciences.2nded.Hillsdale:LawrenceErlbaum;1998. 22.ButtJ,WeinbergR,BreckonJ,ClaytorR.Adolescentphysical
activityparticipationandmotivationaldeterminantsacross gender,age,andrace.JPhysActHealth.2011;8:1074–83. 23.MarshallSJ,GorelyT,BiddleSJH.Adescriptiveepidemiology
ofscreen-basedmediauseinyouth:Areviewandcritique. JAdolesc.2006;29:333–49.
24.HermanKM,HopmanWM,SabistonCM.Physicalactivity, screentimeandself-ratedhealthandmentalhealthin Canadianadolescents.PrevMed.2015;73C:112–6. 25.MelkevikO,HaugE,RasmussenM,FismenAS,WoldB,
BorraccinoA,etal.Areassociationsbetweenelectronic mediauseandBMIdifferentacrosslevelsofphysicalactivity? BMCPublicHealth.2015;15:497.
26.SherarL,GriffinT,EkelundU,CooperAR,EsligerDW,van SluijsEMF,etal.Associationbetweenmaternaleducationand objectivelymeasuredphysicalactivityandsedentarytimein adolescents.JEpidemiolCommunityHealth.2016;70:541–8.