Keywords
Highlights
Abstract
Graphical abstract
308Research Paper
Received 2017-03-11 Revised 2017-05-02 Accepted 2017-05-30 Available online 2017-05-30Reverse osmosis (RO) Grape must Alcohol content
• Grape must was concentrated by RO, during 55 minutes, from 23.7 ºBx to 28.5 ºBx. • The average permeate flux was 2.12 L.m-2h-1.
• The must reconstitution was carried out to obtain fermented beverages with an alcohol volume content of 5%, 7%, 10% and 13% (v/v).
• Beverages with low alcohol content had a lower content of polyphenols compounds which influenced the sensory evaluation.
Journal of Membrane Science and Research 3 (2017) 308-312
Membrane Processing of Grape Must for Control of the Alcohol Content in Fermented
Beverages
1 Departamento de Tecnologia Alimentar, Biotecnologia e Nutrição, Instituto Politécnico de Santarém, Escola Superior Agrária, 2001-904 Santarém, Portugal 2 Departamento de Engenharia Química. Instituto Superior Técnico. Universidade de Lisboa. 1049-001 Lisboa. Portugal
Helena Mira
1,*, António Guiomar
1, Vitor Geraldes
2, Maria Norberta de Pinho
2Article info
© 2017 MPRL. All rights reserved.
* Corresponding author at: Phone: +351-243307300; fax: +351-243307301 E-mail address: [email protected] (H. Mira)
DOI: 10.22079/JMSR.2017.60634.1130
1. Introduction
The increase in the concentration of sugar in grapes and grape musts is often associated with climate change [1]. The decreasing alcohol consumption is a worldwide trend and lower consumption rates are
associated with positive health benefits. This fact presents a great challenge in the production of fermented beverages with controlled content of alcohol, using sustainable practices.
Journal of Membrane Science & Research
journal homepage: www.msrjournal.comThe great demand of beverages, both alcohol-free and with low alcohol content, is a great challenge for the production of beverages with controlled alcohol content through the use of sustainable enological practices. The present work addresses this challenge with the processing of grape must by reverse osmosis (RO) for must reconstitution with different sugar contents prior to the alcoholic fermentation. The original must came from grapes grown in Quinta do Quinto, in Santarém, collected after destemming and mechanic crushing, and preserved in a refrigerated chamber at -1.6 °C until processing by RO. The RO processing was carried out in Escola Superior Agrária de Santarém, with a pilot plant equipped with RO spiral wound modules, M38RO, from Alfa Laval, Denmark. The total membrane permeation area is 15 m2. The work pressure was 55 bar. The original must had 23.7 oBrix, a density
of 1108 g.L-1, 15.2% (v/v) of probable alcohol, and a conductivity of 2.01 mS.cm-1. The must reconstitution was carried out, by mixing the concentrated grape must with the vegetal
water produced by RO (permeate) to obtain beverages with a nominal alcohol content of 5%, 7%, 10% and 13% (v/v). The fermentation average temperature was between 18.2 and 19.7 °C, and the final density rounded about 993 g.cm-3. The beverages were analysed by different parameters, including total polyphenols, total anthocyanins, colour intensity and
hue, the coordinates CIELab, alcohol content, total acidity, volatile acidity, pH, free SO2 and total SO2. The attributes of the beverage, corresponding to the visual appearance, aroma
and taste senses, as well as the overall judgment were evaluated by the tasters. The proposed method can produce beverages with controlled low alcohol content. The decrease of the alcohol content led to lower content of polyphenols compounds which influenced the sensory evaluation.
For removing ethanol from beverages, heat or membrane-based processes can be employed. A summary of the main technologies utilised to reduce alcohol levels in beverage is presented in the literature [2, 3]. The traditional methods of dealcoholisation such as distillation [4], vacuum distillation [5]
and spinning cone column [6, 7] are mainly based on phase change, which may affect the aroma compounds. These techniques are giving place to alternative membrane processes, namely evaporative perstraction [8-14], pervaporation [15, 16], reverse osmosis (RO) and nanofiltration (NF) [17-28]. Innovative membrane based processes can follow a different approach of reduction of sugar in grape musts prior to alcoholic fermentation. As far as reduction of sugar in grape musts, the literature describes different processes combining UF/NF [20, 29-31], NF/NF [32, 33] and NF/RO [34] and Memstar process, which comprises NF units and a membrane contactor (Liquid-Cel®) [22, 35].
Some studies [2, 36-38] investigated the importance of partial dealcoholisation by membrane processes on beverage phenolic compounds, chromatic characteristics, volatile composition and sensory attributes. However, no data has reported on the effect of partial must reconstitution on the phenolic, chromatics and sensorial characteristics of the fermented beverages.
The aim of this project was the optimization of reverse osmosis (RO) for grape must processing and the subsequent use of the RO streams for the reconstitution of musts with lower sugar contents that will allow the production of fermented beverages with controlled lower alcohol content.
2. Material and methods
2.1. Musts
Grapes from Tinta Roriz, Syrah and Alicante Bouschet were harvested at Quinta do Quinto, in Santarém (Tejo Region, Portugal). The grapes were destemmed and crushed into a stainless-steel vessel. The original must was preserved in a refrigerated chamber at -1.6°C until processing by RO.
Reverse osmosis was performed by circulating the grape must through the membrane modules under a pressure gradient to separate the permeate, depleted of sugar, and the retentate which contains higher concentration of sugar. After separation, different formulations were performed. Retentate and permeate streams were mixed in specific proportions to obtain a must that would contain less sugar than the untreated must, and would allow the production of fermented beverages with controlled lower alcohol content, but with pleasant sensory characteristics. For such, a must reconstitution was carried out to obtain fermented beverages with an alcohol volume content of 5%, 7%, 10% and 13% (v/
v), in duplicate, in 4-L tanks. The formulations were
as follows: 5% (v/
v) (1.75 L of retentate + 3.25 L of permeate), 7% (v/v) (2.45
L of retentate + 2.55 L of permeate), 10% (v/
v) (3.5 L of retentate + 1.5 L of
permeate), 13% (v/
v) (4.55 L of retentate + 0.45 L of permeate). The musts
were inoculated with commercial activated Saccharomyces cerevisiae preparation.
Untreated must (control must) and retentate were fermented, too. The alcoholic fermentation occurred during a period of ten days at 18-20 °C. When completed, the beverages were racked, bottled and analysed. The initial characteristics of the grape must are shown in Table 1.
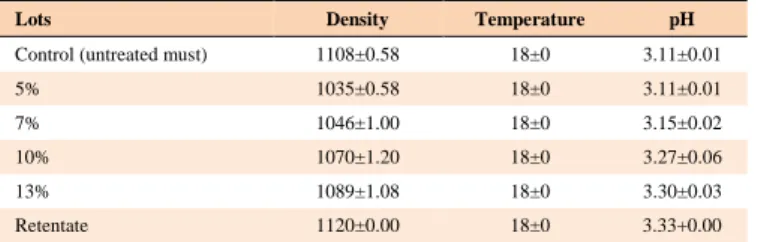
Table 1
Initial characteristics of the grape musts.
Lots Density Temperature pH
Control (untreated must) 1108±0.58 18±0 3.11±0.01
5% 1035±0.58 18±0 3.11±0.01 7% 1046±1.00 18±0 3.15±0.02 10% 1070±1.20 18±0 3.27±0.06 13% 1089±1.08 18±0 3.30±0.03 Retentate 1120±0.00 18±0 3.33+0.00 2.2. Experimental procedures
The reverse osmosis processing was carried out in the technological laboratory of the Escola Superior Agrária de Santarém. A 160 L volume of grape must was concentrated, in batch mode with an RO unit from Alpha Laval, with two sanitary spiral-wound modules RO99-3838/30 placed in series. The total active membrane area was 15 m2 (see Figure 1).
The RO test was performed with an average transmembrane pressure of 55 bar and a feed flow rate of 5500 L/h. The temperature of the grape must
increases from 4.5 ºC to 25 ºC during the experiment. A volume of 60 L of permeate and 222 L of retentate were collected during the experiment. A fraction of the retentate remained inside the RO unit and was lost during the cleaning procedure. The retentate was a sugar-rich stream and the permeate was a sugar-depleted stream.
Before and after the RO test, the membranes were cleaned with Ultrasil 11 (Henkel Ecolab) at pH 11 for about 30 minutes.
Fig. 1. Reverse osmosis unit with spiral wound modules (Alpha Laval).
2.3. Analysis of conventional oenological parameters, colour and chromatic characteristics
Alcohol content (v/v%), density, pH, titratable acidity, volatile acidity and chromatic characteristics (L*, a* and b*), as well as free and total SO2
were determined in accordance with the official OIV methods [39].
The total polyphenol index (TPI) was measured by the absorbance at 280 nm [40], the total anthocyanins determination was done according to Ribéreau-Gayon and Stonestreet [41]. The colour intensity (absorbance at 420 nm, 520 nm and 620 nm) and tonality (A420 / A520) were evaluated too.
UV/Vis spectrophotometric methods were performed using a Perkin Elmer-LAMBDA 25 UV/Vis spectrophotometer.
2.4. Sensory analysis
The sensory analysis was performed by a trained panel consisting of 5 panelists, with extensive tasting experience. The samples were stored in appropriate light and temperature conditions. Samples were presented to the panel in tasting glasses. The selected attributes were: visual (limpidity, color), aroma (intensity, quality), taste (intensity, quality) and overall judgment. Panelists were asked to rate all attributes on a 7-point scale.
3. Results and discussion
The RO-based grape must concentration was carried out from an initial sugar concentration of 23.7º Brix to a final sugar concentration of 28.5 ºBrix in the conditions specified in Table 2.
Table 2
RO grape must characteristics.
Average Transmembrane pressure 55 bar
Initial temperature 4.4 ºC
Final temperature 24.7ºC
Grape must feed volume 300L
Concentrate volume 222L
Permeate volume 60L
Feed sugar concentration 23.7ºBx
Retentate sugar concentration 28.5ºBx
Feed conductivity 1712 µS.cm-1
Retentate conductivity 1840 µS.cm-1
The permeate flux decline during the time interval of 55 minutes for the operation of concentration is shown in Figure 2 and the physical-chemical
H. Mira et al. / Journal of Membrane Science and Research 3 (2017) 308-312
characteristics are shown in Table 3. Permeate is a vegetal water, poor in sugars and rich in salts.
Fig. 2. Permeate flux versus time.
After the RO test, the permeate and retentate were mixed in specific proportions to obtain a must that contains less sugar than the untreated beverage (control) and an alcohol volume content of 5%, 7%, 10% and 13% (v/v). These must samples were fermented, as were the control must and the retentate. The beverages analysis were made and the results of oenological parameters of beverages are depicted in Table 4. Manipulating the initial sugar content prior to fermentation led to beverages whose final alcohol content after fermentation was what had been expected. All formulated beverages had an alcohol degree lower than the control beverage. The retentate alcohol content (15.7%) was higher than that of the control beverage, as expected due to the sugar retention.
It’s very important to analyze the main characteristics of the obtained fermented beverages. The titratable acidity increased significantly (p<0,05) with the increasing proportion of retentate, since the retentate concentrates the acids. However, no significant differences were observed between the beverage with 13% of alcohol content and the control, and also in comparison with the retentate beverage. The increase of the pH with the rise in alcohol content is not uniform.
Regarding the volatile acidity (VA), no significant differences (p>0,05) were found between beverages with 5%, 7%, 10% and 13% alcohol content, although the control beverage still has significantly higher VA, probably because of the occurrence of some microbiological contamination due to its sugar content.
Table 3
Characterization of permeate over time.
Time (minutes) Sugar (ºBx) pH Condutivity (µS.cm-1) 10 0.7 2.62 152.7 20 0.7 3.07 195.6 30 0.6 2.84 230.0 40 0.5 2.87 329.0 50 0.4 2.65 372.0
The residual sugar at the end of the fermentation is lower in the beverages with less alcohol content, probably due to the increased efficiency of the yeast during the fermentation. At the end of the fermentation, the SO2
free and the total level were very low, as expected. Since it is consumed during fermentation, it is always necessary to add SO2 at the end of the
fermentation. The phenolic compounds have higher molecular weight than sugars, so they are highly retained. They are mainly related to the colour of the beverage.
The total polyphenol index (TPI) of the beverage with 5% of alcohol content was significantly lower than that of the ones with a higher alcohol content, even the one with 13% alcohol content had a significantly lower TPI than the control. This phenomenon may be attributed to membrane adsorption of polyphenols, since the control that is no submitted to RO has higher TPI value. The same results were reported in the literature [33], beverages with a decreased alcohol content revealed lower concentrations of phenolic compounds than in the control beverage.
Reverse osmosis affects the concentration of polyphenols and also the parameters related to it, such as the colour [36]. As could be observed in
Table 4, the total anthocyanin content was significantly lower in manipulated beverages than in the control beverage. The beverages with 5% and 13% alcohol content presented 68% and 50.2% anthocyanins content loss, respectively, and when compared with the control beverage.
Regarding the colour of the beverages, the intensity increased significantly with the alcohol content, probably due to the concentration of phenolic compounds and, namely anthocyanins. These results are in accordance with those reported by Salgado et al. [36] and Garcia-Martin et al.
[32].
The hue of the control beverage was significantly lower than the one of the other beverages. The brightness (L*) decreased significantly with alcohol content. In better words, the beverage with 5% was the brightest, while the colorimetric parameters a* (red) and b* (yellow) had an important decrease with the increase in alcohol. This darkening of the 13% beverage, as well as the increase in red color (has a higher a* value) and the higher yellowness (with a higher b* value) were mainly attributed to the beverage matrix, namely the polyphenolics. These results are in agreement with the values found for colour intensity and tonality.
Table 4
Beverage quality parameters.
beverage’s nominal alcohol concentration
control 5% 7% 10% 13% retentate*
Alcohol (%) 15.2e ±0.07 5.4a ±0.05 7.5b ±0.05 10.7c ±0.05 13.8d ±0.14 15.7
Titratable acidity (g/L tartaric acid) 6.6c ±0.20 3.7a ±0.30 3.9a ±0.10 5.2b ±0.1 6.3c ±0.1 6.6
Volatil acidity (g/L acetic acid) 0.72b ±0.03 0.44a ±0.05 0.36a ±0.03 0.37a ±0.05 0.44a ±0.09 0.92
pH 3.31ab ±0.00 3.27a ±0.03 3.35bc ±0.01 3.39c ±0.01 3.34bc ±0.00 3.38
Glucose + fructose (g/L) 3.2c ±0.06 0.2a ±0.49 0.5a ±0.17 1.3b ±0.11 2.6c±0.21 2.3
SO2 F (mg/L) 0.0a ±0.0 0.0a ±0.0 0.27a ±0.18 3.2b ±1.3 4.3b ±0.8 1.6
SO2 T (mg/L) 15.5a +3.0 9.9a ±1.0 10.13a ±2.1 12.3a +1.6 15.5a ±2.7 4.8
TPI 26.88e ±0.86 9.60a ±0,69 12.82b ±0.06 18.32c ±0.35 22.02d ±1.72 25.75
Total Anthocyanins (mg/L malvidin-3-gluc.) 141.02b ±12.38 45.08a ±5.00 50.48a +3.26 61.49a±15.94 70.26a ±2.22 48.24
Intensity 36.99d ±0.11 13.14a ±0.06 18.96b ±0.07 26.96c ±0.14 38.26d ±0.06 38.95
Tonality 0.594a ±0.00 0.686b ±0.01 0.700b ±0.01 0.691b ±0.03 0.690b ±0.00 0.786
L* 40.68a ±0.58 63.90d ±1.60 54.97c ±0.76 46.60b ±1.43 38.70a ±0.38 39.40
a* 65.35d ±0.33 40.31a ±1.23 48.49b ±0.94 57.23c ±1.53 63.05d ±0.21 59.53
b* 33.81d ±0.59 14.19a ±0.58 18.94b ±0.76 26.81c ±1.42 34.99d ±0.52 41.29
Mean value ± standard deviation of two replicates, except to retentate; different letters in a line (for each parameter) indicate significant differences (Tukey Test, p<0.05). TPI – total polyphenols index, * no replicates
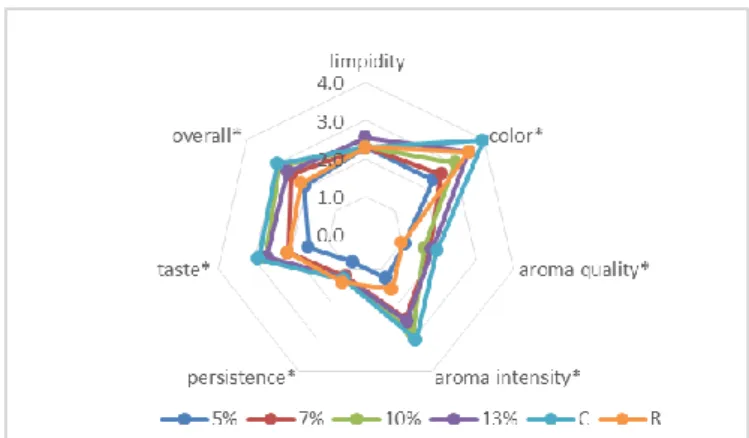
Some authors demonstrated that the beverage matrix, mainly alcohol content may have a significantly impact on the sensory attributes [43-46].
Spider diagram obtained from average values of visual, olfactory and gustative attributes from sensory analysis of beverages with 5%, 7%, 10%, 13% alcohol content, control and retentate beverages are reported at Figure 3. Significant differences (p < 0,05) in sensory profiles of reduced alcohol beverages were perceived by the panelists, as compared with the original beverage, apart from the limpidity. The greatest variations were presented to the beverage with low alcohol content, the panelists reported that beverages with low alcohol content had lower colour, decreased aroma intensity, increased perception of some defects such as oxidation and hydrogen sulphite, and very short persistence, as well. This is in agreement with some authors
[33, 44, 45] who have reported that great differences in the alcohol range, greater than 2%, produce noticeable sensory changes. The original beverage was considered to be the most balanced.
These results are not only related to the alcohol content, but also to the chemical composition of the beverages in particular of the phenolic composition. Some studies [43, 46] have found that reduction of beverage alcohol content can result in a significant decrease in the perception of beverage quality by the consumers.
Fig. 3. Sensory evaluation of beverages with different alcohol content, control and retentate
beverages. *indicates significance at p < 0.05.
4. Conclusions
The negative effects of alcohol on health as well as the reduction of calorie intake has led to the development of technology to reduce the alcohol content in fermented beverages in recent years.
This study provides a first report on the effect of reduced alcohol content by reconstituted grape musts, mixing permeate and retentate in different proportions, instead of the application of membrane technology in beverage, with the aim of preserving the sensorial characteristics. This study demonstrated that beverage´s chemical composition and sensory attributes can be modified significantly. The two beverages with the highest permeate proportions (with low alcohol content) have a lower content of total polyphenols, anthocyanins, and colour intensity, which influences the sensory evaluation. Due to the obtained results, it will be necessary to continue the studies in order to optimize the process with less influence in the composition of the beverages.
Acknowledgments
Acknowledgment to Fundação para a Ciência e Tecnologia, Portugal, for Financial Support CeFEMA- UID/CTM/04540/2013.
We are grateful to the panelists for their availability and commitment, namely Carmen Santos (Wtejo), Carlos Eduardo (Enoport), João Sardinha (Adega Cooperativa de Alcanhões), Maria Vicente (Casa 1927), Martta Simões (Quinta da Alorna) and Pedro Gil (Adega Cooperativa do Cartaxo).
References
[1] J.M. Alston, K.B. Fuller, J.T. Lapsley, G. Soleas, Too much of a good thing? Causes and consequences of increases in sugar content of California wine grapes, J. Wine Econ. 6 (2011) 135–159.
[2] R. Longo, J.W. Blackman, P.J. Torley, S.Y., Rogiers, L.M. Schmidtke, Changes in volatile composition and sensory attributes of wines during alcohol content reduction, J. Sci. Food Agric. 97 (2017) 8-16.
[3] C. Varela, P.R. Dry, D.R. Kutyna, I.L. Francis, P.A. Henschke, C.D. Curtini, P.J. Chambers, Strategies for reducing alcohol concentration in wine, Aust. J. Grape Wine Res. 21 (2015) 670–679.
[4] U. Schobinger, R. Waldvogel, P. Dürr, Method for the preparation of wine or fruit wine without alcohol, International Publication Number WO 82/02723 (1982). [5] E. Gómez-Plaza, J.M. López-Nicolás, J.M. López-Roca, A. Martı́nez-Cutillas,
Dealcoholization of Wine. Behaviour of the Aroma Components during the Process, LWT - Food Sci. Technol. 32 (1999) 384–386.
[6] M. Catarino, A. Mendes, Dealcoholizing wine by membrane separation processes,
Innov. Food Sci. Emerg. Technol. 12 (2011) 330–337.
[7] Y.Y. Belisario-Sánchez, A. Taboada-Rodríguez, F. Marín-Iniesta, A. López-Góméz, Dealcoholised wines by spinning cone column distillation: phenolic compounds and antioxidant activity measured by the 1.1-diphenyl-2-picrylhydrazyl method, J. Agric. Food Chem. 57 (2009) 6770–6778.
[8] B. Fedrizzi, E. Nicolis, F. Camin, E. Bocca, C. Carbognin, M. Scholz, P. Barbieri, F. Finato, R. Ferrarini, Stable isotope ratios and aroma profile changes induced due to innovative wine dealcoholisation approaches, Food Bioprocess Technol. 7 (2014) 62–70.
[9] G.D. Francesco, G. Freeman, E. Lee, O. Marconi, G. Perretti, Effects of operating conditions during low-alcohol beer production by osmotic distillation, J. Agric. Food Chem. 62 (2014) 3279–3286.
[10] L. Liguori, P. Russo, D. Albanese, M.D. Matteo, Evolution of quality parameters during red wine dealcoholization by osmotic distillation, Food Chem. 140 (2013) 68–75.
[11] L. Liguori, P. Russo, D. Albanese, M.D. Matteo, Effect of process parameters on partial dealcoholization of wine by osmotic distillation, Food Bioprocess Technol. 6 (2012) 2514–2524.
[12] S. Varavuth, R. Jiraratananon, S. Atchariyawut, Experimental study on dealcoholization of wine by osmotic distillation process. Sep. Purif. Technol. 66 (2009) 313–321.
[13] N. Diban, V. Athes, M. Bes, I. Souchon, Ethanol and aroma compounds transfer study for partial dealcoholization of wine using membrane contactor, J. Membrane Sci. 311 (2008) 136–146.
[14] P.A. Hogan, R.P. Canning, P.A. Peterson, R.A. Johnson, A.S. Michaels, A new option: osmotic distillation, Chem. Eng. Prog. 94 (1998) 49–61.
[15] A. Olmo, C.A. Blanco, L. Palacio, P. Pradanos, A. Hernandez, Pervaporation methodology for improving alcohol-free beer quality through aroma recovery, J. Food Eng. 133 (2014) 1–8.
[16] L. Takács, G. Vatai, K. Korany, Production of alcohol free wine by pervaporation, J. Food Eng. 78 (2007) 118–125.
[17] M. Gil, S. Estévez, N. Kontoudakis, F. Fort, J.M. Canals, F. Zamora, Influence of partial dealcoholization by reverse osmosis on red wine composition and sensory characteristics, Eur. Food Res. Technol. 237 (2013) 481–488.
[18] M. Catarino, A. Mendes, Non-alcoholic beer: a new industrial process, Sep. Purif. Technol. 79 (2011) 342–351.
[19] M. Bogianchini, A.B. Cerezo, A. Gomis, F. Lopez, M.C. Garcia-Parrilla, Stability, antioxidant activity and phenolic composition of commercial and reverse osmosis obtained dealcoholised wines, LWT – Food Sci. Technol. 44 (2011)1369–1375. [20] M. Mietton-Peuchot, New Applications for Membrane Technologies in Enology. In:
Membranes for Food Applications - Vol. 3. Wiley-VCH Verlag GmbH & Co. KGaA, Weinheim, Germany. 2010, pp. 119-127.
[21] J. Labanda, S.Vichi, J. Llorens, E. López-Tamames, Membrane separation technology for the reduction of alcoholic degree of a white model wine, LWT - Food Sci. Technol. 42 (2009) 1390–1395.
[22] A. Massot, M. Mietton-Peuchot, C. Peuchot, V. Milisic, Nanofiltration and reverse osmosis in winemaking, Desalination, 231 (2008) 283–289.
[23] M.V. Pilipovik, C. Riverol, Assessing dealcoholization systems based on reverse osmosis, J. Food Eng. 69 (2005) 437–441.
[24] A.Versari, R. Ferrarini, G.P. Parpinello, S. Galassi, Concentration of Grape Must by Nanofiltration Membranes, Food Bioprod. Process. 81 (2003) 275–278.
[25] M. Lopez, S. Alvarez, F.A. Riera, R. Alvarez, Production of low alcohol content apple cider by reverse osmosis, Ind. Eng. Chem. Res. 41 (2002) 6600–6606. [26] R. Ferrarini, A. Versari, S. Galassi, A preliminary comparison between
nanofiltration and reverse osmosis membranes for grape juice treatment, J. Food Eng. 50 (2001) 113–116.
[27] J.L. Escudier, Evaluation de quelques techniques adaptées a la d’esalcoolisation des vins. La Revue Française d’Oenologie, 57S (1990) 57–61.
[28] K. Bui, R. Dick, G. Moulin, P. Galzy, A reverse osmosis for the production of low ethanol content wine. Am J Enol Vitic. 37 (1986) 297–300.
[29] J. Bonnet, H. Vilmorin, Process for the controlled reduction of the sugar content of fruit juice and device for practicing this process, International Publication Number US 2004/0234658A1 (2004).
[30] E. Aguera, V. Athes-Dutour, M. Bes, S. Caille, P. Coterreau, J.L. Escudier, M. Mikolajczak, A. Roy, J.M. Sablayrolles, A. Samson, I. Souchon, J.P. Vidal, Réduction de la teneur en alcool des vins: Étude comparative de différentes technologies, Bulletin de l’OIV, 83 (2010) 31–42.
[31] P. Cottereau, D. Solanet, C. Riou, P. Noilet, Réduction de la teneur en sucre des moûts: simplification du process, Raisins et Vinifications, 5 (2011) 27–33. [32] N. García-Martín, S. Perez-Magariño, M. Ortega-Heras, C. González-Huerta, M.
Mihnea, M.L. González-Sanjosé, L. Palacio, P. Prádanos, A. Hernández, Sugar reduction in musts with nanofiltration membranes to obtain low alcohol-content wines, Sep. Purif. Technol. 76 (2010) 158–170.
[33] C.M. Salgado, F.J. Carmona, L. Palacio, P. Prádanosa, A. Hernández, Evaluation of Nanofiltration Membranes for Sugar Reduction in Red Grape Must, Procedia Eng. 44 (2012) 1716–1717.
[34] Method for Simultaneous Concentration and Rectification of Grape Must Using Nanofiltration and Electrodialysis”, PCT/PT2007/000045; US 2010/ 0092628; WO2008/051100; South Africa Nº: 2009/02802.
H. Mira et al. / Journal of Membrane Science and Research 3 (2017) 308-312
[35] C.R. Smith, Apparatus and method for removing compounds from a solution. International Publication Number US 5480665 (1996).
[36] C.M. Salgado, E. Fernández-Fernández, L. Palacio, A. Hernández, P. Prádanosa, Alcohol reduction in red and white wines by nanofiltration of musts before fermentation, Food Bioprod. Process 96 (2015) 285–295.
[37] A. Gambuti, A. Rinaldi, M.T. Lisanti, R. Pessina, L. Moio, Partial dealcoholisation of red wines by membrane contactor technique: influence on colour, phenolic compounds and saliva precipitation index, Eur Food Res Technol 233 (2011) 647– 655.
[38] S. Meillon, C. Urbano, P. Schlich, Contribution of the temporal dominance of sensations (TDS) method to the sensory description of subtle differences in partially dealcoholized red wines, Food Qual. Prefer. 20 (2009) 490–499.
[39] OIV, Compendium of International Methods of Wine and Must Analysis I/II. p. Organisation Internationale de la Vigne et du Vin, Paris, France, 2016.
[40] P. Ribéreau-Gayon, Le dosage des composés phénoliques totaux dans les vins rouges, Chimie Analytique 52 (1970) 627-631.
[41] P. Ribéreau-Gayon, E. Stonestreet, Les dosages des anthocyanes dans le vin rouge.
Bull. Société Chimie, 9, (1965), 2649-2652.
[42] E.S. King, H. Heymann, The effect of reduced alcohol on the sensory profiles and consumer preferences of white wine, J. Sens. Stud. 29 (2014) 33–42.
[43] M.T. Lisanti, A. Gambuti, A. Genovese, P. Piombino, L. Moio, Partial dealcoholization of red wines by membrane contactor technique: effect on sensory characteristics and volatile composition, Food Bioprocess Technol. 6 (2013) 2289– 2305.
[44] S. Meillon, D. Viala, M. Medel, C. Urbano, G. Guillot, P. Schlich, Impact of partial alcohol reduction in Syrah wine on perceived complexity and temporality of sensations and link with preference, Food Qual. Pref. 21 (2010) 732–740. [45] M.P. Saenz-Navajas, E. Campo, L. Cullere, P. Fernandez-Zurbano, D. Valentin, V.
Ferreira Effects of the nonvolatile matrix on the aroma perception of wine, J. Agric. Food Chem. 58 (2010) 5574–5585.
[46] S. Meillon, C. Urbano, G. Guillot, P. Schlich, Acceptability of partially dealcoholized wines – Measuring the impact of sensory and information cues on overall liking in real-life settings, Food Qual. Pref. 21 (2010) 763-773.