Compromised user credentials detection in a digital enterprise
using behavioral analytics
Saleh Shah1, Babar Shah2, Adnan Amin1, Feras Al-Obeidat2, Francis Chow3, Fernando Joaquim Lopes
Moreira4, Sajid Anwar1 1
Center of Excellence in Information Technology, Institute of Management Sciences, Peshawar 25000, Pakistan. 2
College of Technological Innovation, Zayed University, Abu Dhabi 144534, United Arab Emirates 3Interdisciplinary Studies Department, Zayed University, Abu Dhabi 144534, United Arab Emirates
4REMIT, IJP, University of Portucalense & IEETA, University of Aveiro, Portugal. [email protected], {babar.shah, Feras.Al-Obeidat, francis.chow}@zu.ac.ae, [email protected],
{adnan.amin,sajid.anwar}@imsciences.edu.pk Abstract.
In today’s digital age, the digital transformation is necessary for almost every competitive enterprise in terms of having access to the best resources and ensuring customer satisfaction. However, due to such rewards, these enterprises are facing key concerns around the risk of next- generation data security or cybercrime which is continually increasing issue due to the digital transformation four essential pillars- cloud computing, big data analytics, social and mobile computing. Data transformation-driven enterprises should ready to handle this next-generation data security problem, in particular, the compromised user credential (CUC). When an intruder or cybercriminal develops trust relationships as a legitimate account holder and then gain privileged access to the system for misuse. Many state-of-the-art risk mitigation tools are being developed, such as encrypted and secure password policy, authentication, and authorization mechanism. However, the CUC has become more complex and increasingly critical to the digital transformation process of enterprise’s database by a cybercriminal, we propose a novel technique that effectively detects CUC at the enterprise-level. The proposed technique is learning from the user’s behavior and builds a knowledge base system (KBS) which observe changes in the user’s operational behavior. For that reason, a series of experiments were carried out on the dataset that collected from a sensitive database. All empirical results are validated through well-known evaluation measures, such as (i) accuracy, (ii) sensitivity, (iii) specificity, (iv) prudence accuracy, (v) precision, (vi) f-measure, and (vii) error rate. The experiments show that the proposed approach obtained weighted accuracy up to 99% and overall error of about 1%. The results clearly demonstrate that the proposed model efficiently can detect CUC which may keep an organization safe from major damage in data through cyber-attacks.
Keywords: Compromised user detection, Compromised activities detection, Knowledge-base system, prudence analysis, Cluster-level pattern
1.
Introduction
In the recent decade, due to great paradigm shifts in terms of technological advances, organizations are facing business volatility; requiring business agility and changing the way people work to optimize business performance. Therefore, most of the organizations have undertaken digital transformation. The digital transformation, simply called digitalization, is the ability to turn existing services or products into digital alternatives and thus offer benefits over the tangible product. It is also known as a business model driven by the changes associated with the presentation of digital technology in every aspect of the human society [1]. The digital transformation for laying the foundation of new products or services, for existing or new organization, and for business models, consists of the four essential pillars—cloud computing, big data & analytics, social activities and mobile computing [3]. Any organization that adopts any of these pillars will have resultantly data that’s bigger in volume, different in variety and velocity. If such data of any organization is not safe or can be easily accessed and altered by an unauthorized person, it will have a greater impact in terms of losses and will negatively affect any business enterprise. Thus, digital transformation-driven enterprises should be ready to face such type of next-generation data security problem.
Digital technology has long played a pivotal role in the everyday business process and enterprises are engaged in defining a practical map for their digital transformation [1]. Data and software are now the front pillars of how digital enterprises effectively operate in today’s competitive business market [2]. The analysis and utilization of the data will be the future source of competitive power for almost every organization; therefore, data can be considered as a new resource for organizational operation equivalent to the money, products, and people. Therefore, enterprises that adopt digital transformation will be rewarded, but not without facing new challenges with their ever-expanding next-generation data security issues including cyber-attacks [2]. This ultimately emanates the need for these digitally transformed enterprises to handle and establish private network connections between all of their systems from multiple locations.
Secure access is an integral part of almost every enterprise in today’s competitive market. Over the years, various privileged access and encryption schemes have been developed in order to secure and protect the organizational/enterprise’s database from known attacks such as [3- 4]: (i) extortion, (ii) scamming the user’s information, (iii) spamming, (iv) phishing scam, (v) harvest login details, (vi) vulnerable server level scripting, and (vii) Sybil techniques. However, managing and securing privileged access in the context of digital transformation-based organization is a pressing challenge, The security of digital transformation for enterprises, is not an overnight process, but will inevitably rely on the ability to enforce privileged access governance technique (i.e., focusing on consistent user’s role, access from specific IP address) or advanced encrypted password mechanism [1], but the system can more accurately detect compromised user’s behavior or credential consistent with an attack, and enable appropriate
remediation. Compromised user credential (CUC) can be an intruder who steals user’s login detail, can often penetrate perimeter security to gain a privileged access to the multiuser database access environment [4]. Such cyber-attacks (i.e., CUC) are complex and difficult to detect when an attacker is operating just like a legitimate user because such attacker remains undetectable due to its legitimate appearance as a user [5]. On the other hand, handling CUC can be a safer option for the competitive and sensitive organization in terms of protecting from loss of confidential data, maintaining user’s privacy and integrity of sensitive data [3]. Cyber-criminal through CUC can disrupt and damage the system or process with fraudulent data transactions in the enterprise database that cannot be easily recovered or clean up [4]. Moreover, CUC is equally critical to the following domains, such as credit card, social networks, stock exchange, banking sector, military and computer security [5][6][7]. In order to facilitate, rather than discourage the enterprises from the digital transformation, privileged access to the sensitive database system and network infrastructure, we observed that there is a need of to incorporate the ability to detect CUC and immediately as new threats evolve through data mining and machine learning. For this purpose, we considered a temporal outlier analysis technique (TOA), because CUC is usually extracted from user past activities performed in a time-series fashion TOA is helpful to analyze the high dimensional, uncertain temporal or time-series and streaming data [5], [8] [9]. To the best of our knowledge, none of the existing empirical studies have addressed the problem of CUC at the organizational level instead of user level. Evidently, very less focus is given to TOA in the target problem. Therefore, in this study, we propose a novel technique using TOA to address not only aforementioned complex problem of CUC but also compromised user activities (CUA) at the organizational level (i.e., a group of users) instead of individual-level (i.e., user- level).
The digital data is playing a vital role in the competitive organizations due to the digitized data stored in database management systems. This has led to the importance of data security for these organizations, for the data to be used by the legitimate users and only for the desired purpose. While state-of-the-art database systems have well-known authorization, authentication, user right management and another mechanism for CUC but these processes are not sufficient to ensure data security in term of CUC [4], [7], [8], [9].
CUC involve observing the usage behavior of the relevant users. A rapid change in the user behavior is a challenging issue for the related research community as well as industry- specific in CUC. Consequently, the existing techniques may handle the CUC but whenever there is a change in the user behavior, it retains the whole behavior detection mechanism. Keeping this in view, this study is motivated for the following reasons. (i) efficiently discovered both: the user’s past activities (e.g., insert and update data in a database) patterns, and the group of users’ activities in a cluster, to build knowledge base system (KBS) for detecting not only CUC, (ii) Another mechanism is to generate an alert whenever a new change in the user behavior is observed through the prudence alert system, and (iv) It will handle CUC at organizational level
behavior CUC is still an open research problem, which requires more contribution from the research community. Hence, there is need for a study to cover the gap as discussed. Therefore, we present a novel approach for handling CUC.
This paper aims to provide an efficient and unified solution for CUC in a live database system. The three points, which categorize the contributions of this study, are: (i) introduction to a new approach for generating prudence alert, whenever a user or group of users in an organization performs compromised activities., (ii) to develop a KBS based on the individual- level pattern and organizational-level (cluster-level) patterns, which devise a novel approach that predicts the compromised users and their activities.
The remaining paper is organized as follows; Section 2 provides the literature review. The proposed approach is presented in Section 4. Evaluation and validation of results are discussed in Section 5. Section 6 concludes the paper with suggested future work.
2.
Literature review
In this section, a brief literature is provided about different approaches developed for handling the crucial problem of CUC.
2.1 Compromised User Credentials
Credentials provide a locking mechanism to the doors for the users to operate the resources, i.e., a database management system. It is often used to protect and limit the access of the user to a specified area within the data resource. When these credentials are compromised, it becomes a challenging problem for the organization to detect the validity or invalid of the user activities performed through compromised credentials, because the CUC represents the legitimate user login information that the cyber-criminal took over [3] [7]. A brief literature on a few of credential theft is provided as follows [10]: (i) credential leaks: it is referring to loss of user password and someone else used stolen password to access the user’s area, (ii) Phishing kits: are ready to deploy scripts for distributing phishing content that are used for stolen credentials, (iii) Keyloggers: provides built-in procedures to steal on-device user credentials, harvest clipboard text and record victim user’s screen activities. (iv) Hijacking behavior: hackers frequently hijack user’s credentials and use compromised accounts for abusing, spamming, miscreant’s searches and altering the data etc.
Several studies [4], [9], [11] have addressed the CUC problem which is growing rapidly and creating a challenging situation for competitive organizations. These approaches focus on the
target problem from different perspectives, such as statistical analysis, information theory and machine learning using data mining techniques. Most of the current studies have used an outlier detection method to report CUC as specific problem formulations [5]. K. Singh et al. [5] classified the outliers into three major categories:
- Point outliers: Referring to such observation when anomalous data instance detected as normal behavior.
- Collective outliers: Reflecting multiple data instances instead of single data instance as an outlier.
- Contextual outlier: When data instance is detected as an outlier in a specific condition. Sometimes it is also known as a conditional outlier.
It is also observed that point outer most frequently arises in the major dataset while collective usually reported in the geospatial dataset while the combination of point and collective outliers can be converted into a contextual outlier issue by providing some contextual feature into dataset [7]. In the proposed approach, we detected the compromised user and their compromised activities based on the certain conditions; whenever the condition satisfies, it would give us the result with respect to the mentioned conditions, such as contextual outlier (e.g., Compromised or Non-Compromised). Contextual outlier feature is embedded in order to overcome the short comes of Point and collective outlier techniques.)
Viswanath et al [6] presented a technique based on unsupervised learning and principal component analysis to differentiate between normal and abnormal behavior. Their model trained on historical data and whenever a changed pattern observed, it considers such activity as an outlier activity. Similarly, K. Thomas et al. [12] have introduced a technique using a clustering method for anomaly detection for compromised users in large-scale cyber-attack on twitter dataset. They have reported that fourteen million users on twitters are victims of CUC. However, their method suffers from a high rate of false alarm when compared to models formulated through supervised and semi-supervised methods [5], [7].
Xue et al. [13] proposed a study based on combined techniques using fuzzy and rough set theory to detect outliers in the semi-supervised dataset. They employed positive and negative instances where negative instance reflected non-compromised and positive for compromised instances. Vincenzo Matta et al. [14] tested several scenarios to discriminate the normal users from the compromised users and it took about 1 minute to identify correctly almost all the bots. However, they have only focused on distributed denial-of-service (DDoS) attacks, which commonly implement through the botnet. They have also reported that simply applying tools that detect compromised nodes hidden in the network inferential tools for DDoS cannot be addressed when new challenges arise [14].
Mohamed Nidhal et al. [18] presented a new algorithm based on enhanced linear
algorithm is suitable only where connections are short and nodes have not enough time to perform manipulation in a highly mobile environment (e.g., VANET Telco). In order to add an additional layer of security in the well-known RSA algorithm, Diyya Piplani [19] introduced a pilot method for encrypting the user’s password with random prime numbers and provided a secure channel for data transmission between mobile App and web services. On the other hand, Marian Gawron et al. [20] have proposed a method for classification and identification of vulnerability as passive vulnerability, which not only detects vulnerabilities but also reuses the existing information about the target infrastructure to eliminate the comprehensive scan of the target system. Since the detection of vulnerabilities relies on the information about the target infrastructure, they have also claimed that their method is able to detect vulnerabilities without the expensive required effort of a scan, which ultimately increases the overall performance of the detection.
Bimal Viswanath [6] built an unsupervised anomaly detection approach using principal component analysis (PCA) that identified the normal user's behavior and accurately identifies significant deviations from it as anomalous. In connection to this work, Manuel Egele et al. [4] presented another approach for detecting compromised user accounts in social networks. This approach was the combination of statistical modeling and anomaly detection to identify accounts that experience a sudden change in the user’s patterns. They have focused on groups of accounts that all experience a similar change in a pattern within a short time of period, can assume that these changes are due to a malicious campaign that is unfolding. In subsequent work, Xin Ruan et al. [15] have observed the social behaviors of a user in social networks can effectively characterize the user’s operational activities, and their empirical results shown the social behavioral profiles can accurately distinguish normal user and compromised user’s accounts. However, detection of compromised accounts is quite challenging due to the established trust relationship between the legitimate user and their friends, but protecting sensitive data against compromised insiders is also a difficult problem for many sensitive organizations.
On the other hand, access control mechanisms are not always capable to prevent legitimate users from misusing or stealing organizational data as cyber-attackers often have access to such important data while vulnerabilities and phishing attacks make it possible for cyber-attackers compromise the user’s credentials that have access to the sensitive or private data. Therefore, Shagufta Mehnaz et al. [22] provided solutions for protecting from cyber- attacker by combining the user access control mechanisms and other users’ rights such as password encryption. They have created fine-grained user profiles from the users’ normal file access behaviors. As a result, they obtained about 98.64% accuracy in detecting anomalies and incurred an overhead of only 2%.
Karanjit Singh et al. [5] have brought together several outlier detection methods based on the structured and generic description. They have analyzed for a better understanding of the
various directions of research on outlier analysis and presented comprehensive background study in different areas of compromised credentials from many relevant links. Antonio Pechhia et al. [9] proposed an approach for CUC using the Bayesian network for analyzing the key characteristics of the data security provided by the monitoring tools (e.g., IDS and Net Flows). The experimental results demonstrated that this approach is efficient in detecting CUC. However, it has eliminated 80% not compromised users being compromised users. According to Yang Zhang et al. [16], those measurements that deviated from the normal behavior of sensed data can be considered as outliers while potential links of outliers include noise and errors or events and possibly malicious attacks. However, existing outlier detection techniques are no more applicable to sensor data. Therefore, a technique-based taxonomy is used as a guideline to choose an appropriate method for outlier detection in term of data type, outlier type, its identity, and degree. Zi Chu [17] presented a study which deals with the classification of human, bot and cyborg account on the social network because legitimate bots generate a huge number of benign tweets on Twitter delivering news and updating user’s feeds but meanwhile, malicious bots spreading spam or malicious contents with by use of illegal manner.
In addition, CUC is critical to the known range of sensitive organization data, banking system and centralized database management systems [5] [6] [7]. Automated machine learning method (ML), can deal with such scenarios to analyze user behavior and activity. Multiple machine learning techniques (i.e., repetitive pattern analysis, mining of basic components and aggregation) has been used for CUC problem in the literature [7]. However, few research studies have worked on the efficient use of data extraction in conflict patterns in CUC within the literature [24]. According to Hawkins [18], "flavor is an observation that deviates from other ideas and leads to doubts arising from different mechanisms". Moreover, extreme value detection and analysis methods have applied that deal with different frequency bands i.e., broadcast data [5] [8][16]. These technologies are also divided into three categories: supervised and unsupervised, unchecked and semi-supervised pays less attention to the external use of learning supervision and testing.
This study focuses on time-dependent value analysis by performing temporal outlier analysis through repeatedly examining and analyzing the application of the time-data (i.e., time series or time-dependent) data to monitor learning techniques. SSL certification captures username, password or credit card number and it also verifies the identity of the user (e.g., exception or routine) carried out by a cyber-attacker [4][10][20]. However, in the proposed approach when a user passes these hurdles the existing technique will detect the user activity behavior. The most familiar user account type is a ‘personal user account’ that is used by a person to authenticate him or herself to the company’s resources. There is a hidden behavior pattern used to describe the "user behavior" of the person behind the account. For example, when we say that a particular user logs in, we check back his/her e-mails early in the morning, then in the office and during the night [26]. What happens is that a user account is authenticated from a
specific endpoint that exists at that particular location. In addition to advanced biometrics, used universally, we cannot say that it is obvious that people who log into the account often forget to log out from the system. However, when analyzing behavior patterns associated with a particular account would detect that user which are using the credentials (e.g., Username and Password) another user such as the given in the proposed approach.
It is also observed that outlier detection has inherited difficulties in term of classification of normal and outlier user’s activities. It sometimes falsely reflects outlier operation like a normal activity, and usually cannot update with evolving data and its subsequent use as the time passes. Therefore, it is still difficult to efficiently detect changes in user’s and cluster-levels patterns and classifying it from normal to an outlier behavior. Due to the above-mentioned challenges, current studies are not appropriate to handle CUC is especially used TOA technique. In this study, we have focused on TOA as a supervised learning technique, which efficiently analyzes temporal data and detects individual level as well as enterprise (cluster) level CUC. The main idea of the proposed approach is to set up individual-level and cluster-level patterns information in KBS that interact with the database for normal user behavior.
4.
Empirical Setup
In this section, we have explored the problem statement and evaluation measures followed by the evaluation of the empirical setup of the proposed approach.
4.1. Problem statement
The CUC detection is referred to the binary classification dilemma of web Spambot and spam classification [21][22]. Suppose:
D = {u1, u2, u3, u4, u5 … . Un} (1)
Where D is a dataset and Un is n number of users, who perform the insert and update operations.
U = {xi, xj} (2)
Where U is the set of all users of the company and xi and xj are representing the non-
compromised and compromised users. A function φ (ua, xb) where uais used with the activity xb with respect to dataset D, it will do the user activity either as non-compromised and
compromised activity. The mentioned decision function is described below:
φ(ua, xb) : D x U → { NC, C } (3) φ(ua, xb) Is a binary class function, where:
C ua∈ Xj
φ(ua, cb) = (4)
Description
Keep the user's Activity for each operation in time series manner i.e., Hour, Month, Day
In the CUC test, there is one class of each UI and is classified as:
φ(ua) compromised : D → {C, NC}. (5) The proposed technique will efficiently detect the compromised user; whenever a user performs any activity such as insert and update operation, it will be observed with respect to historical patterns (such as individual-level pattern, cluster-level pattern). If a user is detected as compromised, then the other condition related to the cluster-level pattern will be validated for that particular user (see Section 4.3.3).
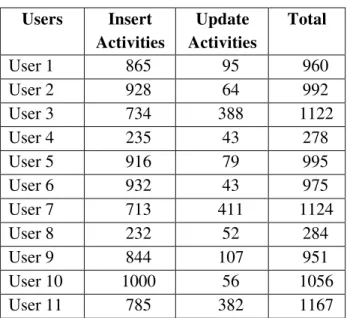
4.2. Subject dataset
Data for this research is collected from a very sensitive organization for the period of three-years. For reasons of confidentiality, the name of the organization cannot be revealed. Table 1 reflects the list of attributes with description, where “User_ID” specifies the unique id of each -user, the “Access timestamp” attribute is used to record the timestamp (i.e., hour, day and month) of each user’s activity, and the last attribute “Operations” is specifying the user’s data manipulation operations i.e., insert and update. Table 2 summarizes user activities (i.e., insert and update performed by five users).
Table 1. Structure of Dataset
Table 2. User’s Activity Statistics
Users Insert Activities Update Activities Total User 1 865 95 960 User 2 928 64 992 User 3 734 388 1122 User 4 235 43 278 User 5 916 79 995 User 6 932 43 975 User 7 713 411 1124 User 8 232 52 284 User 9 844 107 951 User 10 1000 56 1056 User 11 785 382 1167
It holds the user's operating record, that is, insert or update
Operations Access timestamp
Specifies the user's unique ID
User_ID
User 12 237 56 293 User 13 783 112 895 User 14 881 63 944 User 15 670 350 1020 User 16 222 15 237 User 17 777 122 899 User 18 812 50 862 User 19 851 378 1229 … … … …. User 100 285 27 312
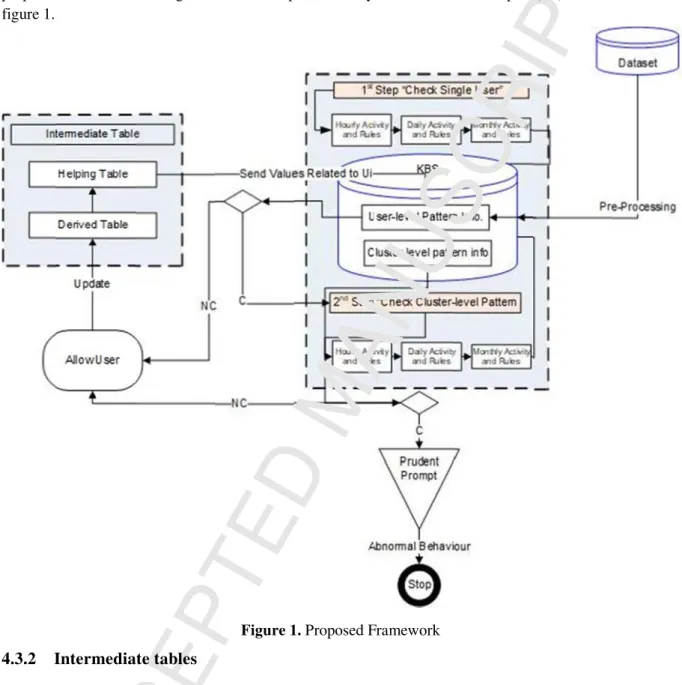
4.3. The proposed framework
The proposed framework contains certain important components, such as (i) KBS which is built from two different categories of patterns: the individual-level pattern information, and Cluster- level pattern information (ii) Intermediate tables e.g., helping and derived tables, as well as (iii) prudent prompt.
4.3.1 Building of KBS based on User/Cluster-levels patterns
There are many knowledge acquisition methods have been developed. However, selecting the best and appropriate knowledge acquisition approach for the desired task (in hand), is still a critical problem for KBS developers [23]. This study describes the methods needed to produce convincing performance over other methods and efficiently detection of CUC at both levels (user and organizational levels).
To build the KBS with the core component of the proposed framework, we have observed and analyzed all the user's behavior in term of operations (e.g., Insert and Update) and a number of a transaction performed by them in some specific time period. Initially, we counted the number transaction performed by each user separately and discovered the user’s pattern for each hour of the week-days (e.g., 24hours x 7days a week = 168 total hours). As result, we obtained each user pattern for each hour or every week-day and stored the information into a specific table (i.e., individual-level pattern information). Similarly, we have observed the behavior of all users in a cluster. The cluster contains only those patterns of users which are more correlated to the current users based on the operations and number of the transaction performed in the same time period. To find the correlation coefficient we used the following formula.
r = n(∑ sy)–(∑ s)(∑ y) J[n ∑ s2–(∑ s)2][n ∑ y2–(∑ y)2]
The obtained patterns are then stored into cluster-level pattern info table. Finally, these two (individual-level and cluster-level patterns information) are stored into a single KBS. The proposed method for making effective use of prudent analysis and Simulated Expert (SE) is shown in figure 1.
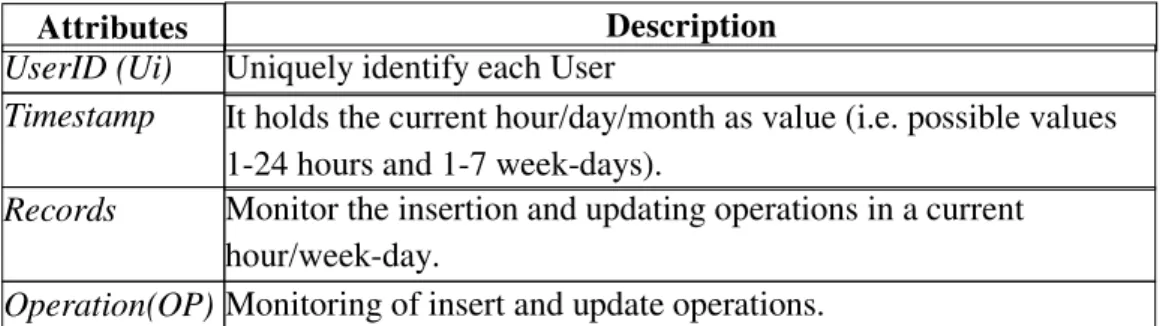
4.3.2 Intermediate tables
Figure 1. Proposed Framework
In the proposed method, two tables are used which are the following :(i) helping table, and (iii) derived table. First, the helping table is used to keep track of the user’s activities (i.e., insert and update) performed by each user with a timestamp. Further, the timestamp attribute’s value is divided into hours (Hr), and days,. The User_ID represents the unique identification of every user and records attribute holds the number of activities, which are performed by each user. Table 3 denotes the structure of the
helping table with description of each attribute.
It holds the current hour/day/month as value (i.e. possible values 1-24 hours and 1-7 week-days).
Uniquely identify each User
Monitor the insertion and updating operations in a current hour/week-day
The derived table is built which holds the aggregated values of the days and months counted for both user level and organizational level activities. Basically, it is dependent on the helping table’s values. The
values of the
derived table are obtained from the helping table. Table 4 reflects the derived table.
Table 4. Derived table structure
4.3.3. Prudence Analysis
Prudence is a warning alarm, which is generated when some abnormal behavior pattern occurs [24], [25]. For generating the prudent prompt, the proposed framework first checks the current user activities with individual-level pattern information, if it is not matched then it checks with the current cluster-level pattern information If again it does not match then it will generate the prudent prompt that the current specific user is a compromised user and also it will identify the list of compromised activities performed by this specific user.
Finally, we have organized all the activities of the proposed approach into algorithmic steps in algorithm 1 which are the following:
Description
Monitoring of insert and update operations.
Operation Count of Records
It holds the current hour/day as value (i.e. possible values 1-24 for hours, 1-7 week-days).
Hour/Day title UserID
Description Attributes
Monitoring of insert and update operations.
Operation(OP)
Monitor the insertion and updating operations in a current hour/week-day.
Records Timestamp
Uniquely identify each User
UserID (Ui)
Algorithm 1: The proposed algorithm for detecting compromise users
Input: User Activities
Output: Compromised (C) or non-compromised (NC) user
1. START 2. SET
a. Ui := Current_UserID
b. ULP=Load Individual-level pattern from KBS c. CLP=Load Cluster-level patterns from KBS 3. SET
a. CurDay := Get from Now( ) //day is number of day in a week (1-7)
b. CurHour := Get from Now( ) //hour is number of hour in a week day (24 x 7= 168) 4. GET
a. UserDayPattern := Get from ULP for Ui, b. UserHourPattern := Get from ULP for Ui c. ClusterDayPattern := Get from CLP for Ui, d. ClusterHourPattern := Get from CLP for Ui
5. Result=Call Match_Trend (Ui, Hour, Day, Month, Operation) 6. IF Result := NC THEN
a. Allow user to perform an operation and accordingly update the intermediate tables. //increment the counter for count of activities of Ui in month, day and hourly b. hourly_update+:=1 and hourly_insert+:=1
c. daily_update+:=1 and daily_insert+:=1 d. monthly_update+=1 and
7. ELSEIF Result := NC THEN
a. Allow user to perform an operation and accordingly update the intermediate tables. //increment the counter for count of activities of Ui in month, day and hourly b. hourly_update+:=1 and hourly_insert+:=1
c. daily_update+:=1 and daily_insert+:=1 d. monthly_update+=1 and
e. GET values from intermediate table WHERE UserID:=Ui, Day:=Cur_Daymin/max, Hour:=Cur_hourmin/max and Month:=Cur_Month
8. END IF 9. STOP
10. Match_Trend(user, CurHour, CurDay, operation)
11. START FUNCTION
12. Calculate user user_trend for day = week-day , operation = oper 13. IF current_transections < user_trend(week-day, current-hour)
a. Return NC
14. ELSEIF total_transection(t-1, t , t+1) < usertrend(week-day, precious 2 hours+ current-hour) //left side of < sign is condition 1 and right side of < sign is condition 2
a. return NC 15. ELSE
a. calculate cluster trend for week-day
1 https://www.mathworks.com/products/matlab.html return NC c. ELSE return C 16. END IF 17. STOP FUNCTION
5. Results and Discussion
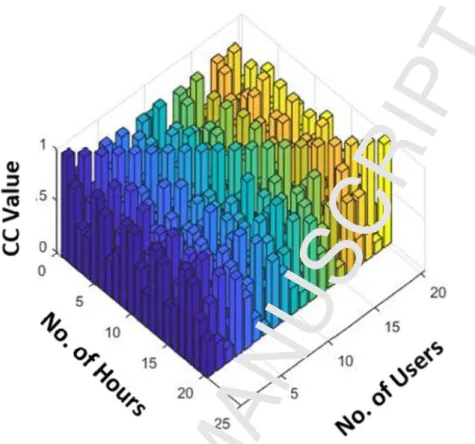
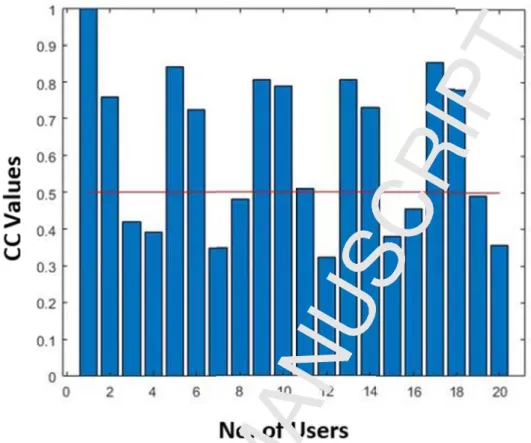
In this section, we have discussed the results of the proposed study. We have observed the activities of the existing 100 users for the next six months and validated the users’ behavior whether these users are performing compromised or non-compromised activities. For the reason, the proposed approach will check the user’s behavior with individual-level pattern information., if it is found that user does not match with the existing pattern of the user then the system will check the patterns of the rest of the users in the cluster-level pattern information. The number of the users in the cluster can be calculated using correlation coefficient formula (see equation 6). Figure 1 illustrates the correlation coefficient for N x N users. In this study, we have considered 20 users (for clear understanding and visualization) so 20 x 20 correlation coefficient is calculated using MATLAB Toolkit1.
Figure 2. The correlation coefficient for N x N users. Where x-axis represents the total number of users (1-20), y-axis reflects the hours in a week-days (1-24), while the CC Value is representing the calculated correlation coefficient for all the users from all users.
The range of the CC value (Correlation coefficient value) is 0, 0.5 and 1 in figure 2. Further, we have analyzed to only check highly correlated users with each other instead of checking all the users with other all users including the particular user itself as it is computationally very expensive. Therefore, we have investigated that a particular users’ pattern is very much closely related to the target user’s behavior. For this reason, we extracted the patterns of all users and have drawn a boundary based on the CC value of 0.5. Figure 3. Visualize the highly correlated users.
Figure 3. Differentiation of highly correlated and low correlated users based on the CC Value. Where x-axis represents the number of users and the y-axis reflects the correlation coefficient value. The line on the CC value of 0.5 separates the correlated users.
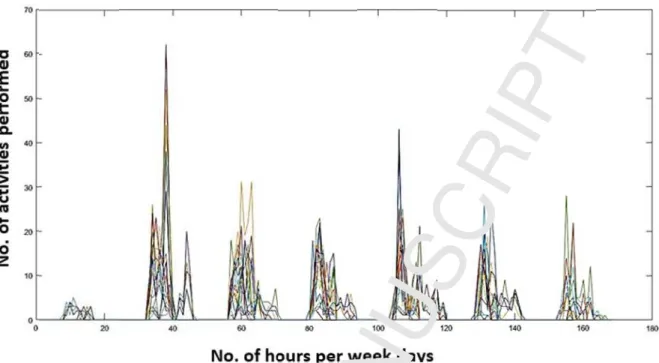
To know a single user operational (e.g., insert) behavior for the (1-24) hours and (1-7) week- days, we get 24 x 7 = 168 hours per week. Figure 4 clearly shows the overall pattern of a user.
Figure 4. Single user (Ui) pattern of overall activities performed within 168 hours for 7 week-
days. Where x-axis represents the total number represents the y-axis.
of hours per week-days, while the y-axis
From the figure 4, we have randomly selected one day for this specific users i.e. Ui to know observed user’s pattern more clearly. Figure 5 shows the single user maximum number of transaction in each hour for a single week-day.
Figure 5. Single user maximum number of transaction per hour in a single week-day.
The behavior of each user is stored in the individual-level pattern information, in KBS. Form the same patterns we have visualized the specific user patterns as shown in figure 4 and 5.
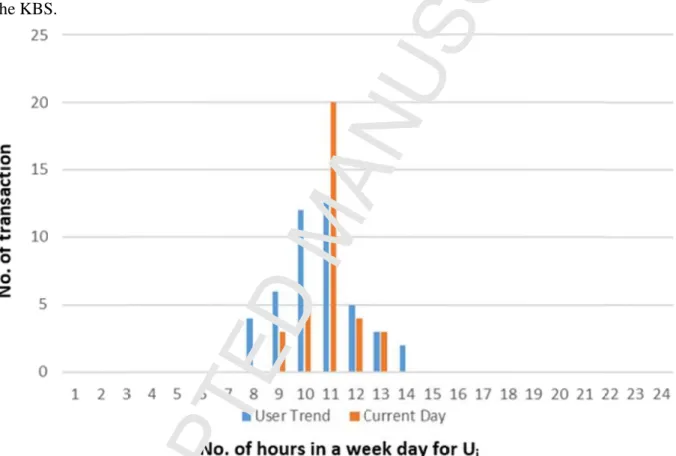
The role of the intermediate tables (as discussed in section 4.3.2) which keeps track of the current user’s current activities that are performed by that particular user. The proposed approach is comparing the user’s current activities with his existing pattern (individual-level pattern information), Figure 6 clearly illustrates the comparison of both patterns, one which is recorded in real-time with the aid of the helping and derived tables while another pattern already exists in the KBS.
Figure 6. The comparison of two patterns (current and existing in KBS) of a single user Ui. in
each hour the right-side bar (blue color) represent the existing pattern of a Ui, while the left-side bar in each hour (orange color) represent the current activities obtained from the intermediate tables.
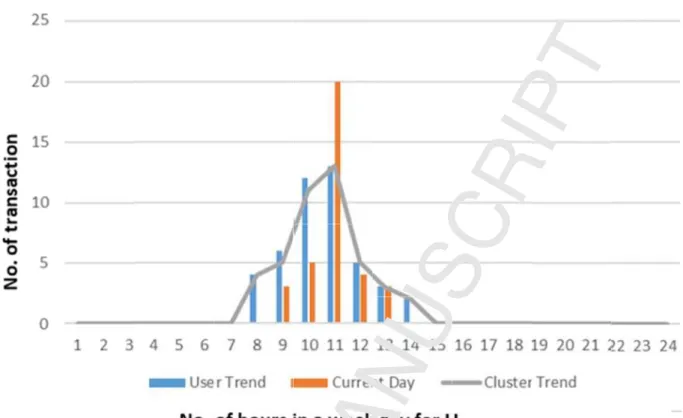
As we can see in figure 6 that the user current pattern and existing pattern does not match with each other. For this reason, the previous studies [24], [25], were considering such activities as straight away compromised activities performed by a user. While the proposed approach is generating prudent prompt because there are certain reasons, such as (i) Condition 1: the user may not perform as routine in the one hour before and after the unusual hour’s pattern
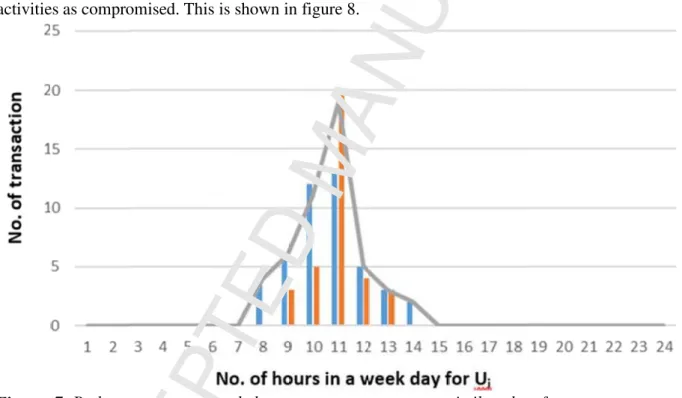
(compromised user at specific hour of the week-day only), and (ii) Condition 2: there is a chance that the particular cluster of users also performed some activities which are not matching with their previous pattern. Then this study has considered that the user’s behavior is eventually changed. Figure 6 reflects the user pattern and existing pattern doesn’t match but through our approach, the pattern was not considered compromised. It is clearly shown in figure 7 that the current user and cluster-user patterns eventually changes. Also, the user did not perform the activities as it was required in the 10th hour (one hour before) to match with the previous pattern. Similarly, the same user also did not perform the activities at the 12th hour (one hour after). If we sum the activities of the user one hour before, one hour after and the unusual patterns hour (11th hour), so we get close to the same previous pattern. Therefore, the proposed approach cannot consider as compromised at the 11th hour of the target user. If the current user pattern was not matching with the cluster-users pattern (condition 1) and one hour before and after unusual pattern (condition 2) then our proposed approach is generating prudent prompt and mark the activities as compromised. This is shown in figure 8.
Figure 7. Both current-user and cluster-users patterns are similar, therefore, current user activities are considered as not compromised. Where the trend-line (gray color) is representing the cluster-user behavior.
Figure 8. The current day activities of the user Ui is a compromised one because it matches
neither with individual-level pattern (user trend) nor with the cluster-level pattern (cluster end). The x-axis represents the number of hours per week-day. While the y-axis represents the number of transactions performed by the Ui.
The same evaluation steps of the proposed approach were carried out for 100 users to detect and validate whether the user is compromise or non-compromise. Initially, we have discovered existing patterns of all the users and built the KBS through individual-level pattern information, and cluster-level pattern information. It is become part of the subject dataset and used for training set purpose. Then we observed the user behavior for the next 6 months and this dataset (next 6 month) used as a test set.
5.1. Performance evaluation metrics
In this study, state-of-the-art evaluation measures are used to evaluate the performance of the proposed models, including accuracy, precision, sensitivity, f-measure, and error rate. Additionally, we used prudence accuracy evaluation measure (PAEM) for evaluation of the prudence analysis system and the confusion matrix is used for evaluating the proposed model detection outcomes. Table 5 reflects the structure of confusion matrix [26], [27].
Table 5. The confusion matrix Detected O ri g in al C NC C tp fn NC fp tn
Accuracy: the accuracy measure is the ratio of the correct detection of the compromised users
and non-compromised users. It can be expressed as: Accuracy = tp+tn
tn+tp+fn+fp (1)
Sensitivity: the ratio of the correct detection of compromised users. It can be defined as:
Sensitivity = tp
tp+fn (2)
Specificity: the specificity is the ratio of the non-compromised users which are truly detected as
non-compromised. It is mathematically defined as: Specificity = tn
tn+fp (3)
F-measure: it is the weighted harmonic mean of both the precision and recall (sensitivity). It
reaches to its best value at one and worst at zero.
f — measure = 2 × RecaSS × Precicion
Precicion+RecaSS (4)
Precision: the precision measure is the number of the correct compromised users divided by the number
of the all compromised users. The formula is given below: Precision = tp
tp+fp (5)
Error rate: the error rate is referred to as the misclassification rate where the user is incorrectly classified
into the wrong class label to which the user does not belong. The error rate can be calculated as:
Error rate = (1— Accuracy) 100 (6)
5.1. Performance evaluation of the proposed approach
In order to evaluate the performance of the proposed approach, we have used table 5 (confusion matrix) and analyzed the behavior of 100 users during the period of the next 6 months. After analyzing the newly collected data of 100 users, there were total 90 non-compromised users and 10 were compromised. The compromised used were not met condition 1 and condition 2 (as discussed earlier in this section). The data which we were collected during the 6 months was used as the test set while the subject dataset (as
1—Pe
discussed in section 4.2) was used as a training set. Table 6 reflects the performance of the proposed approach in term of the evaluation measures (using equation 1, 2, 3, 4, 5, and 6).
Table 6. Performance of the proposed approach
Measures Results Accuracy 99 % Sensitivity 90 % Specificity 100 % Precision 100 % Error Rate 1 % F-Measure 94.74% PAEM 0.002
It observed from the results (table 6) that the proposed approach outperformed in term of obtained values of specificity and precision. The specificity value 100% is indicating that the proposed approach detected all the non-compromised users as non-compromised correctly. However, the accuracy of the proposed approach is not 100% because it has also produced an error rate of 1%. On the other hand, the sensitivity value is 90% which means 9 users correctly detected as compromised users out of 10 users. Therefore, the model produced 1% error rate, which means 1 user was actually compromised but the proposed model has considered as non-compromised. F-measure 94.74% shows the combination of precise regression measures and determines the overall performance of the classification system. It can be defined as the ratio between precision and recall measurements or the weighted average accuracy and recall rate
Further, we have also evaluated the prudence prompt accuracy using prudence accuracy evaluation measures (PAEM). The PAEM refers to such expected cases which are requiring prompt to be far less common as compared to the cases which do not require prompt. For detection system based on classification, it may also be worthwhile to evaluate the proposed model not just in term of the classification accuracy which is often criticized in literature but also relative to its classifier and prudence accuracy [28]. Therefore, the PAEM is applied to evaluate the effectiveness of the proposed prudence alert system. The default weighting for the PAEM is used in the mathematical formula as given below;
PAEM = 0.5
(cencitivity+cpecificity) (7)
The PAEM refers to such expected cases which are requiring prompt to be far less common as compared to the cases which do not require prompt. Therefore, the obtained value 0.002 of PAEM is showing the effectiveness of the proposed prudence alert method. Additional, Kappa statistics measures (k = Po–Pe) is
used for determining the consistency of the proposed model. It is more robust than sia mple percentage agreement [29]. The value 0.942 shows the near perfect agreement.
6. Conclusion
Organizations that adopt digital transformations are rewarded to improve their relationship with customers, attracts the best talent and set them up for success. However, due to these rewards, such organizations are undergoing and facing key concerns around risks of next-generation data security. Digitally transformed enterprises are greatly vulnerable to hackers and provide several types of lures to cyber-vandalism in particular the Compromise User Credential (CUC) problem. In order to handle CUC problem, this paper has presented a novel approach that efficiently detects CUC at both levels (individual and organizational) using a combined approach of individual-level and cluster-level or (organization- level). The proposed approach is also capable to generate a prudence alert; whenever a changed (new) behavior is observed which is beyond the competency of existing knowledge-based system (individual- level and cluster-level patterns information). The results show that the proposed approach has efficiently detected the CUC as with 99% overall accuracy and misclassification rate of 1%. It is also investigated that our approach fully detected correctly the non-compromised user with 100% performance and also produced promising performance in detecting compromised users; however, one (1) compromised user is incorrectly classified as non-compromised. Further, prudence system is validated through PAEM evaluation measures and obtained 0.002 which showing the effectiveness of the proposed prudence alert method.
In the future, we intend to further investigate some other conditions at individual-level and cluster- level that caused for 1% misclassification in the proposed approach. Because the proposed approach validate the user pattern based on the two conditions: (i) one hour before and one after the compromised user’s patterns at a specific hour of the week-day only, and (ii) check clusters-level users pattern whether it is also changed. Firstly, other than this two scenario might be of interest to organizations to discovered and incorporate in a future study. Finally, an extension of this work in term of producing a tool can be an alternate solution to easily detect CUC in I.T based organization.
Acknowledgments
The authors are grateful to the anonymous reviewers for their silent observation and suggestions, which helped increase the quality of this article.
References
[1] A. Majchrzak, M. L. Markus, and J. Wareham, “Designing for Digital Transformation: Lessons for Information Systems Research from the Study of ICT and Societal Challenges,” MIS Q., vol. 40, no. 2, pp. 267–277, 2016.
[2] E. Henriette, M. Feki, and I. Boughzala, “The Shape of Digital Transformation: A Systematic Literature Review,” in Mediterranean Conference on Information Systems
(MCIS), 2015, p. 14.
[3] Z. Yang, C. Wilson, X. Wang, T. Gao, B. Y. Zhao, and Y. Dai, “Uncovering Social Network Sybils in the Wild,” vol. 8, no. 1, 2011.
[4] M. Egele, C. Kruegel, and G. Vigna, “COMPA< : Detecting Compromised Accounts on
San Diego, CA United States., 2013, pp. 1–17.
[5] K. Singh and M. Cantt, “Outlier Detection< : Applications And Techniques,” Int. J.
Comput. Sci. Issues, vol. 9, no. 1, pp. 307–323, 2012.
[6] B. Viswanath et al., “Towards Detecting Anomalous User Behavior in Online Social Networks,” in Proceedings of the 23rd USENIX Security Symposium (USENIX Security), 2014, pp. 223–238.
[7] A. Daneshpazhouh and A. Sami, “Entropy-based outlier detection using semi-supervised approach with few positive examples,” Pattern Recognit. Lett., vol. 49, pp. 77–84, 2014. [8] A. Amin, B. Shah, S. Anwar, F. Al-Obeidat, and A. Asad Masood, Khattak Awais, “A
prudent based approach for compromised user credentials detection.,” Cluster Comput., pp. 1–19, 2017.
[9] A. Pecchia, A. Sharma, Z. Kalbarczyk, D. Cotroneo, and R. K. Iyer, “Identifying compromised users in shared computing infrastructures: A data-driven Bayesian network approach,” in Proceedings of the IEEE Symposium on Reliable Distributed Systems, 2011, pp. 127–136.
[10] M. Gupta, J. Gao, and C. C. Aggarwal, “Outlier Detection for Temporal Data< : A Survey,” IEEE Trans. Knowl. Data Eng., vol. 25, no. 1, pp. 1–20, 2014.
[11] M. Egele, G. Stringhini, C. Kruegel, and G. Vigna, “Towards Detecting Compromised Accounts on Social Networks,” IEEE Trans. Dependable Secur. Comput., p. 1, 2015. [12] K. Thomas, F. Li, C. Grier, and V. Paxson, “Consequences of Connectivity< :
Characterizing Account Hijacking on Twitter,” in In Proceedings of the 2014 ACM
SIGSAC Conference on Computer and Communications Security, 2014, pp. 489–500.
[13] Z. Xue, Y. Shang, and A. Feng, “Semi-supervised outlier detection based on fuzzy rough C-means clustering,” Math. Comput. Simul., vol. 80, no. 9, pp. 1911–1921, May 2010.
[14] V. Matta, M. Di Mauro, and M. Longo, “DDoS attacks with randomized traffic innovation: botnet identification challenges and strategies,” IEEE Trans. Inf. Forensics
Secur., pp. 1844–1859, 2017.
[15] X. Ruan, W. Wu, Z., and S. H., & Jajodia, “Profiling online social behaviors for compromised account detection,” IEEE Trans. Inf. forensics Secur., pp. 176–187, 2016. [16] Yang Zhang, Y. Z. Y. Zhang, N. Meratnia, P. Havinga, and Yang Zhang, “Outlier
Detection Techniques for Wireless Sensor Networks: A Survey,” IEEE Commun. Surv., vol. 12, no. 2, pp. 159–170, 2010.
[17] Zi Chu, S. Gianvecchio, H. Wang, and S. Jajodia, “Detecting Automation of Twitter Accounts: Are You a Human, Bot, or Cyborg?,” IEEE Trans. Dependable Secur.
Comput., p. Pages: 811-824, 2010.
[18] D. M. Hawkins, Hawkins, Douglas M. Identification of outliers. 1980.
[19] V. J. Hodge and J. Austin, “A Survey of Outlier Detection Methodologies,” Artif. Intell.
Rev., vol. 22, no. 2, pp. 85–126, Oct. 2004.
[20] N. Gupta, “A Study of Existing Cross Site Scripting Detection and Prevention Techniques in Web Applications,” Int. J. Eng. Comput. Sci., vol. 3, no. 9, pp. 8445–8450, 2014.
[21] K. Dasgupta et al., “Social ties and their relevance to churn in mobile telecom networks,” in Proceedings of the 11th international conference on Extending database technology:
Advances in database technology. ACM, 2008, pp. 668–677.
[22] L. Zhang, J. Zhu, and T. Yao, “An evaluation of statistical spam filtering techniques,”
ACM Trans. Asian Lang. Inf. Process., vol. 3, no. 4, pp. 243–269, Dec. 2004.
Knowledge Acquisition,” in University of Calgary, 1995, pp. 1–18.
[24] A. Amin, B. Shah, S. Anwar, F. Al-Obeidat, A. M. Khattak, and A. Adnan, “A prudent based approach for compromised user credentials detection,” Cluster Comput., 2017.
[25] A. Amin, S. Anwar, B. Shah, and A. M. Khattak, “Compromised user credentials detection using temporal features: A prudent based approach,” in ACM International
Conference Proceeding Series, 2017, vol. Part F1278.
[26] J. Bohacik and A. Fuchs, “Detecting Compromised Accounts on the Pokec Online Social Network,” in International Conference on Information and Digital Technologies (IDT), 2017, no. 64866, pp. 56–60.
[27] Adnan Amin et al., “Customer Churn Prediction in Telecommunication Sector using Rough Set Approach,” Neurocomputing, Press, vol. 4, pp. 1–18, 2016.
[28] O. Maruatona, P. Vamplew, R. Dazeley, and P. A, “Evaluating accuracy in prudence analysis for Cyber Security,” in International Conference on Neural Information
Processing, 2017, pp. 407–417.
[29] M. L. McHugh, “Interrater reliability: the kappa statistic,” Biochem Med, vol. 22, no. 3, p. 276–282., 2012.