DOCUMENTOS DE TRABALHO
WORKING PAPERS
ECONOMIA
ECONOMICS
Nº 05/2012
THE PRODUCTIVITY OF INNOVATION IN PORTUGAL
Nuno Araújo
Centro de Apoio Tecnológico à Indústria Metalomecânica
Leonardo Costa
1
The productivity of innovation in Portugal
Nuno Araújo – CATIM – Technological Center for the Metal Working Industry Leonardo Costa –Catholic University of Portugal at Porto
nuno.araujo@catim.pt lcosta@ucp.pt
Abstract: We view innovation as a productive process, with outputs and inputs. We aim at compare
the productivity of innovation across the twenty seven Member States of the European Union (EU-27), having a particular focus on Portugal. The data on inputs and outputs of innovation were collected from the Innovation Union Scoreboard 2010 report and covers the EU-27 Member States, from 2006 to 2010. The Total Factor Productivity index (TFP index) was used as the technique for data analysis. The choice of this technique was mainly determined by its flexibility and by data constraints. Two types of TFP indexes were computed: i) TFPt (time), which compares the productivity of innovation in each Member State with its productivity in a base year; ii) TFPs (space), which compares the productivity of innovation in each Member State with the productivity of the EU-27 average. Results show larger TFPs differences across Member States than TFPt differences. Concerning TFPt, there is a reduction of productivity of most of the Member States during the time length, which can be explained by the recent world financial crisis. This was the case of Portugal, where average TFPt in the time length is slightly below 1. The seven Member States that did not lose any productivity are mostly from Eastern Europe, Member Sates which have entered the European Union and accede to its structural funds more recently. Concerning TFPs, Portugal presents average TFPs well above 1. The Portuguese average TFPs value is close to the one of Germany and higher than the one of Sweden. The Innovation Union Scoreboard 2010 report classifies Portugal as Moderate innovator and Germany and Sweden as innovation leaders. We conclude that productivity of innovation in Portugal is similar to the one of Germany and higher than the one of Sweden. Differences between Portugal and those Member States, such as the ones reported in the Innovation Union Scoreboard 2010, can be explained by the fact of Portugal having fewer resources allocated to innovation and thus fewer outputs from innovation than Germany or Sweden have.
1. Introduction
The aim of this research is the phenomenon of innovation in the 27 European Union countries (EU-27). Innovation is seen as a production process, with inputs or innovation production factors and outputs or innovations resulting from this process.
The data used in our research are included in the Innovation Union Scoreboard 2010 study (UNUMERIT, 2011). This study was presented by the European Commission and compares the innovation performance of the EU-27 Member States, presenting inputs and outputs of innovation. It was intended in our research to deepen the idea implicit in this study, of dealing with innovation as a productive process, by calculating measures of relative productive efficiency for the various Member States of the EU-27, including Portugal.
The motivation of the study is connected to our route tracking processes of innovation in Portuguese Small and Medium Enterprises (SMEs). In the Portuguese business sector, SMEs represent 99.6% of the firms, create 75.2% of the jobs and generate 56.4% of the volume of national business” (Rocha, L.F.N. 2010). For lack of data in this area, this study has the Member States of the EU-27 as units of observation.
The investment in education, research, technology and innovation is seen as a key driver of growth. Innovative ideas can be converted into new marketable products and services that help to generate growth and quality jobs. The European Council called for the implementation of a strategy and integrated approach in order to foster innovation and take full advantage of the intellectual capital of Europe for the benefit of citizens, businesses (especially SMEs), and researchers. SME’s engage in innovation processes as a way to conquer competitive advantages, which allow them to cooperate in networks and/or compete for quality in niche markets.
The article is organized into four sections. After this introductory section, in section 2 we make a description of the productivity indicators used (TFP indexes), justifying their choice, as well as a description of the database used, inputs and outputs reported in the Innovation Union Scoreboard Study 2010. In section 3 we illustrate and discuss the results. Finally, in section 4 we present the conclusions.
2. Data and Methodology used
In this section we distinguish productivity and efficiency and describe the existing methodologies on productivity and efficiency analysis, justifying the use of the Total Factor Productivity index (TFP index) in the analysis performed. The TFP index is a measure of productivity. The section ends with a description of the empirical model, that is, the two types of TFP index computed and the database used.
2.1 Productivity and efficiency
The terms productivity and efficiency are sometimes used interchangeably. The concept of productivity was first used by the French economist Quesnay in 1766: "the quotient obtained by dividing production by one of the factors of it. As described, it is a concept of partial productivity. In this research we have multiple inputs and outputs and thus we use measures of total factor productivity (TFP indexes).
The notion of total factor productivity embraces the notion of technical efficiency of the observed units (that can be firms, countries, or other units). Technical inefficiency is measured as the distance between specific quantities of inputs or outputs and the amounts of inputs or outputs that define the efficient frontier (Caves et al. 1982; Fare et al. 1994). In other words, total factor productivity assumes the existence of technical efficiency (zero distance). However, in time, there may be progress in production technologies (change in the efficient frontier), which affects the total factor productivity
(Coelli et. al., 2005). In space, observed units may operate in different efficient frontiers and/or differ in total factor productivity.
2.2 Methods of analysis of productivity and efficiency
Figure 1 illustrates the existing techniques for analysing productivity and efficiency. The most often used techniques are indicated with shading in the table: Data Envelopment Analysis (DEA), Stochastic Frontier Analysis (SFA) and Total Factor Productivity (TFP).
Figure 1 - Techniques for analyzing productivity and efficiency
Source: Cullmann, A., A. Kappeler and C.v.Hirschhausen (2006)
The techniques for analyzing productivity and efficiency can be grouped in various ways (Coelli et al., 2005). Comparing the most used techniques:
a) The TFP index assumes the existence of technical efficiency. The same is not true for DEA and SFA.
b) The SFA involves the parametric estimation of functions. The same is not true for DEA and TFP index, which are non-parametric techniques.
c) DEA and SFA provide measures of relative efficiency among observed units. The TFP index provides measures of relative productivity among observed units.
The technique used in this research is the TFP index. The TFP index, computed for the EU-27 Member States, allows the comparison, in time, of the relative productivity for each Member State, and, in space, of the relative productivity across Member States. Next we describe the used technique and data.
Like DEA and as opposed to SFA, the TFP index is a non-parametric technique and thus more flexible in terms of assumptions. DEA requires, however, more information than the TFP index, particularly on prices. The choice of the TFP index as the technique of analysis in this research is justified by these two reasons.
In economics, index numbers are defined as real numbers that measure changes in a set of related variables. Index numbers are used to measure changes in either prices or quantities, in time and in space. As quantity indexes, they may be on inputs, on outputs, or relating both, inputs and outputs, the latter being the case of the TFP index (Coelli et al., 2005).
The TFP index was used in several empirical studies. For example, Hooper and Hensher (1997) used it to measure the performance of airports. Their study, based on information from six Australian airports in the period from 1989 to 1991, refers to the Tornqvist TFP index to compare the productivity of the same airport, during the time length, and among different airports, in a same period of time. Kulshreshtha and Parikh (2001) used the Tornqvist TFP index to measure productivity in the coal sector in India, from 1980 to 1992. Fuglie (2004) conducted a study on total factor productivity of agriculture in Indonesia, from 1961 to 2000. His study shows that the TFP index rose in the 1970s and 1980s and stagnated in the 1990s. It also shows that, without new efforts, the objective of Indonesia in using agriculture for rural development and poverty relief would be jeopardized. Oh et al. (2008) used the TPP index in the study of productivity growth of manufacturing industry in Korea, from 1993 to 2003. They show that the TFP index had a sharp decrease between 1998 and 1999 and a slight decrease between 2001 and 2002. The former was mainly caused by the Asian crisis. Although there is a higher growth since 2000, productivity growth in Korean manufacturing industry remains low.
Our choice of Laspeyres TFP index, instead of the Tornqvist TFP index or other most often used TFP indexes, relates to the price information available. The Laspeyres TFP index only requires base year prices.
The TFP index is a ratio between an output index and an input index:
(1) sv sv sv
Index
Input
Index
Output
TFP
.
.
s and v are two observations in time or in space. To compute the Laspeyres TFP index we first
calculate Laspeyres quantity indexes on input and output quantities:
(2)
M i i v i b i s i b L svq
p
q
p
q
1Again, s and v are two observations in time or in space. M is the number of inputs or outputs. Prices are base year prices that we assume as uniform and equal to 1.
To estimate the empirical model we used the database included in the study Innovation Union Scoreboard 2010 (UNU-MERIT, 2011). The sample has a total of 135 observations and covers the Member States of the EU-27, from 2006 to 2010. We estimate two types of TFP index that we designate by TFPt (time) and TFPs (space). To compute these TFP indexes we first calculate the corresponding output and input indexes.
Concerning the TFPt (time) index, for each year and Member State we calculate the ratio among the values of inputs in the year and the values of inputs in the base year. To get the output index, we use a similar procedure with outputs. We compute the TFPt index dividing the value of the output index by the value of the input index.
In what refers to the TFPs (space) index, we calculate the ratio of the values of the inputs of each Member State in each year with the average values of inputs of the EU-27 in the same year. We proceed similarly with the outputs. We compute the TFPs index dividing the value of the output index by the value of the input index.
In both cases, TFPt and TFPs, time averages are calculated for each Member State in the period under analysis.
We finish this section listing the inputs and outputs of innovation included in the mentioned database: a) I1 (Input 1) – Human resources;
b) I2 (Input 2) – Research systems; c) I3 (Input 3) – Finance and support; d) I4 (Input 4) – Firms’ investments; e) I5 (Input 5) – Links & entrepreneurship; f) I6 (Input 6) – Intellectual assets; g) O1 (Output 1) - Innovator firms; h) O2 (Output 2) – Economic effects;
Each of the above inputs and outputs results of the aggregation of several indicators. The reader is referred to Innovation Union Scoreboard 2010 report (UNU-MERIT, 2011) for more details.
3. Results
In this section we present three types of results:
a) A correlation matrix that illustrates the significant correlations between Member States time average inputs and outputs in the period from 2006 to 2010;
b) TFP indexes in time and space for each Member State;
c) The contrast of the results we obtained for Portugal with the country results in the Innovation Union Scoreboard 2010 report (UNU-MERIT, 2011).
3.1 Innovation as a productive correspondence
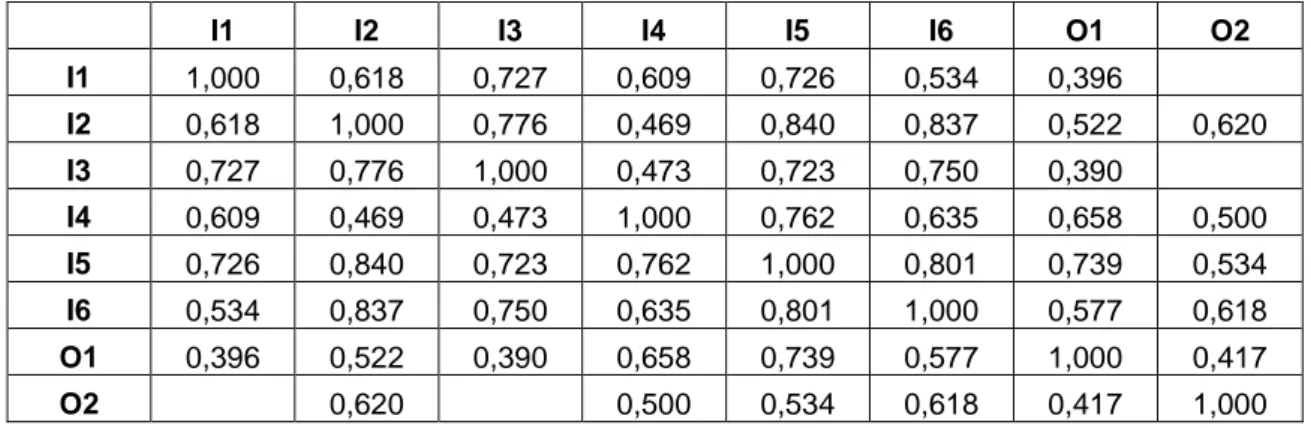
Table 1 below illustrates correlations between Member States time average inputs and outputs of innovation. Time average inputs and outputs were computed to ensure that there is no autocorrelation in the observations. All given correlations are significant at least at a level of significance of 5%.
Table 1: Correlations between Member States time average outputs and inputs of innovation
I1 I2 I3 I4 I5 I6 O1 O2 I1 1,000 0,618 0,727 0,609 0,726 0,534 0,396 I2 0,618 1,000 0,776 0,469 0,840 0,837 0,522 0,620 I3 0,727 0,776 1,000 0,473 0,723 0,750 0,390 I4 0,609 0,469 0,473 1,000 0,762 0,635 0,658 0,500 I5 0,726 0,840 0,723 0,762 1,000 0,801 0,739 0,534 I6 0,534 0,837 0,750 0,635 0,801 1,000 0,577 0,618 O1 0,396 0,522 0,390 0,658 0,739 0,577 1,000 0,417 O2 0,620 0,500 0,534 0,618 0,417 1,000
Source: Author’s estimation
Three results should be highlighted from the above table:
a) Inputs and outputs have positive and statistically significant correlations. More inputs generate more outputs. The correlation is not significant between O2 and I1 and between O2 and I3. Human resources do not seem to result in immediate economic results. Financing and support either. If a positive correlation exists between the variables in question it is not contemporaneous.
b) The two outputs have a significant and positive correlation. That is, Innovators firms and Economic effects are complements;
c) The six inputs of innovation considered have significant and positive correlations, that is, they are complements and not substitutes.
The above results support innovation as a productive correspondence between considered inputs and outputs. Next we present the TFP index results.
3.2 TFP indexes in time and space
TFP indexes are obtained according to two dimensions:
a) TFPt (in time), productivity of each Member State in each year is compared with productivity of the same Member State in the base year (2006);
b) TFPs (in space), productivity of each Member State in each year is compared with the productivity of EU-27 average in the same year.
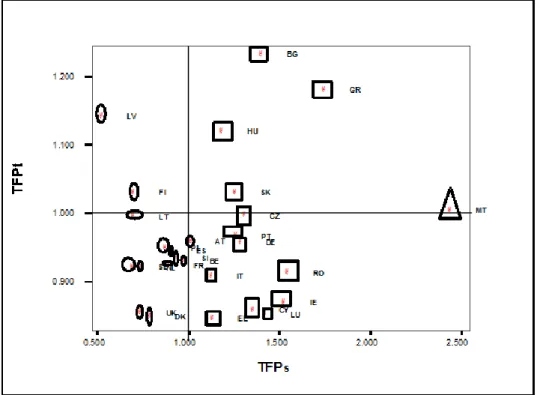
Table 2 and Figure 2 illustrate the average results for the period under analysis. Results are obtained for each EU-27 Member State in time (vertical axis) and in space (horizontal axis). Thus, each point of the figure corresponds to a coordinate (TFPt, TFPs) associated to a particular Member State of the EU-27. The circles, squares and triangles indicate the three groups of Member States that have resulted from a cluster analysis. The three groups of Member States distinguished along the TFPs axis.
Table 2: Time average TFPt and time average TFPs per Member State of the EU-27
Member State Abbreviation TFPt TFPs Belgium BE 0,929 0,998 Bulgaria BG 1,230 1,429 Czech Republic CZ 0,995 1,336 Denmark DK 0,846 0,815 Germany DE 0,955 1,311 Estonia EE 0,844 1,164 Ireland IE 0,867 1,553 Greece GR 1,179 1,776 Spain ES 0,942 0,929 France FR 0,921 0,913 Italy IT 0,907 1,156 Cyprus CY 0,856 1,385 Latvia LV 1,139 0,544 Lithuania LT 0,993 0,729 Luxembourg LU 0,849 1,450 Hungary HU 1,117 1,207 Malta MT 1,002 2,468 Netherlands NL 0,918 0,763 Austria AT 0,957 1,036 Poland PL 0,948 0,899 Portugal PT 0,964 1,289 Romania RO 0,911 1,573 Slovenia SI 0,932 0,960 Slovakia SK 1,028 1,281 Finland FI 1,028 0,729 Sweden SE 0,919 0,717 United Kingdom UK 0,852 0,764 Source: Author’s calculations
Figure 2: Time average TPFt and TFPs by Member State of the EU-27
Source: Table 2.
Two cross lines divide Figure 2 into four quadrants. Respectively, the lines indicate in the Figure values of TFPt = 1 and of TFPs = 1.
There are several results that derive from Table 2 and Figure 2:
a) 20 Member States of the EU-27 are in line TFPt = 1 or below. This means that, in time, these Member States have lost or maintained levels of productive efficiency that had in the base year of 2006. This is the Portuguese case. However, of the 20 Member States listed, in time, after Lithuania, Portugal is the Member State that has kept the best results in this TFPt indicator, presenting even higher performance than Germany.
b) The 7 Member States above the line TFPt = 1 are mainly Member States of the Eastern Enlargement of the EU. With the integration into the EU, these Member States have had a strong economic growth, foreign investment, EU funds, tax incentives, in addition to the existing high level of education and qualification of the population and to the low labour cost when compared to other EU-27 Member States. These factors can explain their results. c) The large differences across Member States are in space: i) 13 Member States have a TFPs
equal to or less than 1 (TFPs group average = 0.831); ii) 13 Member States have a TFPs higher than 1 (TFPs group average = 1.378) and iii) and Malta has a TFPs higher than 2 (TFPs = 2.468).
d) The 13 Member States with TFPs = 1 or lower have levels of innovation productivity equal to or lower than the EU-27 average. Most of Northern and Central Europe Member States are in this group. Several factors can explain these results: decreasing returns to scale in innovation, sectorial specialization in services, etc.
e) The 14 Member States with TFPs> 1 have levels of productivity in innovation above the EU-27 average. Southern Europe Member States as well as Member States like Germany are placed in this group. Malta, with a TFPs= 2.468 is a case apart. Portugal, with a TFPs = 1.289, is located near the industrial Germany, with a TFPs = 1.311, both Member States with a level of efficiency in innovation above the EU-27 average.
Next we confront the above TFPt and TFPs results obtained for Portugal with those listed in the Innovation Union Scoreboard 2010 report (UNU-MERIT, 2011).
3.3 - TFPt, TFPs and Innovation Union Scoreboard 2010 results for Portugal
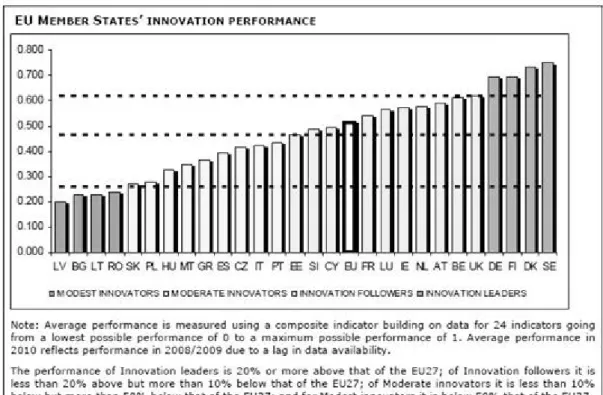
Figure 3 shows the innovation performance of the EU-27 Member States according to the Innovation Union Scoreboard 2010 report (UNU-MERIT, 2011). Portugal is below the mid-table, being classified as moderate innovator and leading this group.
Figure 3 - Innovation Performance of EU-27 Member States
Source : Innovation Union Scoreboard 2010 (UNU-MERIT, 2011, p.4)
The Innovation Union Scoreboard 2010 report (UNU-MERIT, 2011) calculates the innovation performance based on the combined amounts of inputs and outputs of each Member State in relation to the EU-27 average. For instance, ceteris paribus the amount of outputs, the innovation performance increases with the amount of inputs. We instead have computed productivity measures of conversion of innovation inputs into innovation outputs.
According to the Innovation Union Scoreboard 2010 report (UNU-MERIT, 2011), among other Member States Sweden and Germany are innovation leaders, with Sweden leading this group, while Portugal is a moderate innovator. Our TFPs results show Portugal as one of the more productive
Member States of the EU-27 in terms of innovation, with a performance close to the one of Germany and well above the one of Sweden, the latter with a productivity of innovation below the EU-27 average. These results can be understood in light of the ideas of Theodore Shultz (1964) on farmers of developing countries. Shultz supported that these farmers were efficient but poor. We support that Portugal is as much productive in innovation as Germany and more productive than Sweden but has less resources allocated to innovation than these two Member States.
4. Conclusions
In this research Innovation was treated as a productive correspondence between inputs and outputs of innovation. The data used were taken from the Innovation Union Scoreboard 2010 report (UNU-MERIT, 2011).
We found significant positive correlations between inputs and outputs of innovation, which supports innovation as a productive correspondence and the calculation of productivity measures.
Using the TFP index technique, two types of TFP indexes were computed: i) TFPt (time), which compares the productivity of innovation in each Member State with its productivity in a base year; ii) TFPs (space), which compares the productivity of innovation in each Member State with the productivity of the EU-27 average.
20 Member States of the EU-27 are placed in the TFPt = 1 line or below. This was the case of Portugal, where average TFPt in the time length is slightly below 1. The 7 Member States that are above this line are from Eastern Europe. These results can be explained by the financial crisis, by the EU structural funds, and by the highly qualified and cheaper labour force of Eastern Europe Member States.
The biggest differences in productivity of innovation across the EU-27 Member States are in space. 13 Member States have a TFPs = 1 or below. Most of these Member States are from Northern and Central Europe. Sweden is included in this group. These results can be explained by decreasing returns to scale in innovation, specialisation in services, and other reasons. The other 14 Member States show a TFPs > 1. Southern Europe Member States as well as Member States like Germany are placed in latter group.
Still concerning TFPs, the results for Portugal, Sweden, and Germany are interesting because of the differences in innovation investment. In comparison to Portugal, Sweden and Germany have more opportunities to innovate as far as inputs and outputs go. However, the productivity of innovation in Portugal is similar to the one of Germany and higher than the one of Sweden. This appears to be a Theodore Shultz (1964) type of case. Portugal is as productive in innovation as Germany and more productive than Sweden but has less resources allocated to innovation than these two Member States.
References
Araújo, N. (2011). Análise da Produtividade da Inovação em Portugal no Contexto da União
Europeia, Tese de Mestrado em Economia, Universidade Católica.
Caves D. W.; Christensen L. R.; Diewert W. E (1982). The economic theory of index numbers and the
measurement of input, output and productivity, Econometrica, vol. 50, n.6, p.1393–1414.
Coelli, T., Rao, D.S.P., O´Donnell, C., Battese, G.E (2005). An introduction to efficiency and
productivity analyses, 2.ª ed., USA: Springer.
Costa, L. (2009). “Animals' health control efficiency in Northwest Portugal”: A two-stage DEA
approach", proceedings of the 113th EAAE Seminar, A resilient European food industry and food chain in a challenging world, Chania, Crete, Greece, September 2009.
Cullmann, A., A. Kappeler and C.v.Hirschhausen (2006): “Introduction to Efficiency and Productivity
Färe, R., S. Grosskopf E C. A. K. Lovell (1994). Production Frontier, Cambridge: Cambridge University Press.
Fuglie, K. O. (2004). Productivity growth in Indonesian agriculture,1961–2000. Bulletin of Indonesian Economic Studies, 40:2, 209-225.
Hooper, P.G., Hensher, D.A. (1997). “Measuring Total Factor Productivity Of Airports” – An Index Number Approach, Transportation Research–E, vol. 33, n.º 4, pp. 249-259.
Kulshreshtha, M., and Parikh, J. K. (2001). A study of productivity in the Indian coal sector . Energy Policy, 29: 701-713.
Oh, I., Lee, J., Heshmati, A. (2008). Total Factor Productivity in Korean Manufacturing Industries. Global Economic Review, 37:1, 23-50.
Rocha, Luis Filipe do Nascimento. (2010). Nível de maturidade das PME: Melhores Práticas de
gestão no alinhamento estratégico dos SI/TI com o negócio, [On-line] http://hdl.handle.net/123456789/293
Shultz, T. W. (1964). Transforming Traditional Agriculture, Yale University Press
UNU-MERIT. (2011). Innovation Union Scoreboard 2010, The Innovation Union’s performance scoreboard for Research and Innovation, 1 February 2011. [On-line] Maastricht Economic and social Research and training centre on Innovation and Technology (UNU-MERIT) with the contribution of DG JRC G3 of the European Commission http://www.proinno-europe.eu/inno-metrics/page/innovation-union-scoreboard-2010, Junho 03.
Walter Eltis, "The Grand Tableau of François Quesnay's Economics," European Journal of the History