Thermoelectric Generator Using Water Gas Heater
Energy
for Battery Charging
José António Barros Vieira1, Alexandre Manuel Mota2
1Escola Superior de Tecnologia de Castelo Branco,
Departamento de Engenharia Electrotécnica, Av. Empresário, 6000 Castelo Branco, Portugal, Tel: +351 272 330300, Email: [email protected]
2Universidade de Aveiro, Departamento de Electrónica Telecomunicações e Informática, 3810 Aveiro, Portugal, Tel: +351 234
370383, Email: [email protected]
Abstract — This work deals with the design and a prototype implementation of a maximum power point tracker (MPPT) for a thermoelectric (TE) module aiming to improve energy conversion efficiency in battery charging. This system uses TE devices that directly convert heat energy from a water gas heater to electricity to charge a battery. The TE module exhibits a non-linear i-v characteristic and its maximum power point varies with the change of its surfaces temperatures. A SEPIC (single-ended primary inductance converter) DC–DC converter is applied and controlled by a microcontroller and to achieve the maximum power point tracking it is used the perturbation and observation (P&O) algorithm. The microcontroller will also control the charging process of lead-acid battery making an autonomous system that is used to feed the necessary electronics that controls an autonomous gas water heater system.
The objectives of this work are to study the principle of TE power generation and to design and develop a TE battery charger that uses heat of a water gas heater system making an autonomous electrical system. The two different charging stages of a lead-acid battery lead us to a good interface board. Finally, experimental results performance of the first stage of charge using P&O MPPT algorithm are presented and compared with the results achieved with the direct connection of the TE module to the battery.
I. INTRODUCTION
The need of electrical energy of the countries around the world is increasing everyday. The sources of traditional energy which consist of fossil fuels such as petroleum and coal being limited the increasing tendency of these energy sources to be consumed and the problem of world pollution enforce the development of power supply structures that are based mainly on renewable resources. Studies in the world of electrical energy production from thermoelectric modules have increased rapidly [1].
Thermoelectric modules can convert heat energy to electrical power directly. Thermoelectric power generation has the advantages of being maintenance free, silent in operation and involving no moving or complex parts. In the past years, much work has been reported on the TE power generator. Killander [2] developed a stove-top generator using two TE power modules, model HZ-20. During the operating time, the output of the generator was about 10W
and supplied the battery with a net input from 1 to 5 W. Rahman [3] developed the thermoelectric generator to supply portable electronic equipment or to charge a lap-top computer battery. The generator is powered from butane gas; it has a potential power output of about 13.5 W. Roth et al. [4] developed and tested a photovoltaic/thermoelectric hybrid system as a power supply for a mobile telephone repeater. The developed system supplies enough for 50 W permanent loads. All of the above research uses the converter to boost-up the output voltage to charge the battery but do not use the maximum power point tracking control in the system.
A TE is a non-linear power source, i.e. its output current/power depends on the terminal operating voltage and the maximum power generated by the system changes with variations of delta temperature (∆T=THOT-TCOLD),
temperature between the two sides of the TE module. To increase the ratio output power/cost of installation it is important that TE module operates in maximum output power (MPP).
This paper will aboard tree principal subjects: the TE module generator, the MPPT algorithms using a DC/DC converter and the lead-acid batteries charging process. This MPPT algorithm is integrated in one of the main stages of the charging process of lead-acid batteries making an autonomous system that will be used to feed the necessary electronics that controls an autonomous gas water heater system especially the ventilator of 20W of power. The P&O MPPT algorithm is used to control the maximum transfer power from the TE module. The Perturb and Observe MPPT algorithm was chosen, due to its simplicity, convergent capacities and to its low computational power needs [5], [6]. This algorithm is executed by a microcontroller using the TE voltage and current data to control the duty cycle of a pulse width modulation signal applied in to a DC/DC converter. The schematic and design of the DC/DC converter is explained. The DC/DC converter used is the SEPIC because it easily adapts any TE output voltage to any battery input voltage. This MPPT algorithm is used in one of the two main charging stages of a lead-acid battery. Finally, the two main charging stages of a lead-acid battery are presented and experimental results of the performance of the designed P&O
MPPT algorithm are presented and compared with the results achieved with the direct connection of the TE module to the battery.
This paper is divided in 8 sections, as follows: section 2 presents the TE general characteristics, section 3 presents the general construction and operation characteristics, section 4 presents the DC/DC SEPIC schematic and design, section 5 shows the perturbation and observation maximum power point tracking algorithm. Section 6 presents the algorithm proposed to the different stages of the lead-acid battery charging process, section 7 shows the implemented prototype board, section 8 discuss the experimental results of charging with the P&O MPPT algorithm and with out it ending with the conclusions presented in section 9.
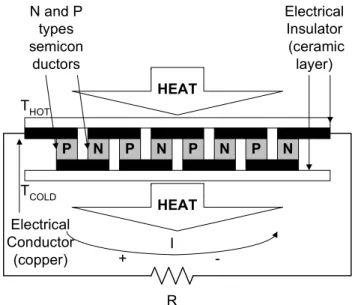
II. THERMOELECTRIC GENERAL CHARACTERISTICS The foundation of the thermoelectric generator (TEG) is based on the Seebeck effect which was discovered by Thomas Seebeck in 1821. Thermoelectric energy production which is one of the many processes of changing heat flow directly into electrical energy, promises a long life working without maintenance due to its reliability, silence, simplicity and the non-existence of moving parts. Thermoelectric modules are formed by P and N type semiconductors which are connected in series electrically and in parallel thermally among two ceramic layers. A TEG generator works by heating one face and cooling the other face of thermoelectric module and in the thermoelectric circuit it is connected a load. A TEG is shown in Figure 1 [7-9].
The TEG parts of the designed system consists of 3 parts; a heating block, a cooling block and a thermoelectric module arrangement. In the TEG, heat which is produced by the heating block is applied to the thermoelectric module face, and this heat gets sucked by the cooling block from the other side. This ensures the transfer of TEG heat. Aluminium blocks were used for the heating and cooling of the
thermoelectric module surfaces. In the system, a thermoelectric module arrangement was made by connecting n elements of thermoelectric modules. The TE module characteristics are presented in Table I.
Umax Imax Pmax Size (each)
16 V 6.5 A 29 W 2 x 3.5 x 3.5 cm Table I. -TE electric characteristics of the two TE modules connected in
series.
The TE module exhibits a non-linear i-v characteristic that depends of the hot and cold side temperatures of the blocks. The Figure 2 shows the power curve of the two TEGs connected in series where hot side surface temperature is about 180ºC and the cold side block temperature is about 50ºC.
In this temperature conditions the maximum power generated is about 28.5W with a Umpp=7.9V and Impp=3,7A.
From figure 2, it can be observe that the curve has a maximum power point (MPP), which is the optimal point for the efficient use of the TE and this point depends of the values of the temperature is the two sides of the module that also change during a water gas heater utilization. The main function of a MPPT is to adjust the TE output voltage to a value which the TE module supplies the maximum energy to the load.
III. GENERAL CONSTRUCTION AND OPERATION OF SYSTEM The TEs use the water gas heater energy to charge a battery that will be use to feed the electronics used to control the water gas heater system.
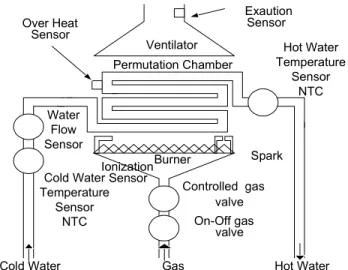
The water gas heater is physically composed by a gas burner, a permutation chamber, a ventilator, two gas valves and several sensors used for control and security as is shown on figure 3. The gas burner can burn natural or propane gas. This burner heats the copper permutation chamber where the cold water enters from bellow and circulates. The amount of power applied to the permutation chamber is controlled by one “proportional-type” gas valve driven by a pulse-width modulated signal. The cold and hot water temperature sensors are inexpensive negative coefficient resistors (NTC).
P N P N P N P N HEAT HEAT THOT TCOLD N and P types semicon ductors Electrical Insulator (ceramic layer) Electrical Conductor (copper) R + -I
Fig. 1. – Thermoelectric module in generator mode.
TEG Power Curve
0 5 10 15 20 25 30 0 1 2 3 4 5 6 7 I(A) U (V ) e P (W ) U (V) Power (W)
Fig. 2. -Non-linear i-v characteristic of the two TE modules connected in series.
The water flow sensor is an optical linear sensor. Overheat ionisation and ventilation sensors are all binary-type sensors.
The operating range of the hot water temperature is limited between 30ºC and 60ºC. Operating range of the cold water temperature is between 5ºC and 25ºC. The operating range of the water flow is between 3 and 15 litters/minute.
The TE modules are applied in the water gas heater permutation chamber as showed in figure 5, where the hot side (aluminium block) is in contact to the flame of the burn
gas and the cold side is connected to a copper block where hot water flows as illustrated in figure 4.
Then the electrical energy generated by the TE module is connected to a SEPIC that is controlled by a microcontroller which executes the MPPT and battery charging algorithms.
The used battery is a 12V and 20Ah because the TE modules can give about 28W and the Imax in battery will be P/U = 2.33A that is around the 10% of the 20Ah that is the maximum charging current.
IV. DC/DCSEPICCONVERTER
To implement the MPPT algorithm it is used the SEPIC. This DC/DC converter is in an increasingly popular topology, particularly in battery powered applications, as the input voltage can be higher or lower than the output voltage which presents obvious design advantages. In this work, for implementation of maximum power point tracker, a SEPIC working in continuous conduction mode is used as the power-processing unit. Switch N channel mosfet M1 the PWM is
controlled with a switching frequency of 125kHz. The power flow is controlled by adjusting the on/off duty ratio of the switch M1. Figure 6 shows the schematic of the DC/DC
converter implemented.
Fig. 5. - Photo of the MPPT and battery charger prototype board.
Burner Permutation Chamber Hot Water Temperature Sensor NTC Over Heat Sensor Spark Ventilator Exaution Sensor Water Flow Sensor Ionization Sensor On-Off gas valve Controlled gas valve Gas
Cold Water Hot Water
Cold Water Temperature
Sensor NTC
Fig. 3. - Schematic of water gas heater with its sensors and actuators.
Using a TE module with the following characteristics: maximum power Pmax=30 W, maximum voltage Vmpp=7.5 V,
maximum current Impp=4 A, the DC/DC design starts with the
selection of the two separate inductors L1 and L2. For a
general working point with: Input voltage (Vin = VTE) – 8.0V;
Output (Vout & Iout) – 12V, 2.5A;
Switching frequency (Fs) – 125kHz; Expected efficiency - 90%
As it was projected in our previous work [6] the values for the two inductors are L1 = 120µH L2 = 120µH.
Finally, the SEPIC components used are: L1 = 120µH L2 =
120µH with Isat = 6.0A, C1 = 470 µF, C2 = 470µF, C3 =
470µF, M1 of Imax = 7.0A and a shotkhy diode D1 of Imax
7.0A.
V. THE P&OMAXIMUM POWER POINT TRACKING ALGORITHM
The P&O is one of the so called ‘hill-climbing’ methods, which are based on the fact that in case of the V-P characteristic, on the left side of the hill of the MPP the variation of the power against voltage dP/dV > 0, while at the right, dP/dV <0 [10].
If the operating voltage of the TE module is perturbed in a given direction and dP/dV > 0, it is known that the perturbation moved the panel's operating point toward the MPP. The P&O algorithm would then continue to perturb the TE module voltage in the same direction. If dP/dV < 0, then the change in operating point moved the TE module away from the MPP, and the P&O algorithm reverses the direction of the perturbation [11]. The main advantage of the P&O method is that it is easy to implement, and its low computational demand. However, it has some limitations, like oscillations around the MPP in steady state operation, slow response speed, and tracking in wrong way under rapidly changing in delta temperatures [11][12][13].
To reduce the presented limitations it will be useful to use a small sampling rate. In this work it was used a sampling rate of 100 ms.
Using the SEPIC with current and voltage resistance sensors illustrated in figure 7, the P&O MPPT algorithm was implemented. The MPPT algorithm needs only the TE voltage and current information, and the battery voltage and current information will be needed for the battery charging process.
Where R0=R5=0.005Ω and VR0 VR5 are the amplified
voltages used to read input and output currents. R1=R3=910kΩ R2=R4=150kΩ are used to read input and
output voltages.
The flow chart of the P&O MPPT implemented algorithm is illustrated in figure 8.
The parameter K is the step given to the duty cycle of the PWM signal. This parameter can vary depending of the working point of the DC/DC converter, linear or non linear region.
The MPPT control circuit is implemented in a microcontroller ATTINY861V, that has ten 10-bits analog-to-digital (A/D) converters and two fast PWM mode signals. The control circuit compares the TE output power before and after a change in the duty ratio of the DC/DC converter. It is expected that the MPP presents a constant oscillation inherent to the algorithm.
VI. BATTERY CHARGING ALGORITHM
The complete battery charging demands to the controller a complex control strategy, in witch it would be possible to charge the battery, between its limits, in the faster possible Fig. 8. - P&O MPPT algorithm (PWM used to define the duty cycle of the PWM signal).
Fig. 7. - Voltage and current sensors for MPPT and battery charging algorithms.
way thus working period of energy generation of the TE module is limited [14].
To achieve a fast, safe and complete battery lead-acid charging process, some of the manufacturers recommend dividing the charging process in four stages that are designated by: (i) trickle charge, (ii) bulk charge, (iii) over charge and (iv) float charge [15] and [16].
In this work there were made some simplifications in the implementation of the four different charging stages of a lead-acid battery. The 1º stage was not implemented because the discharge battery with this prototype board does not pass below VFLOAT (minimum lowest security voltage specified by
the battery manufacturers). The applied load is disconnected from the battery by the control algorithm avoid reaching critical discharge. The value of VFLOAT depends or is a
function of the battery temperature.
The 4º stage was not implemented but the 3º stage is continued until the charge current reach ISTEADY (near to zero
current) and finally the charging process is ended. When the TE module has energy to delivery and the battery voltage is below the VOC the control algorithm executes the 2º stage.
The battery charging implemented algorithm can be seen in figure 9. Where Vb and Ib are the battery voltage an delivered
current and Tb is the battery temperature. The maximum
value of the VOC depends of the battery temperature. From
figure 8 it is clear that only the 2º and the 3º stages are implemented from the four stages proposed in [15] and [16].
VII.IMPLEMENTED PROTOTYPE BOARD
The implemented prototype board is illustrated in figure 10. It can be seen the TE module connection in the right side of the photo and in the left side the connection to the battery and to the load. The latest described charging process of lead-acid batteries is executed with the MPPT algorithm. This board was developed for feeding the electronics used to control a water gas heater.
VIII. P&OMPPT EXPERIMENTAL RESULTS
The experimental results of battery charging are divided in two separated tests. The tests used a TE module with Pmpp=28.5W, Vmpp=7.9V, Impp=3.7A, and a lead-acid battery
with V = 12V and Imax = 20.0Ah. First, the TE module is
connected directly to the battery and, second, the TE module is connected to the battery using the developed prototype board running the MPPT algorithm.
The results are illustrated in figure 11, first test, and figure 12, second test. On each figure it is illustrated one test where the water flow of 16l/min is open and the water gas heater is working for about 800 second. The first chart of the figures 11 and 12 presents the first 450 seconds of the test and second chart presents the last 450 seconds of the test. This way it is possible to see clearly the initial and the final phases of the transferred power.
From first test it can be seen that charging the 12V battery with the direct connection of the TE module to the battery the absorbed power from the TE module is around 19.0W.
From second test it can be seen that charging the 12V battery with the P&O algorithm the absorbed power from the TE module is around 28.5W.
The experimental setup with the MPPT has provided always more delivered energy to the battery than the direct connection. The MPPT increased this TE module capacity of supply energy in 34% using a 12V.
Fig. 10. - Photo of the MPPT and battery charger prototype board.
Fig. 9. - Battery charging algorithm with two main stages (bulk charge and over charge) (PWM used to define the duty cycle of the PWM signal).
IX. CONCLUSIONS
This work presented a prototype board based in a small microcontroller that controls the lead acid battery charging process and the correct used of the lead-acid battery. The control algorithm executes the P&O maximum power point tracking function allowing the transfer of maximum energy generated by TE module to the battery. This P&O algorithm increase the efficiency power transference in 34% in comparison to direct connection of the TE and battery. The
used of the SEPIC has some advantages because it easily adapts any TE module characteristics output voltage to any battery input voltage.
This interface board assures the fast, safe and complete battery lead-acid charging process and also monitor its discharge. This board makes an electrical autonomous water gas heater control system free from 220V ac.
In future work the placement of the TEG in the will be changed using only waste energy that escape from the system. The right place is in the exhaustion channel using the heat of the exhaustion air (waste energy).
REFERENCES
[1] A.G. McNaughton, “Commercially Available Generators”, CRC Handbook of Thermoelectrics, Chap. 36, CRC Pres. Inc, USA, 1995. [2] Anders Killander, John C Bass, “A stove-top generator for cold areas”,
Proceedings of the IEEE 15th international conference on thermoelectrics, pp. 390–3, 1996.
[3] Mahmudur R, Roger S. “Thermoelectric power-generation for battery charging”, Proceedings of the IEEE conference on energy management and power delivery, vol. 1,.pp. 186–91, 1995.
[4] Roth W, et al. “Grid-independent power-supply for repeaters in mobile radio networks using photovoltaic/thermoelectric hybrid systems”, Proceedings of the 16th international conference on thermoelectrics, pp. 582–5, 1997.
[5] D. Sera, T. Kerekes, R. Teodorescu, and F. Blaabjerg, Aalborg “Improved MPPT method for rapidly changing environmental conditions”, IEEE International Symposium on Industrial Electronics, vol. 2, pp 1420–1425, 9-13 July 2006.
[6] J. Vieira, A. Mota – “Maximum Power Point Tracker Applied in Batteries Charging with PV Panels”, Proceedings of the International Symposium Industrial Electronics, Oxford, Inglaterra, 29 a 01 Julho 2008.
[7] S.B. Riffat, X. Ma, “Thermoelectrics: a review of present and potential applications”, Applied Thermal Engineering, Vol. 23, no: 8, pp. 913– 935.
[8] G. Min, D.M. Rowe, “Peltier devices as generators”, CRC Handbook of thermoelectrics, Chap. 38, CRC Press. Inc, London, 1995.
[9] E.J. Burke, R.J. Buist, “Thermoelectric coolers as power generators”, 18th Intersociety Energy.
[10] X. Weidong, W.G. Dunford, “A modified adaptive hill climbing MPPT method for photovoltaic power systems” Power Electronics Specialists Conference PESC 04, vol. 3, 20-25, pp 1957–1963, June 2004. [11] D.P Hohm, M. E. Ropp, “Comparative Study of Maximum Power Point
Tracking Algorithms Using an Experimental, Programmable, Maximum Power Point Tracking Test Bed”, Photovoltaic Specialists Conference, 2000. Conference Record of the Twenty-Eighth IEEE, pp 1699 – 1702, 15-22 Sept. 2000.
[12] N. Femia, G. Petrone, G. Spagnuolo and M. Vitelli: “Optimizing sampling rate of P&O MPPT technique” Power Electronics Specialists Conference, PESC04, vol. 3, pp 1945-1949, 20-25 June 2004. [13] A. Brambilla, M. Gambarara, A.Garutti and F. Ronchi: “New approach
to photovoltaic arrays maximum power point tracking”. Power Electronics Specialists Conference, PESC 99, vol. 2, pp 632–637, 27 June-1 July 1999.
[14] M. A. E. Galdino, C. M. Ribeiro, “A Intelligent Battery Charge Controller for Small Scale PV panel”, 12th European Photovoltaic Solar Energy Conference and Exhibition, 1994.
[15] K. Hesse, An off-line lead -acid charger based on the UC3909, Technical report, Unitrod Company, 1997.
[16] R. H. Rosemback, Conversor CC-CC Bidirecional Buck-Boost atuando como Controlador de Carga de Baterias em um Sistema Fotovoltaico, Mater of Science Thesis in Electrical Engineering, University Federal de Juiz de Fora, 2004. TEG Results 0.00 5.00 10.00 15.00 20.00 25.00 30.00 1 19 37 55 73 91 109 127 145 163 181 199 217 235 253 271 289 307 325 343 361 379 397 415 433 Time (Seconds) U in ( V ) U o u t (V ) Ii n /4 (A ) H 2 O ( l/ m ) P o w e r o f 2 T E G S E R IE ( W )
Uout Uin Ini Pin H2O
TEG Results 0.00 5.00 10.00 15.00 20.00 25.00 30.00 1 19 37 55 73 91 109 127 145 163 181 199 217 235 253 271 289 307 325 343 361 379 397 415 433 Time (Seconds) U in ( V ) U o u t (V ) Ii n /4 (A ) H 2 O ( l/ m ) P o w e r o f 2 T E G S E R IE ( W )
Uout Uin Ini Pin H2O
Fig. 12. - Experimental results of the TE module connected to the proposed interface MPP board.
TEG Results 0.00 2.00 4.00 6.00 8.00 10.00 12.00 14.00 16.00 18.00 20.00 1 20 39 58 77 96 115 134 153 172 191 210 229 248 267 286 305 324 343 362 381 400 419 438 Time (Seconds) U in ( V ) U o u t (V ) Ii n /10 (A ) H 2O ( l/ m ) P o w e r o f 2T E G S E R IE ( W )
Uout Uin Ini Pin H2O
TEG Results 0.00 2.00 4.00 6.00 8.00 10.00 12.00 14.00 16.00 18.00 20.00 1 19 3755 7391 109 127 145 163 181 199 217 235 253 271 289 307 325 343 361 379 397 415 433 Time (Seconds) U in ( V ) U o u t (V ) Ii n /1 0 (A ) H 2 O ( l/ m ) P o w e r o f 2 T E G S E R IE ( W )
Uout Uin Ini Pin H2O
Fig. 11. - Experimental results of the TE module connected directly to the battery.