i
Digitization of the manufacturing sector across
the EU: assessing readiness for Industry 4.0
Maria Isabel Cabral de Abreu Castelo Branco
Dissertation presented as a partial requirement to obtaining
the Master’s degree in Information Management
ii
NOVA Information Management School
Instituto Superior de Estatística e Gestão de Informação
Universidade Nova de Lisboa
DIGITIZATION OF THE MANUFACTURING SECTOR ACROSS THE EU:
ASSESSING READINESS FOR INDUSTRY 4.0
by
Maria Isabel Cabral de Abreu Castelo Branco
Dissertation presented as a partial requirement to obtaining the Master’s degree in Information Management in 20 July 2018
Coorientadores: Professor Tiago Oliveira and Professor Frederico Cruz Jesus
iii
ABSTRACT
Industry 4.0 is a concept that represents the adoption by industrial companies of techniques
and processes allowed by digitization, cloud computing, the internet of things and big data to
gain competitive advantages in domestic and global markets. Measuring how the
manufacturing sector is adopting Industry 4.0 is challenging, given that there is not a closed
definition of the term and that the collection of information is not specifically directed to
Industry 4.0 concepts. Recognizing these difficulties, the present study measures the presence
of the factors that characterize Industry 4.0 across EU countries. The analysis provides
evidence that the existence of a digital infrastructure combined with the analytical capabilities
to deal with big data emerge as the two dimensions that show the readiness for Industry 4.0
in each country. At EU level, five homogeneous groups of countries were found, showing large
disparities across countries. The implementation of the single digital market strategy with
regard to the manufacturing sector demands the collection of more detailed information on
Industry 4.0.
KEYWORDS:
iv
TABLE OF CONTENTS
1.
Introduction ... 1
2.
Theoretical Background ... 3
3.
Measuring Industry 4.0 ... 6
4.
Methodology ... 10
4.1.
Data ... 10
4.2.
Factor Analysis ... 12
4.3.
Cluster Analysis ... 15
5.
Discussion ... 17
5.1. Findings ... 17
5.2. Limitations ... 18
6.
Conclusions ... 20
7.
References ... 21
Appendix ... 25
v
LIST OF TABLES
Table 1 - Variables ...8
Table 2 - Values ...11
Table 3 - Correlations ...13
Table 4 - Factor loadings ...14
LIST OF FIGURES
Figure 1 - Factors by contry ...15
Figure 2 - Clusters ...16
Figure A1 - Scree plot Ward's Method……….. 25
1
1. Introduction
The digital transformation has been affecting business models, productive processes and corporate governance. The improvements in information and communication technologies (ICT) infrastructure and in analytical capabilities during the past decade have fueled a stream of innovation at all levels of the business models and corporate organization and the ability of a company to master them has become an element of competitive advantage in almost all the economic sectors (Bleicher & Stanley, 2016; Grover & Kohli, 2013). However, the scope of the digital transformation is very broad and the extent to which it happens is the result of the combination of several elements: the enterprise’s information systems (IT) resources (Ashrafi & Mueller, 2015), the industry environment (Mithas, Tafti, & Mitchell, 2013) and public policies (GTAI, 2013).
The possibilities offered by the growing use of digitization in the corporate world are changing companies’ competitive positions, how they interact with their employees and customers (Dery, Sebastian, & van der Meulen, 2017) and how they position themselves in the market, offering products and services that are apparently outside their original business model but that are possible because of the way that model has been adapting itself to digitization (Dongback, 2017). The rapid pace of technological improvements is creating the need for rapid adaptation and the most innovative companies have been the ones that were able to recognize early how new digital tools affect their business models and what value they can extract from the information generated by their activity (OECD, 2017a). The combination of technologies made possible by digitization like big data, cloud computing and internet of things enable the use of other technologies by the manufacturing sector, like additive manufacturing (3-D printing), autonomous machines and services and human-machine integration, which tend to have a positive impact in productivity (OECD, 2017b).
Within the various dimensions of the digital transformation, one has been gathering the attention of policymakers, academics and managers: the possibilities that arise from the application of digitization to manufacturing processes, what is now being commonly called Industry 4.0 (Smit, Kreutzer, Moeller, & Carlberg, 2016). The term Industry 4.0 is becoming widely used to describe the concept of the digital factory: all-automated manufacturing processes, eventually integrated in a supply chain, where human intervention is reduced to the minimum indispensable (Hofmann & Rüsch, 2017; Smit et al., 2016). Even if it is a rather recent concept (born in 2011) (Qin, Liu, & Grosvenor, 2016), there are a growing number of academic studies and conference papers covering it. However, the data available on the digitization of production processes is still sparse, even if it is evolving rapidly. Within the Strategy for the Single Digital Market (European Commission, 2015b) the European Commission (EC) has been working of the identification and gathering of data that allows for the measurement and characterization of the digital society (European Commission, 2015c), including data related with the digitization of productive processes, but no studies were presented, yet, that allow for an horizontal view on the degree of development of Industry 4.0 across the European Union (EU). There is, therefore, a gap in the literature in this area that the present study tries to fill, even if partially, by answering to the following research questions:
Q1: In what dimensions can the emergence of Industry 4.0 be perceived across European Union (EU) countries?
2 Q2: How do EU countries differ among themselves in what concerns Industry 4.0 dimensions?
In answering to these questions, the present study is organized as follows: section 2 provides the background of Industry 4.0, its definition and context and presents a review of the literature on Industry 4.0 and its components; section 3 discusses the nature and rationale of the variables that have been used to measure the degree of implementation of Industry 4.0; section 4 establishes the methodology and presents quantitative information; section 5 discusses the results, implications and limitations of the study and finally, section 6 presents the conclusion.
3
2. Theoretical Background
Industry 4.0 (or Industrie 4.0 in the original German) is a concept that emerged for the first time in 2011 with the objective of characterizing highly digitized manufacturing processes where information flows among machines in a controlled environment so that human intervention is reduced to a minimum (Qin et al., 2016). The concept was generated and developed by German Industrial and Academic communities with the support of the German Government with the intention of framing and developing the country’s industrial competencies that have been powered by digitization of the production processes in several industrial sectors (Kagerman, Wahlster, & Helbig, 2013)). Its name arises from the recognition that the inclusion of cyber-physical systems in production processes is changing the whole production and business paradigm, marking the advent of the fourth industrial revolution (Qin et al., 2016). As such, Industry 4.0 is an outcome not fully completed, yet, of the fourth industrial revolution, similarly to other periods in history where the introduction of structural changes in production processes potentiated disruptive innovations and paradigm changes that had strong impacts in productivity and eventually created the conditions for new business models. Within this rationale, the first industrial revolution was marked by the mechanization of processes, the second by the introduction of electrically-powered mass production based on the division of labor and the third by the automation of certain processes through the incorporation of electronics and computer power (Kagerman et al., 2013; Qin et al., 2016).
From its initial German origins, as a label aimed at addressing strategic German industrial policy (Kagerman et al., 2013), the term Industry 4.0 is being used beyond German industry as a synonym of self-sufficient manufacturing processes made possible by the ability of machines and devices to communicate with each other through digital interconnectivity along the value chain (Smit et al., 2016). Beyond its original meaning, however, the term “Industry 4.0” also embodies a wider concept of an Industrial Revolution in the making (Hermann, Pentek, & Otto, 2016) as, even if all the technological developments allowed by the digitization of production processes are not ready for widespread use yet, it is already possible to understand some of the possibilities allowed by the adoption of the technologies associated to it in advance (Brettel, Friederichsen, Keller, & Rosenberg, 2014). Other concepts like “smart factory” (Brettel et al., 2014), “industrial internet of things” (Boyes, Hallaq, Cunningham, & Watson, 2018), or simply “industrial internet” (Agarwal & Brem, 2015) encompass similar meanings. The Industry 4.0 concept, however, embraces the vertical and horizontal integration in the wider industry environment where a factory is part of a larger ecosystem composed of several pieces (Hofmann & Rüsch, 2017). Furthermore, Industry 4.0 as the easily recognizable expression it is, facilitates communication on innovation and modernization among several possible players: policymakers, enterprises and academia (Reischauer, 2018). It also facilitates the communication of public policies and the recognition by industry itself, namely the less sophisticated small and medium sized enterprises (SME), that changes are occurring with potential implications on their competitive landscape (Smit et al., 2016).
The published literature on Industry 4.0 is becoming extensive and diversified. The fact that the concept relies on constantly evolving high-tech developments whose full implications are not widely tested, offers a wide field of analysis for universities, consultants, and public bodies (Hermann et al.,
4 2016; Mckinsey Digital, 2016; PwC, 2016; Smit et al., 2016). The different perspectives of these several stakeholders also explain the existence of the wide range of academic studies that cover specific aspects of implementation, like the treatment of information (Santos et al., 2017) or the implementation of cyber physical systems (Morgan & O’Donnell, 2015; Mosterman & Zander, 2016) or pre-identified dimensions of the subject, like logistics (Hofmann & Rüsch, 2017), using specific practical cases and collecting the practical experience of experts from the industrial community (Hermann et al., 2016; Moeuf, Pellerin, Lamouri, Tamayo-Giraldo, & Barbaray, 2017). The number of academic publications is rising rapidly (Chiarello, Trivelli, Bonaccorsi, & Fantoni, 2018).
Despite the diversity of approaches to addressing the subject, a clearly established consistent definition of what Industry 4.0 is, is difficult to find (Brettel et al., 2014; Hermann et al., 2016). The 2013 Acatech report (Kagerman et al., 2013) discusses the drivers, the outcomes, the benefits, and the necessary conditions but it does not propose a closed definition. Brettel et al. (2014) recover the themes launched by the Acatech report, namely individualized production, horizontal integration in collaborative networks and end-to-end digital integration, each theme embracing several sub topics on production and production processes, supply chain, collaborative networks and engineering and production systems. Other authors propose to define the elements that characterize Industry 4.0 from its “components” or enablers, like the internet of things, big data or cyber-physical systems: Hermann et al. (2016) have defined several design principles, broken down into several dimensions: technical assistance (virtual and physical), interconnection (collaboration, standards and security), decentralized Decisions and information transparency (data analytics and information provision). Smit et al. (2016) present the features of Industry 4.0 as the technical requirements that support the “organization of production processes based on technology and devices autonomously communicating with each other along the value chain”: interoperability, virtualization, decentralization, real-time capabilities, service orientation and modularity. Qin et al. (2016) propose an architecture for the implementation of Industry 4.0 that implies five levels, each level depending on the cyber-physical attributes in place: connection level (hardware connection), conversion level (information discovery), cyber level (automated system), cognition level (predictive maintenance,) and configuration level (intelligent production).
The differences in approaches and the fact that several aspects related to Industry 4.0 are not yet fully available for widespread use (OECD, 2017b), make it particularly difficult to measure its implementation. A parallel can be drawn, however, between the study of the differences among countries or economic sectors on the development of Industry 4.0 and the study of the digital divide. The digital divide commonly refers to the gap of access to digitization among individuals, companies and/or countries. In 2001, a report from the OECD (2001) introduced the term as “the gap between individuals, households, businesses, and geographic areas at different socio-economic levels with regard to both their opportunities to access information and communication technologies (ICTs) and to their use of the Internet for a wide variety of activities”. Initially, the digital divide referred to the “separation between those who have access to ICT and those who do not” (Dewan & Riggins, 2005), and efforts have been made to measure it among representative society groups, like the elderly (Niehaves & Plattfaut, 2013) or the socio-economically disadvantaged (Po, Hsieh, Rai, & Keil, 2008).
5 Lately, several studies have looked at the digital divide among countries or regions, relating it to the respective economic development (Cruz-Jesus, Oliveira, & Bacao, 2012; Cruz-Jesus, Oliveira, Bacao, & Irani, 2016; Vicente & López, 2011).
Cross-country comparison studies have tended to measure ICT adoption and usage by all society agents: households, companies, and governments. Although the corporate sector ends up being covered as a part of the broader society, specific studies on the digital gap of the corporate sector across countries, namely studies that consider how companies apply different ICT tools in their businesses are difficult to find. In fact, the known experiences of some companies (El Sawy, Amsinck, Kræmmergaard, & Vinther, 2016) show that the process of digitizing corporate activity is a complex, multidimensional process that involves governance, management, infrastructure, technologies and analytical capabilities. The comparison of the implications of digitization in some known practical cases shows that the reality of each entity is the result of the combination of different sets of circumstances and variables that should have explanatory power in one case should not necessarily have it in others (Bleicher & Stanley, 2016). Narrowing down the analysis from the full effects of digitization in a company to the specific impacts on the manufacturing activity does not eliminate the need to take several dimensions into account, most of them complex, but it facilitates the emergence of concepts with homogeneous and objective meanings, independently of the circumstances each company or country face.
6
3. Measuring Industry 4.0
In the process of literature review for the present study, no quantitative analysis was found that would allow understanding to what extent Industry 4.0 is being adopted across countries or industrial sectors. There may be two reasons for this: the difficulty in establishing what the exact dimensions that characterize the term Industry 4.0 are, and the lack of quantitative information on those dimensions. In fact, it is easily recognizable that the pace of development and adoption of new technologies and practices related to their implementation is not necessarily compatible with the rhythm of establishment of consistent statistics that in turn require surveys focused on specific subjects and including the adequate questions.
Some studies have presented extensive and systematic reviews of published literature, based on searches of words or expressions associated with the concept of industry 4.0 (Hermann et al., 2016; Moeuf et al., 2017; Oesterreich & Teuteberg, 2016). Case studies and expert interviews have also been used to get insights on practical issues related to concepts and implementation (Brettel et al., 2014; Hermann et al., 2016; Santos et al., 2017). Academic works have presented prototypes that include cyber-physical devices built to test collaborative techniques (Mosterman & Zander, 2016; Wang, Wan, Zhang, Li, & Zhang, 2016)
The most extensive quantitative reliable and consistent information on ICT usage by companies, individuals and governments can be found on the databases of the OECD and the EC. The surveys that are conducted periodically by these entities enquire about habits, practices, constraints, expectations, and intentions related to ICT usage with the intention of gathering information that allows for the characterization of the degree of adoption across time and countries. This study used EC data. The EC has been investing in the collection of relevant data and information as part of the digital single market strategy, for more than a decade. Aiming to “provide better access for consumers and businesses to digital goods and services across Europe, creating the right conditions and a level playing field for digital networks and innovative services to flourish and maximizing the growth potential of the digital economy” (European Commission, 2015a). Within this context it has been working to improve the quality and quantity of information in the area of the digital economy, with the objective of monitoring the production of digital technologies and how these technologies are influencing businesses and individuals. A framework that systematizes the main data required to understand and monitor the digital economy has been developed (European Commission, 2015c). Sources of data include Eurostat surveys, data supplied by the National Regulatory Authorities for the telecommunications market, periodic studies from the EC and ad hoc surveys on specific uses (European Commission, 2015c). These developments can be found in the evolution of data published by Eurostat: although Eurostat collects data on ICT usage by enterprises in several dimensions for several years, it has recently broadened the scope of the questionnaires along the dimensions that the EC established to monitor the digital economy and society (European Commission, 2015c). The scope and depth of the data Eurostat is presently collecting covers dimensions that were not covered in the past, like big data, cloud computing and the scope of IT function. Themes like the electronic share of
7 management information with suppliers or customers, security, scope of ICT function, and contracted internet speed are part of the information collected (Eurostat, 2017a).
For the objectives of the present study, the Eurostat database was searched for the variables that would better represent the concepts associated by literature to Industry 4.0. These variables are part of the data collected on ICT usage and e-commerce in enterprises, as well as big data analysis. The universe corresponds to manufacturing companies with 10 or more employees.
Interconnection or interconnectivity, defined as wireless communication across a network that includes people, machines, and sensors or other mobile end devices is one of the prerequisites of Industry 4.0 (Hermann et al., 2016; Kagerman et al., 2013). The percentage of enterprises that have provided a positive answer to the question on mobile connection to the internet for business use to use dedicated business software applications expresses the degree of interconnectivity through portable devices (smartphones, tablets, notebooks) that are connected to the internet through a mobile network specifically applied to business software and sponsored by the enterprise for the use of its employees (Eurostat, 2017b). It also enables the possibility of decentralized decisions (Hermann et al., 2016; Smit et al., 2016). The application of the functionalities associated with the internet of things requires this type of interconnectivity. The variable that represents the percentage of manufacturing companies for which the maximum contracted download speed of the fastest fixed internet connection of at least 100 Mb/s was also included as it indicates the need to deal with large volumes of data on a high-speed infrastructure, which in turn is compatible with an intensive use of the internet of things and a strong need for interconnection.
Another element of Industry 4.0 present in literature is interoperability which means the ability of systems to connect and work in a coordinated and self-sufficient way. Interoperability can be seen from the perspective of cyber-physical systems (machines, assembly lines) (Smit et al., 2016) or a broader perspective of production networks either regarding vertical or horizontal integration (Brettel et al., 2014). Following this rationale, the variable enterprises who have ERP (Enterprise Resource Planning) software packages to share information between different functional areas has been included in the study as a measure of the ability of enterprises to share information internally in an electronic format and build integrated business processes. Additionally, and following the Hofmann & Rüsch (2017) study on the implications of Industry 4.0 for logistics, the variable enterprises whose business processes are automatically linked to those of their suppliers and/or customers addresses the percentage of enterprises sharing electronic information across the supply chain. Consequently, expressing the degree of integration between manufacturing units and their suppliers / distributors; this same element has been measured by its negative side: enterprises sending only paper invoices B2BG (Business to Business and Government) indicating a total lack of presence of Industry 4.0. The quantity of information generated in Industry 4.0 by the digitally integrated production and supply processes combined with the need to process real time information require virtualization as a way to ensure information processing and storage capabilities (Brettel et al., 2014; Hermann et al., 2016; Moeuf et al., 2017; Smit et al., 2016). Virtualization will have to support complex processes. Therefore, the variable buy high CC (Cloud Computing) services (accounting software applications, CRM – Customer Relationship Management - software, computing power) has been considered too as it
8 represents the percentage of companies that are supporting at least a part of their core activity on the most sophisticated cloud computing services available, which may include Infrastructure as a Service (IaaS) or Platform as a Service (PaaS) (Pedone & Mezgár, 2018; Wang, Zhang, Liu, Li, & Tang, 2017). Under the same rationale, the theme big data has also been included, as it accounts for the need for information transparency (Hermann et al., 2016) necessary in production processes where machines and devices communicate (Santos et al., 2017; Wang et al., 2016): enterprises analyzing big data from any data source, although representing a potentially larger set than Industry 4.0 adopters, was included as an indication of each country adoption of big data. The scope of the usage was however narrowed by considering two variables that should be closely related to Industry 4.0: the percentage of enterprises that analyze own big data from enterprise's smart devices or sensors and analyze own big data from geolocation of portable devices.
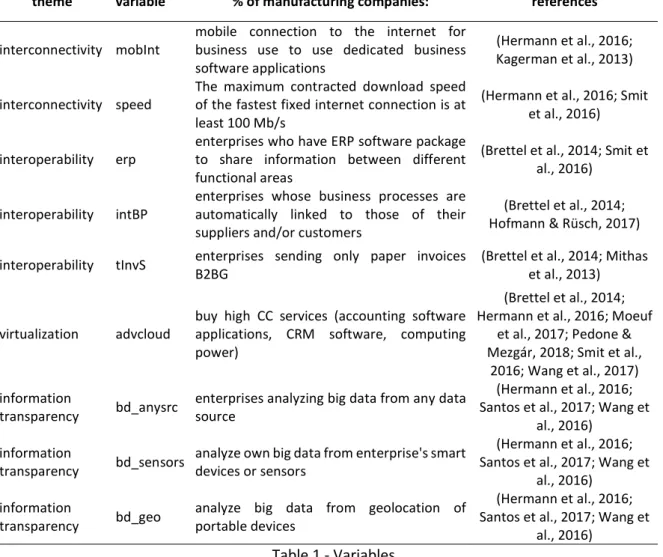
The following table summarizes the variables and their meaning:
theme variable % of manufacturing companies: references
interconnectivity mobInt mobile connection to the internet for business use to use dedicated business software applications
(Hermann et al., 2016; Kagerman et al., 2013) interconnectivity speed The maximum contracted download speed of the fastest fixed internet connection is at
least 100 Mb/s
(Hermann et al., 2016; Smit et al., 2016)
interoperability erp enterprises who have ERP software package to share information between different functional areas
(Brettel et al., 2014; Smit et al., 2016)
interoperability intBP enterprises whose business processes are automatically linked to those of their suppliers and/or customers
(Brettel et al., 2014; Hofmann & Rüsch, 2017)
interoperability tInvS enterprises sending only paper invoices B2BG (Brettel et al., 2014; Mithas et al., 2013)
virtualization advcloud buy high CC services (accounting software applications, CRM software, computing power)
(Brettel et al., 2014; Hermann et al., 2016; Moeuf
et al., 2017; Pedone & Mezgár, 2018; Smit et al.,
2016; Wang et al., 2017) information
transparency bd_anysrc enterprises analyzing big data from any data source
(Hermann et al., 2016; Santos et al., 2017; Wang et
al., 2016) information
transparency bd_sensors analyze own big data from enterprise's smart devices or sensors
(Hermann et al., 2016; Santos et al., 2017; Wang et
al., 2016) information
transparency bd_geo analyze big data from geolocation of portable devices
(Hermann et al., 2016; Santos et al., 2017; Wang et
al., 2016) Table 1 - Variables
The final choice of variables reflects therefore, the result of a judgement supported by the literature concepts that characterize Industry 4.0. The objective was, using the available information, to identify
9 a set of variables that, when present at the same time, should be a good indication of the presence or at least of the ability to adopt Industry 4.0 for any given country.
The final choice of variables reflects therefore, the result of a judgment supported by the literature concepts that characterize Industry 4.0. The objective was, using the available information, to identify a set of variables that, when present at the same time, should be a good indication of the presence or at least of the ability to adopt Industry 4.0 for any given country.
10
4. Methodology
4.1. Data
Data collected from the Eurostat database is the outcome of the answers to the questionnaire ICT usage and e-commerce in enterprises (Eurostat, 2017a) and refers solely to enterprises from the manufacturing sector, according to the statistical classification of economic activities in the European Community, (NACE - Nomenclature statistique des Activités économiques dans la Communauté Européenne., Rev.2) with 10 or more employees. The unit measure is the percentage of these enterprises that acknowledged the presence of the element. For all variables used there was information available for 2016 except for enterprises who have ERP software package to share information between different functional areas (erp) and enterprises whose business processes are automatically linked to those of their suppliers and/or customers (intBP), where available data corresponds to 2015. Where a specific variable was missing for a country, a proxy was determined through a hierarchical cluster analysis: in that way, Poland’s information was used to fill Bulgaria’s missing information on buy high CC services (accounting software applications, CRM software, computing power) (advcloud) and on analyze big data from geolocation of portable devices (bd_geo) and Croatia’s missing information on enterprises who have ERP software package to share information between different functional areas (erpP) and Germany’s missing value on buy high CC services (accounting software applications, CRM software, computing power) (advcloud) was replaced by Croatia’s. For countries where information was missing in more than two variables, no replacements were done. As a consequence, there is no information for Belgium for any of the variables and information on big data usage is missing for Ireland, Greece, Cyprus, Latvia, and Austria. These six countries were, therefore, excluded from the analysis.
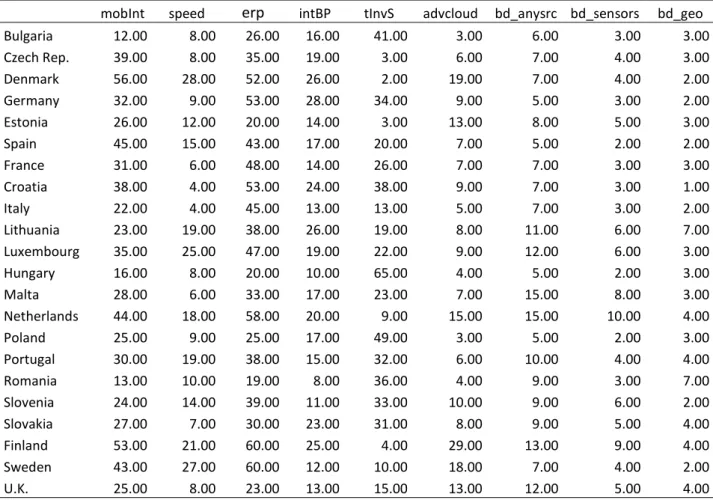
11 The final set of information is presented in Table 2:
mobInt speed erp intBP tInvS advcloud bd_anysrc bd_sensors bd_geo
Bulgaria 12.00 8.00 26.00 16.00 41.00 3.00 6.00 3.00 3.00 Czech Rep. 39.00 8.00 35.00 19.00 3.00 6.00 7.00 4.00 3.00 Denmark 56.00 28.00 52.00 26.00 2.00 19.00 7.00 4.00 2.00 Germany 32.00 9.00 53.00 28.00 34.00 9.00 5.00 3.00 2.00 Estonia 26.00 12.00 20.00 14.00 3.00 13.00 8.00 5.00 3.00 Spain 45.00 15.00 43.00 17.00 20.00 7.00 5.00 2.00 2.00 France 31.00 6.00 48.00 14.00 26.00 7.00 7.00 3.00 3.00 Croatia 38.00 4.00 53.00 24.00 38.00 9.00 7.00 3.00 1.00 Italy 22.00 4.00 45.00 13.00 13.00 5.00 7.00 3.00 2.00 Lithuania 23.00 19.00 38.00 26.00 19.00 8.00 11.00 6.00 7.00 Luxembourg 35.00 25.00 47.00 19.00 22.00 9.00 12.00 6.00 3.00 Hungary 16.00 8.00 20.00 10.00 65.00 4.00 5.00 2.00 3.00 Malta 28.00 6.00 33.00 17.00 23.00 7.00 15.00 8.00 3.00 Netherlands 44.00 18.00 58.00 20.00 9.00 15.00 15.00 10.00 4.00 Poland 25.00 9.00 25.00 17.00 49.00 3.00 5.00 2.00 3.00 Portugal 30.00 19.00 38.00 15.00 32.00 6.00 10.00 4.00 4.00 Romania 13.00 10.00 19.00 8.00 36.00 4.00 9.00 3.00 7.00 Slovenia 24.00 14.00 39.00 11.00 33.00 10.00 9.00 6.00 2.00 Slovakia 27.00 7.00 30.00 23.00 31.00 8.00 9.00 5.00 4.00 Finland 53.00 21.00 60.00 25.00 4.00 29.00 13.00 9.00 4.00 Sweden 43.00 27.00 60.00 12.00 10.00 18.00 7.00 4.00 2.00 U.K. 25.00 8.00 23.00 13.00 15.00 13.00 12.00 5.00 4.00
Notes: mobInt- mobile connection to the internet for business use to use dedicated business software applications; speed-
the maximum contracted download speed of the fastest fixed internet connection is at least 100 Mb/s; erp- enterprises who have ERP software package to share information between different functional areas; intBP- enterprises whose business processes are automatically linked to those of their suppliers and/or customers; tInvS- enterprises sending only paper invoices B2BG; advcloud- buy high CC services (accounting software applications, CRM software, computing power); bd_anysrc-enterprises analyzing big data from any data source; bd_sensors- analyze own big data from enterprise's smart devices or sensors; bd_geo- analyze big data from geolocation of portable devices
Table 2 - Values
The large dispersion of data should not be a surprise: in Bulgaria, only 12% of manufacturing enterprises have mobile access to the internet for business purposes, while that percentage is 56% in Denmark. In more than half of the countries, less than 10% of manufacturing enterprises have a contracted download speed higher than 100 Mb but Denmark, Sweden, Finland and Luxembourg present levels above 20%. Also, most of the countries show a low percentage of high CC services. As for ERP usage, percentages tend to be higher, ranging from a minimum of 11% in Latvia to a maximum of 60% in Finland and Sweden, with seven countries presenting more than 50%. As for the variables related to big data, the use of this type of analytics tends to be low (less than 10%) among manufacturing companies and, while there are some countries where more than 10% (but less than 20%) of enterprises work with Big Data from any source. Only the Netherlands shows a 10% use of big data collected from smart devices, all the other countries showing less than 10% of manufacturers working with this technique for information collected either from mobile or geolocation devices.
12
4.2. Factor Analysis
Factor analysis was used to measure the presence of Industry 4.0 given that, through linear combinations of variables, it allows the identification of relationships among them. These relationships, if they exist, make it possible to extract trends that, in turn, allow for the recognition of patterns. If the variables are correlated, that correlation may indicate the presence of at least one common pattern, a latent dimension that will ultimately explain the variables themselves.
The quality of the information that can be derived from the factor analysis will depend on the existing correlation structure among the set of data, and some specific steps are required to determine its possibilities: in the first place, the correlation among the variables must be calculated, and a correlation matrix is built. If correlation is high, it means that the chosen variables are measuring the same phenomena; a low correlation between two variables suggests that other elements explain their behavior. In the second step a suitability test is performed, one of the most common ones for this kind of analysis being the Kaiser-Mayer-Olkin test. If suitability is confirmed, the third step will be to apply the factor analysis, for which several factors will have to be defined, ensuring that they retain a large percentage of the variance of the overall data. Factors will then have to be interpreted under the light of the context being studied from the variables that most contribute to them. If representative, factors will reveal latent dimensions that are not possible to capture directly just from the simple variable analysis.
Once the factors for each country are determined, it is possible to plot the results over a two-dimensional graph, and if it is possible to devise homogenous groups of countries, establish clusters. The cluster analysis is useful to quantify and characterize which dimensions better explain the differences among countries, even if it does not provide an explanation by itself. By understanding the clusters, however, it is possible to derive common explanations based on the understanding of the context in each country.
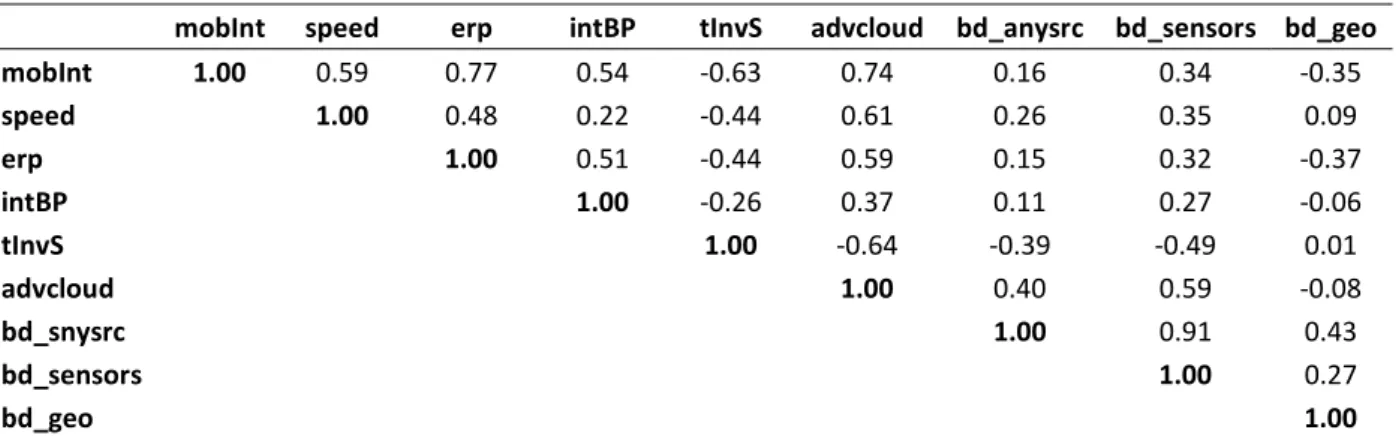
13 Following this methodology, in the first step, correlations were calculated for all two pairs of variables, the results shown in Table 3:
mobInt speed erp intBP tInvS advcloud bd_anysrc bd_sensors bd_geo
mobInt 1.00 0.59 0.77 0.54 -0.63 0.74 0.16 0.34 -0.35 speed 1.00 0.48 0.22 -0.44 0.61 0.26 0.35 0.09 erp 1.00 0.51 -0.44 0.59 0.15 0.32 -0.37 intBP 1.00 -0.26 0.37 0.11 0.27 -0.06 tInvS 1.00 -0.64 -0.39 -0.49 0.01 advcloud 1.00 0.40 0.59 -0.08 bd_snysrc 1.00 0.91 0.43 bd_sensors 1.00 0.27 bd_geo 1.00
Notes: mobInt- mobile connection to the internet for business use to use dedicated business software applications; speed-
the maximum contracted download speed of the fastest fixed internet connection is at least 100 Mb/s; erp- enterprises who have ERP software package to share information between different functional areas; intBP- enterprises whose business processes are automatically linked to those of their suppliers and/or customers; tInvS- enterprises sending only paper invoices B2BG; advcloud- buy high CC services (accounting software applications, CRM software, computing power); bd_anysrc-enterprises analyzing big data from any data source; bd_sensors- analyze own big data from enterprise's smart devices or sensors; bd_geo- analyze big data from geolocation of portable devices
Table 3 - Correlations
Within the first six variables (mobint, speed, erp, intBP tlnvS and advcloud), each one presents a correlation of at least 0.51 with another, a not very high value but admissible to indicate the possibility of a common explanatory power. As it should be expected, there is a negative correlation between the variable tlnvS (enterprises that only produce paper invoices) and all the others. MobInt shows a consistently higher level of correlation with the others from this set (minimum correlation of 0.59) than any of the others. Within this set of variables, there are not correlation levels over 0.8, which suggests some independence among variables. As for the variables related to big data, these show a low correlation with the variables from the first sub set: cloud services has a correlation of 0.59 with big data from smart devices but correlations between big data variables and the rest are equal or below 0.4. There is a high correlation (0.91) between the percentage of manufacturing companies that analyze big data from any source and the ones that do it from the enterprise smart devices or sensors, suggesting that smart devices or sensors are a major source of information for big data analysis. Correlation is lower (0.43) between the percentage of manufacturing enterprises that analyze big data form any source and those that report doing it from geolocation of portable devices. Also, correlation between bd_smart and bd_geo is low (0.27).
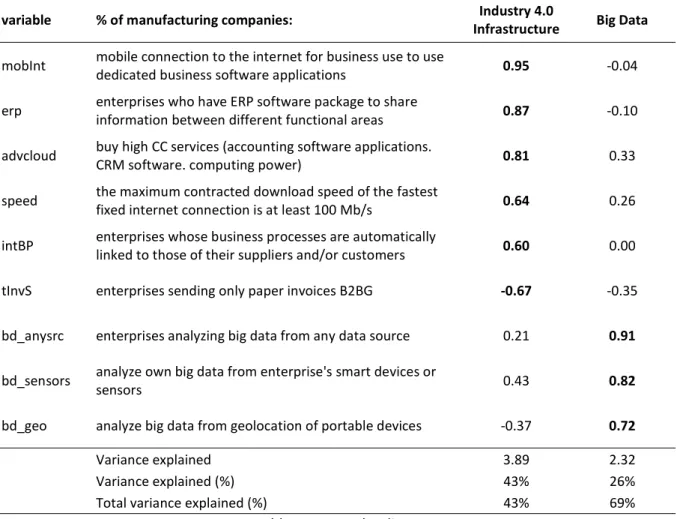
After having the correlation matrix, a principal component analysis was applied. The scree plot and the Kaiser method (Peres-Neto, Jackson, & Somers, 2005) pointed out two factors. The application of the Kayser-Mayer-Olkin test for sampling adequacy revealed a value of 0.70, not very high but within the limit of adequacy.
Finally, taking into consideration the contribution of each variable to the two factors considered, two dimensions were proposed: the first one was called Industry 4.0 Infrastructure and refers to the combination of interconnectivity, interoperability, and virtualization that should form the
14 infrastructure of Industry 4.0; since none of the variables was collected with the specific purpose of measuring Industry 4.0, it is their combination and simultaneous occurrence that indicates the possibility of the presence or the readiness, the ability to develop, Industry 4.0. The second dimension was called Big Data and expresses the ability to process the information generated by the Industry 4.0 infrastructure (information transparency).
variable % of manufacturing companies: InfrastructureIndustry 4.0 Big Data
mobInt mobile connection to the internet for business use to use dedicated business software applications 0.95 -0.04
erp enterprises who have ERP software package to share information between different functional areas 0.87 -0.10
advcloud buy high CC services (accounting software applications. CRM software. computing power) 0.81 0.33
speed the maximum contracted download speed of the fastest fixed internet connection is at least 100 Mb/s 0.64 0.26
intBP enterprises whose business processes are automatically linked to those of their suppliers and/or customers 0.60 0.00
tInvS enterprises sending only paper invoices B2BG -0.67 -0.35
bd_anysrc enterprises analyzing big data from any data source 0.21 0.91
bd_sensors analyze own big data from enterprise's smart devices or sensors 0.43 0.82
bd_geo analyze big data from geolocation of portable devices -0.37 0.72
Variance explained 3.89 2.32
Variance explained (%) 43% 26%
Total variance explained (%) 43% 69%
Table 4 - Factor loadings
The two dimensions combined explain 69% of total variance, a value high enough to be possible to attribute explanatory power to them.
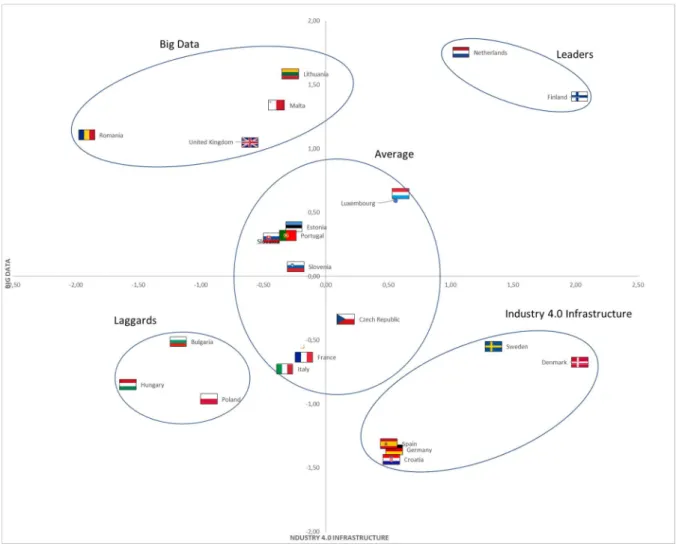
The factor scores for each country are presented in Figure 1. The horizontal axis represents the first factor, Industry 4.0 Infrastructure, and the vertical axis represents the second factor, Big Data. Countries that fall on the right of the vertical axis show a higher than average Industry 4.0 Infrastructure whereas countries placed over the horizontal axis show a higher than average ability to treat information from Big Data.
15 Figure 1 - Factors by contry
4.3. Cluster Analysis
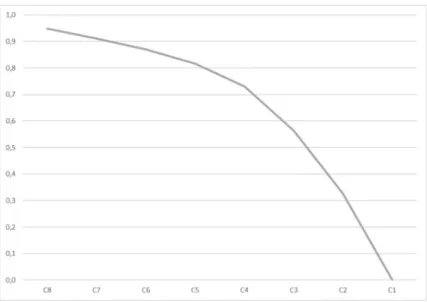
Cluster analysis was applied over the countries plotted within the two dimensions to determine homogeneous groups in respect to the factors being considered. As there was no intention to predefine the number of clusters, a hierarchical methodology was first conducted. Single, Complete, Average, Centroid and Ward’s algorithms were applied to measure the distance between every pair of observations (and clusters) to build homogeneous groups. For defining the initial number of clusters in every method, the R-Squaredand the dendrogram were assessed computed and evaluated. This analysis showed that Complete and Ward’s methods were the ones that obtained better results. Ward’s was finally the chosen method as it showed higher levels of R-Squaredacross all the clusters’ possibilities (please see Figure A1), with the choice of five clusters (please see Figure A2). The centroids of each of the five clusters generated by Ward’s method were subsequently used as initial seeds in a non-hierarchical method, in this case, k-means. This methodological option tends to yield the best results (Cruz-Jesus et al., 2012; Sharma, 1996). The output of this approach and the rebuild (i.e., optimized in what the explained variance is concerned) the five clusters of countries in the two dimensions found. Within each cluster, countries tend to be homogenous in each factor – Industry 4.0 Infrastructure or Big Data –, which allows for a characterization of the clusters based on the preponderance of the dimensions.
16 Figure 2 helps to visualize better how countries are grouped within the clusters. Finland and the Netherlands, being the countries where Industry 4.0 Infrastructure and Big Data simultaneously show a larger positive deviation from the average, form the cluster which was called “Leaders.” A second cluster includes Croatia, Spain, Germany, Sweden, and Denmark all of them with a relatively high level of Industry 4.0 Infrastructure but low level of Big Data. Within this cluster, Denmark and Sweden deviate considerably from the other three countries in the levels of both factors indicating a higher propensity to reach the first quadrant. Overall, the cluster was called “Industry 4.0 Infrastructure.” Romania, the United Kingdom, Malta and Lithuania form a third cluster where the Big Data factor is higher than the average, but the Industry 4.0 Infrastructure stands below average, with Romania showing a significantly lower level of Industry 4.0 Infrastructure than the other three countries. This is the “Big Data” cluster. The fourth cluster includes Hungary, Poland and Bulgaria, three countries that stand below the average in both factors. These were called the “Laggards.” Finally, all the other countries – Luxembourg, Czech Republic, Estonia, Portugal, Slovakia, Slovenia, France, and Italy - integrate the fifth cluster, where both factor levels are near the average of the whole group. All the quadrants are represented in this cluster, which was denominated “Average.”
17
5. Discussion
5.1. Findings
The two dimensions that seem to explain the preponderance of Industry 4.0 across countries point to two basic elements associated to how digitization affects innovation in the context of manufacturing firms: (i) Industry 4.0 Infrastructure and (ii) Big Data. The first dimension stands for an infrastructure that goes beyond the classical concepts of hardware and cables to encompass the information, communication and connectivity technologies that, under the digital paradigm, are changing the way companies develop their business strategies (Bharadwaj, El Sawy, Pavlou, & Venkatraman, 2013). As for the second dimension, Big Data, it deals with the capacity to process the information generated by the infrastructure. The ability to extract the data and interpret the information originated during the manufacturing processes and/or the supply chain processes has a large value added as it increases predictive power and facilitates error management (Santos et al., 2017; Wang et al., 2016). The emergence of these two dimensions provides a clear answer to the first research question stated above: there is strong evidence for the theoretical construction of Industry 4.0 as a combination of networks and platforms that can sustain production and supply chain processes and the ability of treating the data produced by those devices in order to make processes more efficient. The system characteristics of interconnectivity, interoperability, and virtualization allow for the generation and storage of large quantities of granular data produced at several stages of the processes and through several devices. The treatment of that data under big data techniques, transforms it into valuable information. Industry 4.0 stands therefore as a combination of infrastructure and the ability to deal with information that infrastructure produces: these elements cannot be considered separately, as it is the possibility of their convergence that produces all the benefits associated from the digitization of the processes (Agarwal & Brem, 2015).
A country that shows a high value of Industry 4.0 Infrastructure has a manufacturing sector where a high percentage of enterprises combine the use of the communication network (given by the mobile access to internet and its speed) and the platforms and machines connected through it (the existence of ERP, recourse to advanced cloud computing and supply chain process connection). A high value of Big Data in a particular country shows the existence of analytical capabilities in its manufacturing sector. The simultaneous presence of both elements allows the possibility of interconnectivity, interoperability, virtualization, and information transparency, all elements that should be present in Industry 4.0. A high level of both dimensions does not indicate the existence of Industry 4.0 within a country per se, but it should at least point to its possibility.
Regarding the second question, evidence shows large disparities across European countries, which should not come as a surprise. Not only is the topic new, and governments and companies are adapting to it, but it is also developing quite fast, demanding a large quantity of attention and the flexibility to adopt new technologies, and eventually, change manufacturing and or supply/chain processes. These differences can be easily observed in Figure 1.
18 In general terms, Scandinavian countries show a high level of adoption both in Industry 4.0 Infrastructure and Big Data, even if this level of adoption is not homogenous among them: Finland stands as a Leader and Denmark and Sweden, although included in the Industry 4.0 Infrastructure set, present higher values in both dimensions than their cluster peers. The Netherlands and Luxembourg are the two countries, together with Finland, where both Industry 4.0 Infrastructure and Big Data are higher than the average. In fact, past studies showed that, at the European Union level, these countries have been in the forefront in closing the digital divide gap (Cruz-Jesus et al., 2012; Vicente & López, 2011) which should indicate a strong propensity, also from the corporate sector, to adopt solutions oriented to higher digitization which, in turn, is a necessary condition for the existence of Industry 4.0. As for the other countries, the very broad meaning of the digital divide theme does not allow for any type of analogy, given the specificities of the Industry 4.0 concept. With regard to Germany, where the concept was originated, data suggests further developments are needed regarding big data analytics usage by the manufacturing sector, to reach the EU average in this dimension. On the other hand, it seems that German industry is adapting with regard to Industry 4.0 Infrastructure as it stands above the average in this indicator. This is consistent with recent OECD data (OECD, 2017b). Surprisingly, France and Italy, two of the largest EU economies show lower than average values in both dimensions. Moreover, the UK, although well placed in terms of Big Data, stands considerably below the average in what concerns Industry 4.0 Infrastructure.
The cluster analysis meant to finding profiles of behavior among countries with respect to Industry 4.0 showed five profiles with meaningful differences regarding Industry 4.0 adoption (please see Figure 2). The dispersion of results is visible also within the clusters: with the exception of the “Leaders” and the “Laggards”– aggregating two and three countries respectively, the other three clusters present one or more countries that show some distance from the core.
Several explanations could be offered for the disparities among the larger EU economies. The structure of each country’s industrial sector could be a source of differences, as Industry 4.0 concepts seem to be better adapted to some types of production processes more than others. However, several other aspects may be considered as barriers to ICT interoperability and standards, shortage of experts with the necessary skills and public policies that could be more efficient in diffusing the right information – especially among SMEs – and providing the most effective allocation of resources. These possible explanations may indicate why Germany a large economy with a strong focus in diversified industrial processes and with a strong SME sector felt the necessity to create a national awareness in the need to develop Industry 4.0 in order to maintain its competitive advantages as a country.
A better understanding of the reasons for the differences among countries demands further studies and may be an avenue to future research.
5.2. Limitations
Several limitations are acknowledged that may influence or distort the conclusions of the previous analysis. In the first place, the variables are not being collected with the specific purpose of analyzing the adoption of Industry 4.0. The information that Eurostat is looking for is broader, referring to the
19 status of ICT utilization and digitization level of the corporate sector within each country. The main survey is directed to all types of enterprises, not only manufacturing ones, which means, from the point of view of Industry 4.0, a too large weight on the relevance of e-commerce and the lack of coverage of the existence of cyber-physical elements, for example. Also, the fact that the scope of information surveyed has been broadened recently may mean that answers are not stabilized yet as the enterprises, and eventually the National Statistics Institutes may have difficulties in interpreting the questions. Some of the variables that have been chosen have a much broader scope than the Industry 4.0 concept to which they have been associated: mobile connection to the internet for business use to use dedicated business software applications refers to enterprises that provide their employees portable devices for work related usage which includes e-mail and general internet access, even if it may also include the access to specific company applications; for ERP, in enterprises who have ERP software package to share information between different functional areas, it may happen that some enterprises may work with modules designed for specific functional areas that do not include the manufacturing process; finally, enterprises analyzing big data from any data source implies the possibility of information coming from other sources (final customers, for example) than the production or supply chain processes. Although all the variables referred to 2016, two of them measure a different reality as they are from 2015. Finally, there is a lack of data for some countries which prevents a full comparison and may eventually distort the results, given that some of the missing data were replaced by a proxy.
20
6. Conclusions
The present study had as objective to measure the degree of adoption of Industry 4.0 across EU countries, using the extensive set of information published by Eurostat on the ICT usage and digitization of the corporate sector. The measurement of such a concept is difficult as there is not a closed definition of Industry 4.0, on the one hand, and the data available has not been collected with the specific purpose of measuring it, on the other. Even if these circumstances introduce recognizable limitations, there is, however, enough evidence to form a judgment on the ability or readiness of the countries to adopt Industry 4.0. Evidence suggests there is a large dispersion among countries in relation to the presence of the conditions necessary for that readiness, but it also shows that the countries that have been on the forefront of closing the digital divide tend to be the ones also more advanced in the propensity of adoption Industry 4.0, a conclusion that is hardly surprising. The reasons that determine the differences among countries in the ability to adapt to Industry 4.0 require further research, however. Going forward, Eurostat may consider making its questionnaire more specific on the digitization of the industrial sector, focusing on the specific elements that constitute the Industry 4.0 concept, to have information that allows understanding the evolution and the drivers of the phenomena. In this respect, it would be interesting to understand the degree of adoption of the several technologies that support the Industry 4.0 concept or the use of cyber-physical systems and their autonomy within the production process. This information might be a further step in the implementation of the single digital market strategy, as it would be useful to devise the policies and investment strategies that will contribute to the increase of competitiveness in the manufacturing sector within the EU and that help to create the conditions to better integrate SMEs in the cycle of digitization and innovation
21
7. References
Agarwal, N., & Brem, A. (2015). Strategic business transformation through technology convergence: implications from General Electric’s industrial internet initiative. International Journal of Technology Management, 67(2/3/4), 196–214. https://doi.org/10.1504/IJTM.2015.068224
Ashrafi, R., & Mueller, J. (2015). Delineating IT resources and capabilities to obtain competitive advantage and improve f irm performance. Information Systems Management, 32(1), 15–38. https://doi.org/10.1080/10580530.2015.983016
Bharadwaj, A., El Sawy, O. a., Pavlou, P. a., & Venkatraman, N. (2013). Digital business strategy: toward a next generation of insights. MIS Quarterly, 37(2), 471–482. https://doi.org/10.1.1.216.1018 Bleicher, J., & Stanley, H. (2016). Digitization as a catalyst for business model innovation a three-step approach to facilitating economic success. Journal of Business Management, 8(12), 62–71.
Boyes, H., Hallaq, B., Cunningham, J., & Watson, T. (2018). The industrial internet of things (IIoT): An analysis framework. Computers in Industry, 101(April), 1–12.
https://doi.org/https://doi.org/10.1016/j.compind.2018.04.015
Brettel, M., Friederichsen, N., Keller, M., & Rosenberg, M. (2014). How virtualization ,
decentralization and network building change the manufacturing landscape : International Journal of Information and Communication Engineering, 8(1), 37–44.
https://doi.org/10.1016/j.procir.2015.02.213
Chiarello, F., Trivelli, L., Bonaccorsi, A., & Fantoni, G. (2018). Extracting and mapping industry 4.0 technologies using wikipedia. Computers in Industry, 100(September 2017), 244–257.
https://doi.org/10.1016/j.compind.2018.04.006
Cruz-Jesus, F., Oliveira, T., & Bacao, F. (2012). Digital divide across the European Union. Information and Management. https://doi.org/10.1016/j.im.2012.09.003
Cruz-Jesus, F., Oliveira, T., Bacao, F., & Irani, Z. (2016). Assessing the pattern between economic and digital development of countries. Information Systems Frontiers, 17(6).
https://doi.org/10.1007/s10796-016-9634-1
Dery, K., Sebastian, I. M., & van der Meulen, N. (2017). The digital workplace is key to digital innovation. MIS Quarterly Executive, 16(2), 135–152.
Dewan, S., & Riggins, F. J. (2005). The digital divide: current and future research directions. Journal of the Association for Information Systems, 6(12), 298–337. https://doi.org/10.1021/es200030z
Dongback, S. (2017). Digital business convergence and emerging contested fields: A conceptual framework. Journal of the Association for Information Systems, 18(10), 687–702.
22 El Sawy, O. A., Amsinck, H., Kræmmergaard, P., & Vinther, A. L. (2016). How Lego built the
foundations and enterprise capabilities for digital leadership. MIS Quarterly Executive, 15(2), 141– 166.
European Commission. (2015a). A Digital Single Market for Europe: Commission sets out 16 initiatives to make it happen. European Commission - Press Release, (May 2015). Retrieved from http://europa.eu/rapid/press-release_IP-15-4919_en.htm
European Commission. (2015b). A digital single market strategy for Europe. COM(2015) 192 Final, 20. https://doi.org/10.1017/CBO9781107415324.004
European Commission. (2015c). Monitoring the digital economy & society 2016-2021. https://doi.org/10.12968/jowc.2015.24.Sup5.S4
Eurostat. (2017a). Community survey on ICT usage and e-commerce in enterprises, 14–19.
Eurostat. (2017b). Methodological manual for statistics on the information society ICT usage and e-commerce in enterprises survey year 2017, version 1.0, (December 2016), 1–84. Retrieved from https://circabc.europa.eu/w/browse/c9df3412-21d8-4ef6-9312-fd68a9ff0c9e
Grover, V., & Kohli, R. (2013). Revealing your hand: Caveats in implementing digital business strategy. MIS Quarterly, 37(2), 655–663.
GTAI. (2013). Industrie 4.0 smart manufaturing for the Future. https://doi.org/10.1007/978-3-642-36917-9
Hermann, M., Pentek, T., & Otto, B. (2016). Design principles for industrie 4.0 scenarios. Proceedings of the Annual Hawaii International Conference on System Sciences, 2016–March, 3928–3937.
https://doi.org/10.1109/HICSS.2016.488
Hofmann, E., & Rüsch, M. (2017). Industry 4.0 and the current status as well as future prospects on logistics. Computers in Industry, 89, 23–34. https://doi.org/10.1016/j.compind.2017.04.002
Kagerman, H., Wahlster, W., & Helbig, J. (2013). Securing the future of German manufacturing industry Recommendations for implementing the strategic initiative INDUSTRIE 4.0 Final report of the Industrie 4.0 Working Group. acatech. https://doi.org/10.13140/RG.2.1.1205.8966
Mckinsey Digital. (2016). Industry 4.0 after the initial hype. McKinsey & Company.
Mithas, S., Tafti, A., & Mitchell, W. (2013). How a firm’s competitive environment and digital strategy posture influence digital business strategy. MIS Quarterly, 37(2), 511–536.
https://doi.org/10.1257/jel.50.4.1051
Moeuf, A., Pellerin, R., Lamouri, S., Tamayo-Giraldo, S., & Barbaray, R. (2017). The industrial management of SMEs in the era of Industry 4.0. International Journal of Production Research, 7543(October), 1–19. https://doi.org/10.1080/00207543.2017.1372647
23 Morgan, J., & O’Donnell, G. E. (2015). The cyber physical implementation of cloud manufactuirng monitoring systems. Procedia CIRP, 33, 29–34. https://doi.org/10.1016/j.procir.2015.06.007 Mosterman, P. J., & Zander, J. (2016). Industry 4.0 as a cyber-physical system study. Software and Systems Modeling, 15(1), 17–29. https://doi.org/10.1007/s10270-015-0493-x
Niehaves, B., & Plattfaut, R. (2013). Internet adoption by the elderly: employing IS technology
acceptance theories for understanding the age-related digital divide. European Journal of Information Systems Advance Online Publication. https://doi.org/10.1057/ejis.2013.19
OECD. (2001). Understanding the Digital Divide. Paris: OECD Publications. OECD. (2017a). OECD Digital Economy Outlook 2017.
https://doi.org/http://dx.doi.org/10.1787/9789264232440-en OECD. (2017b). The Next Production Revolution.
Oesterreich, T. D., & Teuteberg, F. (2016). Understanding the implications of digitisation and automation in the context of Industry 4.0: A triangulation approach and elements of a research agenda for the construction industry. Computers in Industry, 83, 121–139.
https://doi.org/10.1016/j.compind.2016.09.006
Pedone, G., & Mezgár, I. (2018). Model similarity evidence and interoperability affinity in cloud-ready Industry 4.0 technologies. Computers in Industry, 100(May), 278–286.
https://doi.org/10.1016/j.compind.2018.05.003
Peres-Neto, P. R., Jackson, D. A., & Somers, K. M. (2005). How many principal components? stopping rules for determining the number of non-trivial axes revisited. Computational Statistics and Data Analysis, 49(4), 974–997. https://doi.org/10.1016/j.csda.2004.06.015
Po, J. J., Hsieh, -An, Rai, A., & Keil, M. (2008). Undertstanding digital inequality: comparing continued use behavioral models of the socio-economically advantaged and disadvantaged. MIS Quarterly, 32(1), 97–126.
PwC. (2016). Industry 4.0: building the digital enterprise. Retrieved from www.pwc.com/industry40 Qin, J., Liu, Y., & Grosvenor, R. (2016). A categorical framework of manufacturing for Industry 4.0 and beyond. In Procedia CIRP. https://doi.org/10.1016/j.procir.2016.08.005
Reischauer, G. (2018). Industry 4.0 as policy-driven discourse to institutionalize innovation systems in manufacturing. Technological Forecasting and Social Change, 132(December 2017), 26–33.
https://doi.org/10.1016/j.techfore.2018.02.012
Santos, M. Y., Oliveira, J., Andrade, C., Lima, F. V., Costa, E., Costa, C., … Galvão, J. (2017). A Big Data system supporting Bosch Braga Industry 4 . 0 strategy. International Journal of Information
24 Sharma, S. (1996). Applied Multivariate Techniques. John Wiley & Sons Inc.
https://doi.org/10.2307/1270777
Smit, J., Kreutzer, S., Moeller, C., & Carlberg, M. (2016). Industry 4.0 a study for the European Parliament. Retrieved from http://www.europarl.europa.eu/studies
Vicente, M. R., & López, A. J. (2011). Assessing the regional digital divide across the European Union-27. Telecommunications Policy. https://doi.org/10.1016/j.telpol.2010.12.013
Wang, S., Wan, J., Zhang, D., Li, D., & Zhang, C. (2016). Towards smart factory for industry 4.0: A self-organized multi-agent system with big data based feedback and coordination. Computer Networks, 101, 158–168. https://doi.org/10.1016/j.comnet.2015.12.017
Wang, S., Zhang, C., Liu, C., Li, D., & Tang, H. (2017). Cloud-assisted interaction and negotiation of industrial robots for the smart factory. Computers and Electrical Engineering, 63, 66–78.
25
Appendix
Figure A1 - Scree plot Ward's Method