BJRS
RADIATION SCIENCES
07-03 (2019) 01-12ISSN: 2319-0612 Accepted: 2019-05-30
Response verification of integrated device used for radon
measurements in air
Aït-Ziane
aM., Allab
bM., Lounis-Mokrani
aZ.
a Laboratoire de Dosimétrie, Centre de Recherche Nucléaire d’Alger, BP. 399 Alger RP Algiers Algeria b Laboratoire SNIRM, Université des Sciences et de la Technologie Houari Boumediene,
BP. 32 Bab Ezzouar, Algiers, Algeria [email protected]
ABSTRACT
In order to establish the national radon level according to the ICRP recommendations, radon levels should be estimated in different living environments (dwellings, workplaces, hospitals, etc.). A particular attention should be given to the correctness of the radon concentration measurement devices in order to maintain their traceability to primary standard laboratory. Radon monitor systems have thus been calibrated using a NIST standard source which is considered as an important step in standardizing radon measurement methods.
In this paper, we describe the system used in our laboratory for the verification against radon response of different radon monitors such as Electret Ion Chamber (EIC) and AlphaGUARD continuous radon monitor (AG), and then we present comparison between these two measurements devices used in some locations at the Centre de Recherche Nucléaire d’Alger (CRNA). As results, EIC system produces results comparable to those produces by the AG system.
1. INTRODUCTION
It is well known that the principal source of exposure to radiation for the general public is from inhalation of radon and its short lived daughters and that the radon exposure risk is higher inside the different living environments (dwellings, workplaces, hospitals, schools, kindergarten and caves) than outdoors [1-3]. Many countries have developed radon survey programs in order to determine average exposures and to identify locations where high radon levels occur [4-5].
The CRNA (Algiers Nuclear Research Center) dosimetry laboratory has been recently involved in the establishment of the national reference level for radon, by conducting a radon survey program. At this end, different measurement methods (ionization chambers, scintillation, and track etched detectors) can be used and the associated detection systems must be calibrated in order to derive the radon concentrations before their use in routine mode. Several different measurement methods may be used to determine the radon concentrations in air. In practice, the choice of method is often dictated simply by availability. If alternative methods are available, the cost or /and duration of measurement may became the deciding factor.
This paper presents the verification method used in our laboratory; it has been performed using a reference radon monitor AlphaGUARD PQ 2000 (AG). The AG verification has been firstly done using a NIST (National Institute of Standards and Technology-USA) 222Rn emanation standard
source at different radon concentrations. The comparison of radon concentrations performed in some laboratories inside of the CRNA given by the used systems of measurements is also presented.
2. MATERIALS AND METHODS
2.1. Exposition setup for AG calibration factor verification
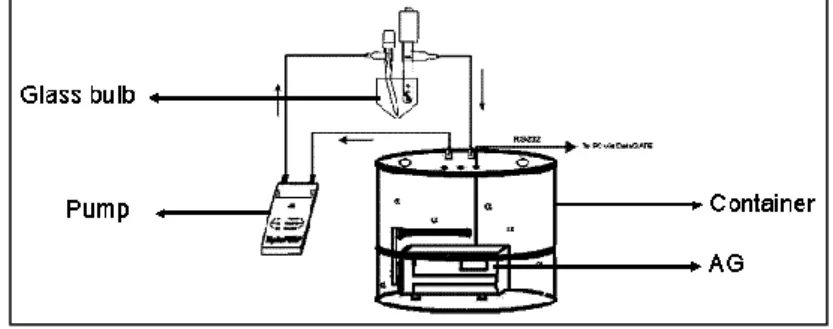
The calibration chamber consists of a 101.1 liters gas tight container made of stainless steel serves for retaining the detectors to be calibrated (Fig.1). It has a certified leakage rate, equal to 2.65×10⁻⁵ h-1. The 222Rn emanation standard source (SRM 4973) used in the present study is
certified by NIST in terms of its 226Ra content (448.5 ± 6.2) Bq and its 222Rn emanation fraction (0.877 ± 0.014) at 21°C. It consists of a polyethylene encapsulated 226Ra solution loaded into a leak tight glass bulb of a known volume where 222Rn accumulates over time.
A gas tight electronic pump (AlphaPump) was used to transfer the accumulated radon gas from the glass bulb into the container without gas loss and dilution. Radon concentrations in the calibration chamber are measured using the AG radon monitor pulse-type ionization chamber manufactured by SAPHYMO GmbH, in order to calibrate this active radon measurement device traceable to NIST.
Figure 1: Experimental setup for transferring the radon activity released by the standard source into the calibration chamber.
The evolution of radon concentrations in time measured inside the calibration chamber using AG system in diffusion mode during 21 days, every 10 min is reported in Fig.2. It has been compared to the corresponding calculated concentrations obtained by using decay function with a
Figure 2: Radon decay in the calibration chamber. 0 5000 10000 15000 20000 25000 0 1000 2000 3000 4000 Expérimentale Fit Conce ntr atio n d u Ra do n ( Bq/m) 3 Temps (min)
2.2. Electret Ion Chamber radon detectors
The passive detectors to be calibrated consist of Electret Ion Chambers (EIC). They are placed into the calibration chamber described above and are exposed at different radon concentrations. The Electret Passive Environmental Radon Monitor (E-PERM) Electret Ion Chamber used for this study was manufactured by Rad Elec, Inc., (Frederick, MD. USA).
The application of the E-PERM system for radon concentrations has been shown to be an easy method giving accurate results comparable to the other techniques such as liquid scintillation counters and emanation methods [7-9]. The E-PERM method is also cost-effective when repeated measurements are required. The EIC system consists of three components: an electret, which is an electrostatically charged Teflon disk that collects ions, a conductive plastic ion chamber where the electret is loaded, and a voltage reader that records the electret voltage [7-9]. The chamber inlet is fitted with a filter that is permeable only to radon and not to its daughters. After diffusing into the chamber, radon and subsequently its daughters decay by the emission of radiation inducing ionizations in the chamber. The generated negative ions are attracted to the positively charged electret causing a decrease of the electret voltage. The drop of the electret voltage is proportional to the radon concentration according to the following equation [9]:
B t C V V C F f i Rn − − =( ) (1)
Where CRn is the average radon concentration in pCi/l, Vi and Vf are respectively the initial and
final voltage readings, t is the exposure time in days, and Bγ is the background gamma count in
pCi/l deduced from AG monitor measurements. CF is a calibration factor that can be found for short-term electrets from the following expression [7]:
2 0.00057420 1.697760 i f F V V C = + + (2)
3. RESULTS AND DISCUSSION
3.1. Radon detectors verification
Active and passive radon measurement detectors were exposed into the calibration chamber. After measuring the background concentration CRn0 (Bq/m
3) for several hours, the valves of the
container and those of bulb are opened for 15 min in order to transfer the radon released from the NIST SRM and accumulated within the glass bulb into the calibration chamber (Fig. 1).
3.1.1 Verification of AlphaGUARD (AG) calibration factor
In order to verify the calibration factor of the AG device, the measurement of initial radon concentration CRnm (Bq/m
3) has been referred to the actually released activity of SRM as suggested
by the supplier [10]. The deviation in activity (%) can be written as:
(
)
( )
( ) (A f) f A V V C C SRM SRM AG Con Rn m Rn − − − = 0 (3)Where VConand VAG are respectively the volume of the calibration chamber and the volume of the AG device (m3), ASRMis the certified activity of NIST SRM (448.5 ± 6.2) Bq and f is the
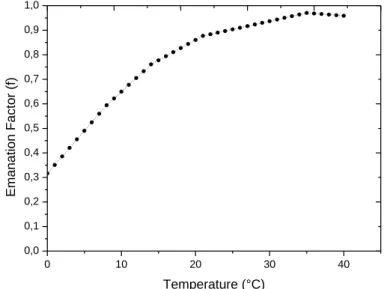
emanation fraction (0.877 ± 0.014 at 21°C) (Fig. 3). The effect of temperature variation rather than the certified value of the NIST standard source has a considerable effect on the radon emanated
from the source as suggested by the supplier [11] and by Mansy et al. [12] (0.7 and 0.8% °C-1 respectively).
The values of the relative deviation between the assumed activity of the SRM source (ASRM× f
) and the activity of this source measured by the AG have been determined and plotted in Figure 4. These values which spread from 3% to 19% are lower than the criterion used in the measurement test requires in US-EPA which states that the deviation in activity (%) not exceeds 25% [13].
This difference is probably due to the effect of temperature on the radon emanation factor of the source used. The phenomena related to the radon leakage in the chamber can also contribute, in a minority way, to this difference.
Figure 3: Variation of emanation factor (f) as a function of temperature.
0 10 20 30 40 0,0 0,1 0,2 0,3 0,4 0,5 0,6 0,7 0,8 0,9 1,0 Eman atio n F acto r ( f) Temperature (°C)
3.1.2 Response verification of the EIC system
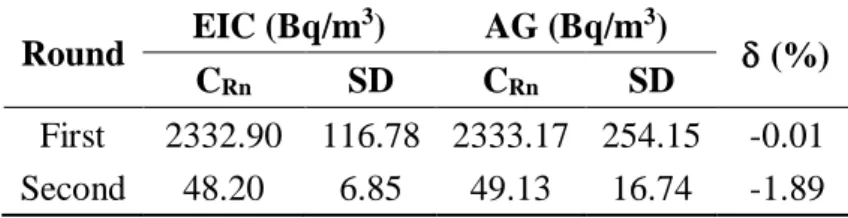
The verification against radon response of the EIC system has been performed using the AG device as reference radon monitor. Measurements of the radon concentrations in the calibration chamber have been performed using both EIC and AG devices in two rounds corresponding to high and low exposure conditions respectively. The mean temperature and relative humidity conditions
in the radon calibration chamber and exposure period are reported in table 1. It can be noted that temperature and relative humidity conditions are nearly constant during the same round (Fig.5).
Figure 4: Values of the relative deviation (%) for different measurements.
0 2 4 6 8 10 12 0 10 20 30 () Measurement (n°)
Figure 5: Environmental conditions during the second round of exposure.
16/08/2016 17/08/2016 18/08/2016 0 10 20 30 40 50 60 T rH time Te mp er atu re (°C) 0 10 20 30 40 50 60 70 80 Relative Hum idity ( %)
Table 1: Environmental conditions during the exposure period. Round Temperature (°C) Relative humidity (%) Exposure period (h)
First 27.4 ± 0.67 73.13 ± 0.8 115
Second 26.50 ± 0.55 66.13 ± 1.04 48.8
The results listed in table 2 show a good agreement between EIC and AG radon mean concentration measurements (< 2% for low radon concentrations), implying that the use of EIC device does not require any correction to the calibration factor given in (2).
Table 2: Radon concentrations and relative deviation measured by EIC and AG devices.
Round EIC (Bq/m 3) AG (Bq/m3) (%) CRn SD CRn SD First 2332.90 116.78 2333.17 254.15 -0.01 Second 48.20 6.85 49.13 16.74 -1.89
3.2. Radon measurements comparison
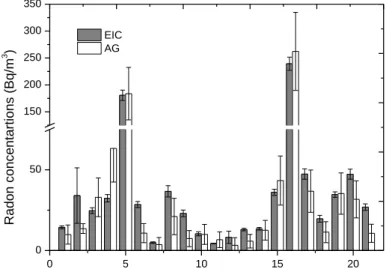
Radon concentration measurements have been performed in twelve locations inside the CRNA using the calibrated EIC passive system and the AG active device. Several EIC devices were exposed for a period of 7 days. The AG continuous radon monitor was used for several days on diffusion mode, with 10 min integration time. All experiments were performed in laboratories and control rooms situated at different levels inside the CRNA. The results of radon concentrations CRn
(Bq/m3) measured in the survey are plotted in Fig. 6.
The relationship is a slope near the first bisector confirms that both devices have the same response to radon (Fig.7), with a slope of (1.031 ± 0.041); Pearson (r) equal to 0.9846 (R2 =
0.9678), a good fit is obtained between the two sets of data, confirming the result obtained by Denman et al. (slope: 1.069, coefficient of determination R2: 0.9615) [14]. The effects of noise and loss of load are negligible.
Figure 6: Average radon concentrations measured by EIC and AG in different locations.
Figure 7: Response of the EIC vs. AG of radon concentrations
0 50 100 150 200 250 300 0 50 100 150 200 250 300 AG System (Bq/m 3 ) EIC System (Bq/m3)
It comes out that the AG is a very precise system which has a relatively short measurement duration, can be used generally for radon measurements devices calibration and for a special
0 5 10 15 20 0 50 150 200 250 300 350 Rado n co nce nta rtio ns ( Bq/m 3 ) EIC AG
measurements as tracking the variation of concentration in the location, while the EIC system is relatively inexpensive which produces results comparable to those produces by the AG system.
4. CONCLUSION
The response against radon has been vivificated for electrets Ion Chambers (EIC) using an Alpha Guard (AG) reference instrument and a NIST radon standard source. Radon concentration levels have been measured in different exposure situations: controlled (calibration chamber) and non- controlled (some laboratories at the CRNA) using both systems (EIC and AG).
The EIC system produces results comparable to those produces by the AG system. Therefore, it can be valuably used in the radon campaign in order to estimate the national radon reference level. When screening for radon concentrations for monitoring purposes there is little point in choosing one type of radon gas measuring device over another for reasons of accuracy, and practically any registered devices at lowest cost may be sought. When, however, for calibrating integrated devices is needed or significant remediation decisions need to be made, sensitive measurement of radon concentrations used an active monitor would be the best choice.
REFERENCES
[1] SWEDJEMARK, G.A.; MJÖNES, L. Radon and radon daughter concentrations in Swedish homes. Radiation Protection Dosimetry, v. 7, p. 341–345, 1983
[2] UNSCEAR- United Nations Scientific Committee on the Effects of Atomic Radiation. Sources and effects of ionizing radiation, Report to the General Assembly, United Nations, New York, UNSCEAR 2000
[3] MILES, J.C.H.; APPLETON, J.D.; REES, D.M.; GREEN, B.M.R.; ADLAM, K.A.M.; MYERS, A.H. Indicative atlas of radon in England and Wales, Health Protection Agency and British Geological Survey, 2007
[4] VILLALBA, L.; MONTERO-CABRERA, M.E.; MANJON-COLLADO, G.; COLMENERO-SUJO, L.; RENTERIA-VILLALOBOS, M.; CANO- JIMENEZ, A.; RODRIGUEZ-PINEDA, A.; DAVILA-RANGEL, I.; QUIRINO-TORRES, L.; HERRERA-PERAZA, E.F. Natural radioactivity in groundwater and estimates of committed effective dose due to water ingestion in the state of Chihuahua (Mexico). Radiation Protection Dosimetry, v. 121(2), p. 148–157, 2006
[5] JANIK, M.; TOKONAMI, S.; KOVÁCS, T.; KÁVÁSI, N.; KRANROD, C.; SORIMACHI, A. International intercomparisons of integrating radon detectors in the NIRS radon chamber, Applied Radiation and Isotopes, v. 67, p. 1691–1696, 2009
[6] ENSDF (2005) Evaluated Nuclear Structure Data File Search and Retrieval, https://www.nndc.bnl.gov/ensdf/
[7] KOTRAPPA, P.; DEMPSEY, J.C.; HICKEY, J.R; STIEFF, L.R. An electret passive environmental 222Rn monitor based on ionization measurement. Health Physics, v. 54(1), p.
47–56, 1988
[8] KOTRAPPA P.; DEMPSEY J.C.; RAMSEY R.W.; STIEFF L.R. A practical E-Perm system for indoor 222Rn measurement, Health Physics, v. 58, p. 461–466, 1990
[9] KOTRAPPA, P. E-PERM electret ion chambers for measuring radon in water, E-PERM System Manual, Rad Elec Inc. 1–13, 1999
[10] BÜRKIN, W. Calibration using the NIST standard reference material SRM 4973 (Brief Tutorial), GENITRON System Manual, Saphymo GmbH, 2009
[11] NIST-National Institute of Standards and Technology, Certificate for Standard Reference Material SRM-4973, 222Rn Emanation standard, NIST 2005
[12] AL MANSY, M.K.; EL-SAMMAN, H.; HASSAN, M.A.; MAHFOUZ, E.; EISSA, H.; and EL-FIKI, M. Effect of variation in the ambient temperature on the NIST encapsulated 222Rn emanation standard source, In: Proceeding of The International Conference for Environmental Hazard Mitigation (ICEHM 2000), Cairo, Egypt, 9–12 September 2000, 576- 579
[13] EPA-Environmental Protection Agency, The national measurement proficiency (RMP) program, Handbook. EPA520/1-90-006 Feb 1991, First edition, EPA 1991
[14] DENMAN, A.R.; GROVES-KIRKBY, C.J.; PHILLIPS, P. S.; CROCKETT, R.G.; WOOLRIDGE, A.; GILLMORE, G.K. The practical use of electrets in a public health radon remediation campaign, Journal of Environmental Radioactivity, v. 84(3), p. 375–391, 2005