BJRS
RADIATION SCIENCES
07-02B (2019) 01-13ISSN: 2319-0612 Accepted: 2019-02-22
Experimental estimation of moderator temperature
coefficient of reactivity of the IPEN/MB-01 research
reactor
R. C. da Silva
a; U. d’U. Bitelli
b. L. E. C. Mura
baUniversity of São Paulo/School of Engineering, 05508-10, São Paulo/SP, Brazil bNuclear and Energy Research Institute(IPEN)/ 03178-200, São Paulo/SP, Brazil
ABSTRACT
The aim of this article is to present the procedure for the experimental estimation of the Moderator Temperature Coefficient of Reactivity of the IPEN/MB-01 Research Reactor, a parameter that has an important role in the physics and the control operations of any reactor facility. At the experiment, the IPEN/MB-01 reactor went criti-cal at the power of 1W (1% of its total power), and whose core configuration was 28x26 rectangular array of UO2 fuel rods, inside a light water (moderator) tank. In addition, there was a heavy water (D2O) reflector
in-stalled in the West side of the core to obtain an adequate neutron reflection along the experiment. The moderator temperature was increased in steps of 4oC, and the measurement of the mean moderator temperature was
acquired using twelve calibrated thermocouples, placed around the reactor core. As a result, the mean value of -4.81 pcm/°C was obtained for such coefficient. The curves of ρ(T) (Reactivity x Temperature) and 𝛂𝐓𝐌(𝐓) (Mod-erator Temperature Coefficient of Reactivity x Temperature) were developed using data from an experimental measurement of the integral reactivity curves through the Stable Period and Inverse Kinetics Methods, that was carried out at the reactor with the same core configuration. Such curves were compared and showed a very simi-lar behavior among them.
1. INTRODUCTION
The moderator temperature coefficient of reactivity αTM of water moderated reactors is an im-portant operational parameter that is strongly associated with safety issues of the nuclear installation [1]. According to [2], the αTM substantially varies based on the geometry, the moderator temperature, the concentration of substances in the moderator (like boron), among others. The usual values of such coefficient for Boiling Water Reactors (BWR) are -5pcm/oC (at 20oC) and -25 pcm/oC (at 280oC) and, for Pressurized Water Reactors (PWR), between -5 and -30 pcm/°C.
In water moderated reactors, the moderator temperature coefficient of reactivity causes variations in the liquid density and in the energy spectrum of thermal neutrons [3]. Such modification changes the balance between fission and absorption rates in the core, since these factors are function of the energy of neutrons [4].
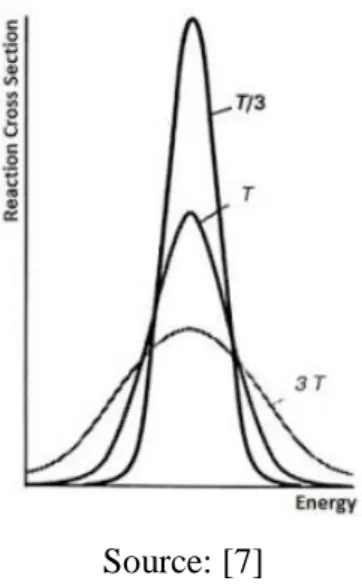
Figure 1 shows the change in the energy spectrum of neutrons caused by a temperature varia-tion. The average neutron energy is proportional to the absolute temperature, so the shift in the spectrum for a temperature change from 20°C to 300°C (293K to 573K) almost doubles the energy at the peak of the curve. According to [5], the shift of the neutron spectrum to higher temperatures changes the rates of thermal neutron absorption in the fissile isotopes.
Figure 1: Temperature Effect on Neutron Energy Spectrum
Additionally, temperature variations in a reactor core influence the value of the multiplication factor (K) through the change in the reactivity of the core components, which in turn, change the microscopic cross sections (Doppler Broadening – Figure 2) [6].
Figure 2: Doppler Broadening
Source: [7]
The cross sections depend on the relative velocity between the neutrons and the target nuclei. Temperature variation results in change of neutron energy, and if it is found in a resonance region, the neutron will be absorbed by the fuel (especially 238U) [7]. Therefore, it is an undesirable effect in certain circumstances and in others it acts because of the reactor safety system. In general, a reac-tor is designed to have αTM<0, thus ensuring that a negative reactivity feedback will be performed in the event of a power increase. However, accidents may happen if the value is excessively negative due to the cooling system, especially in PWR [1].
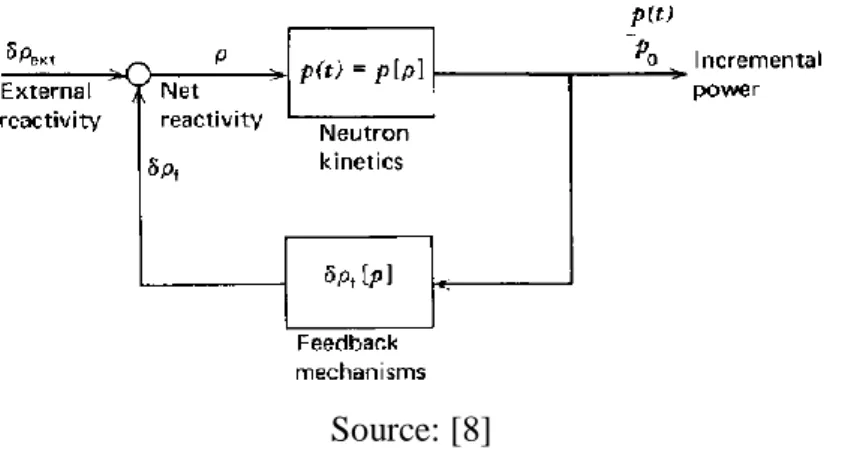
Figure 3 shows the closed-loop model that explains the influence of the temperature coefficient of reactivity in the reactor core reactivity. If αTM>0, a temperature increase produces reactivity in-crease (ρ) and, consequently, a power inin-crease, which would in turn, raise temperature. In contrast, if αTM<0, a temperature increase would cause a decrease in ρ, which would in turn, decrease both power and temperature [8].
Figure 3: Closed-loop Model of the Relation between Temperature and Reactivity
Source: [8]
Therefore, the most advantageous situation would be αTM<0 or, more generally, α
T<0
(Tempera-ture Coefficient of Reactivity), which would make the reactor achieve a stable power level due to temperature increase.
2. MATERIALS AND METHODS
2.1 Determination of the Moderator Temperature Coefficient of Reactivity
In general, the temperature coefficient of reactivity (αT) is defined as the variation of reactor core reactivity due to temperature variation, i.e.:
αT ≡ ∂ρ
∂T≡ ∆ρ
∆T (1)
According to [8], several parts of temperature coefficients of reactivity are usually added due to the major components of the reactor core, such as fuel, moderator, and structure, among others. Thus, the formation of αT is the sum of these ‘j’ parts:
αT = ∑ αj j≡ ∂ρj
∂Tj (2)
As simplification, [6] only consider alterations in water and nuclear fuel temperature. Therefore, the main temperature effects are alterations in resonance absorbance (Doppler Broadening) due to changes in fuel and in the energy spectrum of neutrons, which were caused by alterations in the moderator density.
Therewith, αT is comprised only of fuel (αTF) and moderator (αTM) parts:
αT= αTF + α T
M (3)
Particularly in the IPEN/MB-01 reactor, temperature variations are small in a way that the effect of αTF is small if compared with αTM [6]. Thus:
αT ≈ αTM (4)
Based on equations 1, 3 and 4, it is possible to determine the moderator temperature coefficient of reactivity of IPEN/MB-01 reactor.
2.2 The Experimental Procedure
The IPEN/MB-01 reactor is a zero-power critical facility designed for measurements of a wide variety of reactor physics parameters to be used as benchmarks for the evaluation of calculation methods and related nuclear data libraries [13].
According to [11] and [12], the standard configuration of the reactor core is a fuel rods rectan-gular array (28×26) immersed in a demineralized light water (moderator) tank. Such reactor has a water heating, cooling and circulation system that controls the temperature of the moderator in the range of 7o to 90oC [9]. Moreover, twelve calibrated thermocouples (T1 to T12) were used in this
experiment as well as their mean temperature value (Figure 4).
Figure 4: Location of Thermocouples at the IPEN/MB-01 Reactor Core
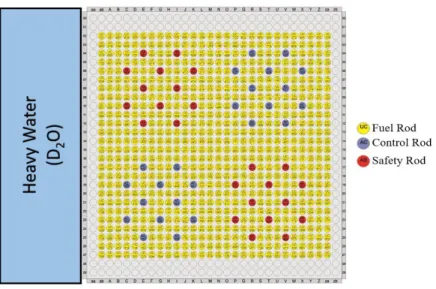
This experiment was performed with a standard core configuration with a heavy water reflector placed on the west side of the core (Figure 5). Furthermore, the initial conditions of the reactor were:
• Critical Reactor Power = 1W;
• Moderator Temperature = 18.42o ±0.05oC;
• Position of the Control Rods (CR) = %CR1=%CR2= 49.13 % withdrawn; • Position of the Safety Rods (SR) = %SR1=%SR2=135% withdrawn.
Figure 5: Configuration of the IPEN/MB-01 Reactor Core
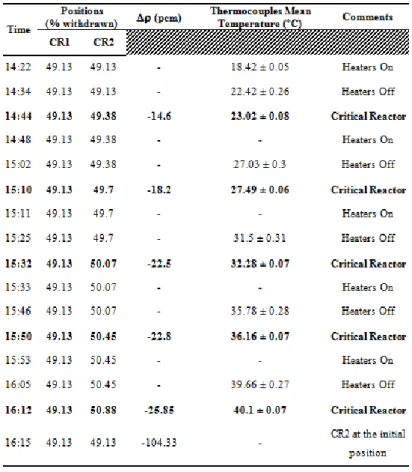
The moderator was heated through 3 electrical resistances (110kW each). In every approximate 4oC increments (steps) in the moderator temperature, the heaters were turned off until the thermo-couples mean temperature value stabilizes (with a standard deviation around ±0.05oC). After the temperature increased, the reactor went subcritical. Then, the CR2 position was changed in a way that the criticality was once more achieved.
This process was carried out until the moderator temperature achieved the highest degree of about 40oC. Figure 6 shows the variation steps of thermocouples temperature during the experi-ment.
Figure 6: Variation of the Thermocouples Temperature
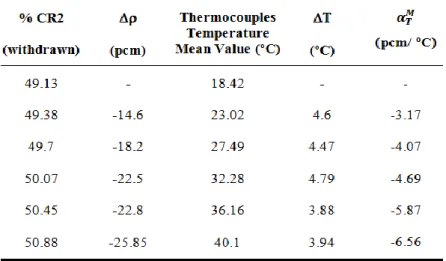
Table 1 shows the data obtained during the experimental procedures, that is, the positions of control rods (CR1 and CR2 in % withdrawn), the reactivity variation (), and the thermocouples mean temperature.
3. RESULTS AND DISCUSSION
3.1 𝜶𝑻𝑴 Values
By the values of the mean temperature of the thermocouples and ∆𝜌, it was possible to calculate the value of moderator temperature coefficient of reactivity through equations 1 and 4 for each CR2 position. Table 2 shows the αTM results.
Table 2: Values of Moderator Temperature Coefficient of Reactivity
3.2 ρ(T) Curves
By means of the CR2 position values (% withdrawn), the integral reactivity values were calcu-lated based on the calibration curves obtained in [10] (Inverse Kinetics and Stable Period Methods) with the same core configuration; and then, the ρ(T) curves were developed. Equations 5 and 6 are the calibration curves (fitted by a Boltzmann equation) obtained by the stable period and inverse kinetic methods, respectively.
ρSP(%CR2) = 3282.23 − (3312.06)/[1 + exp ( %CR2−48.22 12.27 )] (5) ρIK(%CR2) = 3263.37 − (3332.91)/[1 + exp ( %CR2−48.46 12.92 )] (6)
where ρSP (%CR2) and ρIK (%CR2) are the reactivity value inserted by the %CR2, obtained by the
stable period and inverse kinetics methods, respectively.
By adding the %CR2 values in equations 5 and 6, the moderator temperature reactivity coefficients were calculated (Table 3) based on the integral reactivity curves values obtained by the stable peri-od methperi-od (αT_SPM ) and inverse kinetics (α
T_IK
Table 3: 𝜶𝑻_𝑺𝑷𝑴 and 𝜶𝑻_𝑰𝑲𝑴 Values
Figure 7 illustrates the ρ(T) curves obtained from integral reactivity curves values calculated from equations 5 and 6. Such curves were adjusted with the second-degree polynomial equations 7 and 8:
ρSP(T) = 0.1014T2− 0.5319T + 1663 (7)
ρIK(T) = 0.09728T2− 0.5246T + 1617 (8)
The inversion points (IP), indicated in Figure 7, correspond to the temperature in which the αTM value changes its signal. The IP were calculated through the basic formulation of a parabola mini-mum point (∂ρ(T)/∂T=0), to both cases of inverse kinetics (IPKI) and stable period (IPSP) Methods.
3.3 𝜶𝑻𝑴(𝑻)Curves
Based on the reactivity values calculated in the previous item, the αTM(T) curves were developed for the experiment values (Figure 8), and for those ones calculated by the stable period and inverse kinetics methods (Figure 9).
Figure 8: 𝜶𝑻𝑴(𝑻) Curve (Experiment)
Figure 9: 𝜶𝑻𝑴(𝑻) Curve (Stable Period and Inverse Kinetics Methods)
The αTM(T) curves, represented by equations 9, 10 and 11, are second-degree polynomials with determination coefficients (R2) close 1, which shows adherence between regressions and values of the moderator temperature coefficient of reactivity. Moreover, Figure 10 shows the comparison between the obtained αTM(T) curves.
αT SPM (T) = −0.002201T2− 0.07046T − 0.9546 (10) αT IKM (T) = −0.002146T2− 0.06555T − 0.9337 (11)
Figure 10: Comparison between 𝛂𝐓𝐌(𝐓), 𝛂𝐓 𝐒𝐏𝐌 (𝐓) and 𝛂𝐓 𝐈𝐊𝐌 (𝐓) Curves
Based on the results, mean differences of 13.3% were found between αT SPM (T) and α T M(T), and 8.5% between αT IKM (T) and α T M(T).
4. CONCLUSION
It was found negative values of moderator temperature coefficient of reactivity, which module increases with temperature. Such fact is desirable to achieve a safe reactor, since temperature and reactivity are anti-correlated magnitudes. The obtained αTM(T) curves are important to study the behavior of the core reactivity with a heavy water reflector.
This experiment may be considered an important benchmark in the IPEN/MB-01 reactor, provi-ding data about how a heavy water reflector can affect some reactor physics parameters. Moreover, it was possible to notice that the temperature coefficients of reactivity, as well as the role of a heavy water reflector, are very important in the safety and stability of nuclear reactors. The correct deter-mination of this parameter by experimental or analytical methods in early stage of the project de-sign is highly important to achieve a safe and effective reactor operation.
5. ACKNOWLEDGMENT
The authors gratefully acknowledge the IPEN/MB-01 staff for providing the technical support that made possible the successful execution of this experiment.
REFERENCES
[1] MOURTZANOS K.; HOUSIADAS C.; ANTONOPOULUS-DOMIS M. Calculation of the Moderator Temperature Coefficient of Reactivity for Water Moderated Reactors. In:
Annals of Nuclear Energy, v. 28, p.1773-1782, 2001.
[2] EDENIUS, M. Studies of the Reactivity Temperature Coefficient in Light Water
Re-actors. Chalmers University of Technology. Göteborg, 1976.
[3] LEWIS, E. E. Fundamentals of Nuclear Reactor Physics. 1st ed. Academic Press, 2008. [4] NUCENG-Elementary Physics of Reactor Control. Available at:
www.nuceng.ca/ep6p3/class/Module3C_Temp&VoidJun21.pdf (2016). Last Accessed: 15 Jan. 2017
[5] CANTEACH-Science and Reactor Fundamentals – Reactor Physics. Available at: https://canteach.candu.org/Content%20Library/20030101.pdf (2010). Last Accessed: 23Jan. 2017.
[6] BITELLI U. d’U ; MURA L. E. C.. IPN0025 - Física de Reatores: Experimentos no
rea-tor Nuclear IPEN/MB-01. Lectures Notes. Nuclear and Energy Research Institute. São
Paulo, 2016.
[7] HART S.W.D. Automated Doppler Broadening of Cross Sections for Neutron
Transport Applications. PhD Thesis. University of Tennessee. Knoxville, 2014.
[8] DUDERSTADT J.J; HAMILTON L. J. Nuclear Reactor Analysis. John Wiley & Sons. New York, 1976.
[9] PINTO L. N. Experimentos de Efeitos de Reatividade no reator Nuclear IPEN/MB-01. Master Thesis. Nuclear and Energy Research Institute. São Paulo, 2012.
[10] DA SILVA R. C; BITELLI U. d’U; MURA L.E.C. Experimento de Calibração das
Inversa. Report of the IPN0025 Course – Reactor Physics: Experiments at IPEN/MB-01
Nuclear Reactor. Nuclear and Energy Research Institute. São Paulo, 2016.
[11] IPEN – Nuclear and Energy Research Institute. Curso Preparatório de Operadores de
Reator – Teoria Básica. v.1. São Paulo, 2000.
[12] BITELLI U. d’U. Medida de Parâmetros Integrais no Reator IPEN/MB-01. Master Thesis, Nuclear and Energy Research Institute. São Paulo, 2001.
[13] DOS SANTOS A. et al. Validation of neutronic models and calculation systems by
means of experimental results in the IPEN/MB-01 reactor. In: Annals of Nuclear