www.nat-hazards-earth-syst-sci.net/16/2769/2016/ doi:10.5194/nhess-16-2769-2016
© Author(s) 2016. CC Attribution 3.0 License.
Assessing population exposure for landslide risk analysis
using dasymetric cartography
Ricardo A. C. Garcia, Sérgio C. Oliveira, and José L. Zêzere
Centre for Geographical Studies, Institute of Geography and Spatial Planning, Universidade de Lisboa, Lisbon, 1600-276, Portugal
Correspondence to:Ricardo A. C. Garcia ([email protected])
Received: 3 June 2016 – Published in Nat. Hazards Earth Syst. Sci. Discuss.: 7 June 2016 Revised: 14 November 2016 – Accepted: 22 November 2016 – Published: 19 December 2016
Abstract. Assessing the number and locations of exposed people is a crucial step in landslide risk management and emergency planning. The available population statistical data frequently have insufficient detail for an accurate assessment of potentially exposed people to hazardous events, mainly when they occur at the local scale, such as with landslides. The present study aims to apply dasymetric cartography to improving population spatial resolution and to assess the po-tentially exposed population. An additional objective is to compare the results with those obtained with a more com-mon approach that uses, as spatial units, basic census units, which are the best spatial data disaggregation and detailed information available for regional studies in Portugal. Con-sidering the Portuguese census data and a layer of residential building footprint, which was used as ancillary information, the number of exposed inhabitants differs significantly ac-cording to the approach used. When the census unit approach is used, considering the three highest landslide susceptible classes, the number of exposed inhabitants is in general over-estimated. Despite the associated uncertainties of a general cost–benefit analysis, the presented methodology seems to be a reliable approach for gaining a first approximation of a more detailed estimation of exposed people. The approach based on dasymetric cartography allows the spatial resolution of population over large areas to be increased and enables the use of detailed landslide susceptibility maps, which are valu-able for improving the exposed population assessment.
1 Introduction
1.1 General concepts and framework
In the natural sciences, risk is a function of the probability of occurrence of a hazard scenario and the related consequences that are expected for the exposed elements at risk (e.g. Varnes and IAEG, 1984; Fuchs et al., 2013). So a complete landslide risk analysis is a function of the frequency and process mag-nitude (e.g. Guzzetti et al., 1999) and of the level of damages and associated costs (e.g. Varnes and IAEG, 1984). However, in some cases it is not possible to quantify the time recur-rence and/or the landslide magnitude, and the susceptibility, considered to be the likelihood of landslide occurrence in a specific area according to terrain conditions (Brabb, 1984), can be used as a first and simple approach of phenomena oc-currence (e.g. Guillard-Gonçalves et al., 2015).
Regarding the vulnerability assessment, different vulnera-bility dimensions (e.g. social, personal, structural, economic, political and environmental) are frequently taken into ac-count (Fuchs, 2009; Kienberger et al., 2009) and linked to each other (Fuchs, 2009; Papathoma-Köhle et al., 2011; Kappes et al., 2012). Therefore, integrated approaches to assess vulnerability have gained popularity in recent years (Fuchs et al., 2011, Karagiorgos et al., 2016); nevertheless they require a quantitative evaluation of each vulnerability component, such as the assessment of elements at risk, their physical exposure and social characteristics (Karagiorgos et al., 2016). The variety of potentially exposed elements – i.e. elements present in hazardous zones that are thereby sub-ject to potential losses (e.g. UNISDR, 2009) – and their dif-ferent characteristics (e.g. buildings, roads, people) leads to a complex and multi-level analysis; consequently studies that
include more than one type of exposed element are scarce (e.g. Michael-Leiba et al., 2003; Keiler, 2004; Promper and Glade, 2016).
Frequently, only two vulnerability dimensions are consid-ered: physical vulnerability and social vulnerability. Regard-ing physical vulnerability, attempts have been made to estab-lish empirical relationships between process intensity, type and number of exposed elements to estimate the expected de-gree of loss (e.g. Galli and Guzzetti, 2007; Papathoma-Köhle et al., 2007, 2012; Petrucci and Gullà, 2010; Kappes et al., 2012; Silva and Pereira, 2014; Uzielli et al., 2014; Winter et al., 2014; Fuchs et al., 2015; Promper et al., 2015; Guillard-Gonçalves et al., 2016).
Concerning the social sciences, attention has been drawn to the way communities and society in general cope with and adapt to disaster events (e.g. Cutter et al., 2003; Kienberger et al., 2009; Mendes, 2009; Nathan et al., 2010).
Other studies have tried to evaluate the relationship be-tween process occurrence and injuries to people and/or their evacuation, by calculating the probability of fatalities and their acceptability/tolerance and combining approaches to build f − N curves (e.g. HSE, 1992; Cruden and Fell, 1997; Evans, 1997; Guzzetti, 2000). Further studies have evalu-ated the probability of people being affected outside or inside an element (e.g. a house) that is hit by the hazardous event (e.g. Ragozin and Tikhvinsky, 2000; Bell and Glade, 2004; Kaynia et al., 2008). The abovementioned studies are gen-erally based on historical data of hazard phenomena that af-fected population (e.g. Dai et al., 2002; Guzzetti et al., 2005). However, these historical databases are often insufficient and incomplete, which means that probabilities have frequently been based on knowledge and judgement (Michael-Leiba et al., 2003).
Truly interdisciplinary research is needed for the analy-sis of such a dynamical and complex topic (Fuchs et al., 2011). In addition, different datasets of elements must be taken into account (e.g. building structure and materials, number of inhabitants, infrastructures uses, traffic volume) to estimate direct and indirect costs within the quantitative risk analysis (e.g. Zêzere et al., 2007, 2008; Remondo et al., 2008; Corominas et al., 2014; Schwendtner et al., 2013). Conversely, the lack of interdisciplinary and multi-level ap-proaches (e.g. regional/international, personal/political) can reduce the efficiency of adopted policies designed to avoid disasters (e.g. Xanthopoulos, 2007; Aubrecht et al., 2013).
An accurate assessment of the number of people present at a certain time and place is crucial for emergency planning, namely to manage evacuations. It is mandatory to know, as precisely as possible, the location of potentially exposed per-sons to guarantee the efficiency of emergency plans and to reduce associated costs related with the rescue of people and social recovery (e.g. Bhaduri et al., 2002; Sutton et al., 2003; Chen et al., 2004; Su et al., 2010; Freire and Aubrecht, 2012; Freire et al., 2012; Aubrecht et al., 2013). In fact, according
to Bhaduri et al. (2002), locating population at risk must be the first step in saving lives.
Accurate knowledge of the number and location of ex-posed persons is mandatory for a complete risk analysis that further calls for a harmonization between the resolu-tion of the hazard data and detailed popularesolu-tion distriburesolu-tion data. High-resolution population distribution data are mainly needed when the hazard has no extensive consequences, as in the case of landslides, for which the processes are more selective and damage is local (Deichmann et al., 2011). Ad-ditionally, in larger study areas where diverse types of occu-pation can take place (urban, rural), significant differences in population density are expected to exist. When a combina-tion of these two situacombina-tions occurs (local hazard and sparse population) it becomes even more important to know the pre-cise location of the exposed people.
1.2 Assessment of population exposure – state of the art The vulnerability of potentially affected people is usually as-sessed based on inhomogeneous spatial units, such as the municipality or the parish (e.g. dos Santos et al., 2014; Guillard-Gonçalves et al., 2015), and on census data, which mainly indicate the night-time distribution of the population (e.g. Freire and Aubrecht, 2012; Aubrecht et al., 2013; Fraser et al., 2014; Tavares and Santos, 2014). For this reason some authors tried to evaluate the population fluctuation (daily, seasonal, historical) in order to assess the distribution of ex-posed people (e.g. Keiler, 2004; Keiler et al., 2005; Freire and Aubrecht, 2012; Schwendtner et al., 2013). Aubrecht et al. (2010) provided a detailed approach in a 13 km2area by adding information about building height (as proxy of build-ing capacity) and buildbuild-ing use (residential, public, commer-cial, others) to a high-resolution land cover map. Freire et al. (2012) used a 3-D model of buildings to estimate how many people would need to be evacuated from a 2.5 km2 estuarine area in Lisbon in the case of a tsunami. Fuchs et al. (2015) assessed exposure to several hazard phenomena in Austria based on unusually detailed property data infor-mation; for example the height of buildings, net area, con-figuration, main usage and number of people per building. Although quite detailed methods for the disaggregation of people and for counting the number of people exposed to a hazard have already been tested, they are not adjusted for widespread use, e.g. over areas of hundreds of square kilo-metres, as they need highly detailed information.
Therefore, the scale of the analysis as a proxy of data de-tail is a major support to vulnerability assessment, namely when assessing population exposure. Although overall vul-nerability models are consistent at different scales, the aims and variables that drive an analysis at municipal scale are dif-ferent from those used at the town scale, whereby a rescal-ing of approaches is essential (Mendes et al., 2010; Tavares and Santos, 2014; Tavares et al., 2015). Additionally, there are countries like Portugal where, due to privacy policies,
the best source of population data (e.g. census) is only available with aggregated information, which distorts reality. Even in the smallest census units, such as the basic census unit (BCU), homogeneity is not always achieved. In these cases, the assumption of homogeneity leads to an error that increases with diversity of use (e.g. residential, commercial and agricultural). At best the BCU corresponds to city blocks in the urban areas in Portugal but it may have a huge variation in size in sparsely populated rural areas, which constrains the accurate assessment of the location of people exposed. Even if the data were collected individually an aggregation would be done, which implies the assumption of a uniform distribution of people inside the aggregation unit, i.e. popu-lation could be distorted (e.g. Fisher and Langford, 1996; Su et al., 2010). In addition, people can be concentrated in spe-cific places within a BCU. Therefore, a better resolution of population data is needed.
In order to obtain a finer spatial distribution of the pop-ulation, different methods and data can be used, mainly when considering different scale approaches (Aubrecht et al., 2013). The adopted methodology and obtained results are de-pendent on the type and quality of the input data used as an-cillary information to disaggregate data (Su et al., 2010). In fact, on global scales (from world to regional scale), the tool used to disaggregate general information is frequently a land use map or an accessibility map that allows a spatial discrim-ination of the population between urban and rural areas to be made (e.g. Eicher and Brewer, 2001; Mennis and Hultgren, 2006; Reibel and Agrawal, 2007; Langford, 2007; Langford et al., 2008; Gallego, 2010; Steinnocher et al., 2011). The drawback of these approaches is the limited spatial resolu-tion of the land use map, which leads to overestimaresolu-tion or underestimation of the population in sparsely populated ar-eas (Steinnocher et al., 2011; Aubrecht et al., 2013). At local scales (municipality to parish), due to the detailed input data, it is possible to consider urban systems with finer grid cells and to take into account parameters such as built-up areas, roads typology or population fluctuation as weighting fac-tors (e.g. Keiler, 2004; Reibel and Bugalino, 2005; Freire and Aubrecht, 2012; Fuchs et al., 2013).
1.3 Objectives
In this framework, the major aim of our work is to develop a methodology to assess population exposure to deep rota-tional slides and to increase the population resolution over large areas. Population exposure is based on a detailed land-slide susceptibility map (pixel 5 m) (Garcia, 2012), the res-ident population from the official national statistics (Por-tugal Population and Housing Census 2011) and a build-ing footprint layer, as ancillary information. A major goal of the current work is to assess the distribution of people across the various buildings. This can be considered an in-termediate and quick approach in relation to coarser assess-ments (e.g. parish level) and detailed and time-consuming
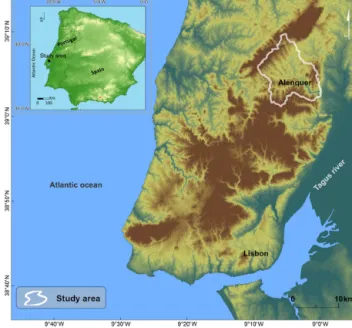
Figure 1. Location of Alenquer study area.
local approaches. Additionally, the differences between ex-posed people are assessed by comparing a more traditional approach (considering population per census unit) with the approach that considers people distributed per building. This finer distribution is based on dasymetric mapping, which is a cartographic technique that uses ancillary information to increase the resolution of the coarser input data. The present study is applied on the Alenquer River basin which is located to the north of Lisbon (Portugal).
2 Study area
The study area is the Alenquer River basin (120 km2), which is located to the north of Lisbon (Fig. 1). The choice of this study area was based on three factors: (i) landslides inci-dence, (ii) type of urban occupation and (iii) social vulner-ability.
i. The study area is located to the north of the Lisbon re-gion and is a landslide prone area (Zêzere et al., 2008). According to the DISASTER database (Zêzere et al., 2014) it is one of the areas in Portugal that has sustained severe landslide damage. The present work focuses only on deep rotational slides (depth of rupture zone > 3 m). These landslides are generally slow but encompass hori-zontal displacements capable of significantly damaging structures (e.g. houses) and consequently entailing the evacuation of people (Garcia, 2012).
ii. The study area presents two types of urban occupation: small villages with dense urban grids and disperse set-tlements. The census unit boundaries were influenced by settlement density; therefore the existence of two
dif-ferent types of territorial occupation in the study area al-lows the comparison of the proposed methodology ap-plied to two different urban contexts.
iii. The study area is, theoretically, one of the least pre-pared for dealing with landslide consequences within the region north of Lisbon. According to Mendes et al. (2010), who evaluated the social vulnerability at the municipal scale in Portugal, the Alenquer municipality has a medium criticality (defined as “the ensemble of in-dividuals’ characteristics and behaviours that may con-tribute to the system’s rupture”) and low capability (de-fined as “the set of territorial infrastructures that enables the community to react in case of disaster”).
The elevation in the study area ranges from 20 to 375 m and the major landforms are hills and fluvial valleys, which are strongly controlled by differences in resistance of the bedrock, such as sandy marl (particularly prone to rotational landslides), sandstone and limestone. Fieldwork and aerial photo interpretation allowed for the identification and map-ping of 136 rotational slides (0.98 landslides km−2), which generated a total unstable area of 663 508 m2(0.56 % of the study area) (Garcia, 2012).
Concerning human occupation, the study area has 15 253 inhabitants (Portugal Population and Housing Cen-sus 2011), most of whom live in the village of Alenquer located in the SE sector of the study area (Fig. 1). The re-maining population lives in small villages scattered in an area where agriculture is the dominant activity. Cadastral cartog-raphy and fieldwork identified over 6889 residential build-ings that were included in this work. Considering the BCU as the best census spatial resolution available for population data, the area is covered by 676 BCU with a wide range of surfaces (minimum: 280 m2; mean: 176 100 m2; maximum: 4.4 km2). The mean BCU population is 26 inhabitants (dis-regarding the 10 % BCU that have no inhabitants) and the maximum population per BCU is 357 inhabitants.
3 Data and methodology
The most detailed public information about the population in Portugal comes from the national census, the BCU, in which the smallest territorial units correspond to city blocks. However, these units are inhomogeneous in space, and con-sequently in the number of buildings and inhabitants, namely in rural areas or rural–urban transition areas, that form the study area.
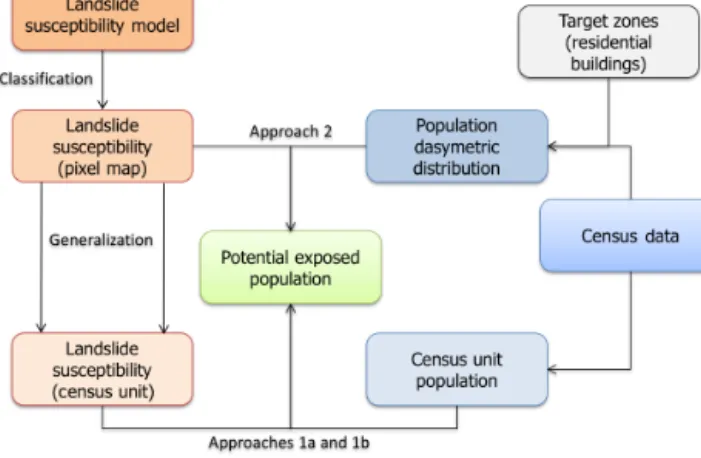
The general methodology of assessing exposed popula-tion in two different terrain units comprises three main steps (Fig. 2):
i. the assessment and classification of landslide suscepti-bility for both spatial units (pixels and BCU). When us-ing BCUs, it is mandatory to employ a generalization technique;
Figure 2. General methodological work flow.
ii. the evaluation of population distribution considering the different spatial entities (BCUs and target zones within BCUs);
iii. the integration of susceptibility and population distribu-tion for calculating the number of potentially exposed inhabitants in each susceptibility class based on differ-ent spatial differ-entities (referred to in ii).
3.1 Landslide susceptibility
Landslide susceptibility was assessed at the pixel level us-ing the information value method (Yin and Yan, 1988), which is a Bayesian bivariate statistical model that has been shown to be suitable for landslide susceptibility assessment (e.g. Piedade et al., 2011; Guillard and Zêzere, 2012, Pereira et al., 2012; Oliveira et al., 2015 and references therein); it has further been recommended as a method for data-driven landslide susceptibility assessment worldwide (Corominas et al., 2014). The susceptibility assessment procedures were based on the work of Garcia (2012), namely, a landslide in-ventory based on fieldwork and the interpretation of aerial photos with 0.5 m resolution. The landslide database includes only deep rotational slides (rupture surface deeper than 3 m), which were divided into two independent groups based on temporal criteria, one used for modelling landslide suscep-tibility and the other used for the independent validation of the landslide susceptibility model. The landslide modelling group includes all the rotational slides that occurred up to the regional landslide event of March 2010 (Zêzere and Trigo, 2011) (104 cases) and the landslide validation group includes all the rotational slides that occurred during that landslide event (32 cases).
Six landslide predisposing factors were used as indepen-dent variables: slope, lithology, land usage, inverse of wet-ness index, morphostructural units and soil type. Lithology, soil type and land use were based on national official cartog-raphy at 1 : 25 000 scale. The slope and the inverse of wetness index were derived from a digital elevation model (DEM)
built based on a 5 m-contour topographical map. The mor-phostructural map was obtained by combining the aspect map derived from the DEM with information on dipping di-rection of lithological layers obtained from geological maps and fieldwork.
The susceptibility model was further validated using suc-cess rate curves, prediction rate curves (Chung and Fabbri, 2003, 2008) and calculating the area under the curves (AUC) (Swets, 1988).
The final susceptibility model was made with a 5 m-resolution pixel and was classified using five quantile classes; i.e. each landslide susceptibility class includes 20 % of the study area. The option for the classification based on a quan-tile method aims to get susceptibility classes of similar sizes without assigning importance a priori to any of those classes based on their sizes. However, to use census unit maps a sus-ceptibility value should be addressed to each BCU. So, in a subsequent step the classified pixel-based landslide suscepti-bility map was overlaid onto the BCU map (vector structure), and a landslide susceptibility classification was attributed to each BCU. The generalization was made using two dif-ferent techniques: (i) the BCU susceptibility class was de-fined according to the majority landslide susceptibility class presented in the BCU, and (ii) the overall susceptibility of the BCU is the weighted average of identified susceptibility classes.
3.2 Population distribution and exposure
The potentially exposed population to landslide risk was as-sessed using the 2011 census data. The inhabitants were dis-tributed by BCU and by the residential buildings within each BCU using dasymetric cartography.
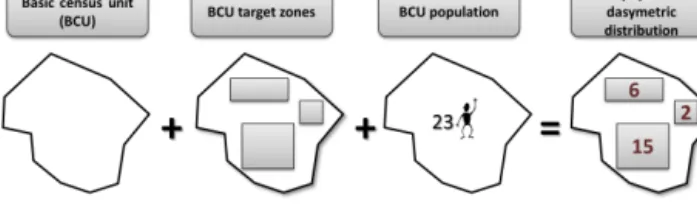
Dasymetric cartography is a classic approach (Wright, 1936) that has recently been used as an analytical tool, us-ing geographic information systems (e.g. Eicher and Brewer, 2001; Mennis and Hultgren, 2006). Dasymetric cartogra-phy use ancillary information to increase the resolution of coarser input data. A set of target zones should be defined and then, based on areal interpolation or other weighting algorithms, the input data should be disaggregated to esti-mate, for example, the population in a set of smaller units based on the known population for the global unit (e.g. Flow-erdew and Green, 1992; Langford and Unwin, 1994; Men-nis, 2003; Holt et al., 2014; Wu et al., 2008; Su et al., 2010; Tapp, 2010). In this work the dasymetric approach was per-formed following a binary analysis over residential build-ing/not residential building areas (Fig. 3). The building layer (1 : 10 000 vector map from Alenquer municipality) has at-tribute fields that allows for differentiating the types of ser-vices and commercial buildings (e.g. police stations, fire sta-tions, schools, court, medical facilities). Additionally, during detailed fieldwork the non-residential buildings were iden-tified (e.g. storage buildings, factory buildings) and that in-formation was added to the original database. All the other
Figure 3. Schematic dasymetric evaluation of population based on target zone area.
buildings were regarded as intended for residential use. How-ever, some buildings could have more than one function. In the present work all the buildings that were exclusively resi-dential or mainly resiresi-dential were considered to be ancillary information. The remaining buildings were not considered target zones and they were not assigned any population.
Thus, the first step is the definition of target zones. In this work a layer with the residential buildings was used. Dis-aggregation methods based on cadastral information are the best approach to a realistic population distribution/location (Maantay and Maroko, 2009). By overlaying BCUs onto the buildings (both in a vector structure), it is possible to identify the potentially inhabited areas (target zones) in each statisti-cal unit.
Two different population densities were calculated, con-sidering the target zones and the BCUs. To compare the ob-tained results within BCUs and target zones, density maps were classified accordingly to a standard deviation method.
The second step was the weighting of each target zone, i.e. the importance of each building (Wtzi) inside a specific
BCU. In the present work, the area of the building was the sole parameter considered for weighting the importance of the target zone because the available census data (Portugal Population and Housing Census 2011) are aggregated at the BCU level and the layer of the ancillary cadastral informa-tion (buildings) only has the footprint, disaggregated for each individual house.
The third step is the dasymetric distribution of the popula-tion in each polygon of target zones (Ptzi) as shown in Eq. (1)
(adapted from Su et al., 2010): Ptzi= Pt×Wtzi n P i=1 Wtzi , (1)
where Wtzi is the weight of each target zone in the BCU and
Ptis the total population in the BCU. This procedure was ap-plied independently to each BCU to distribute the population between the buildings in each unit. After disaggregation the total number of inhabitants per BCU is maintained.
The last step was the assessment of the number of people exposed in each landslide susceptibility class. For this pur-pose an integration between the susceptibility map and pop-ulation distribution is needed. In the case of BCUs as terrain units, the assessment is direct because each BCU is classified
within a single susceptibility class (Sect. 3.1) and has a popu-lation assigned by the census. On the contrary, if target zones (buildings) are used as terrain units, parts of a single build-ing can fall into different susceptibility classes. In these cases it was necessary to convert the target zones from vectors to a grid structure, consistent with the 5 m-resolution suscepti-bility map. The population in each building is then equally distributed between the pixels that cover that building. For example, a 100 m2 building (converted in 4 pixels of 5 by 5 m) that has eight inhabitants will have two inhabitants in each pixel in the final population distribution. The conversion of the target zones from vectors to a grid structure was only made to assess the number of people exposed in each sus-ceptibility class and therefore to easily compare the results obtained from the approaches. So, for practical purposes the population is assigned to each building and not to a pixel.
Finally, the assessment of the number of inhabitants in each susceptibility class was performed for three different approaches: (i) the susceptibility map was generalized to BCU according to the majority class, and the entire BCU population was assigned to that specific susceptibility class (approach 1a); (ii) the susceptibility map was generalized to BCU according to weighted mean of susceptibility classes in that unit, and the entire BCU population was assigned to that specific susceptibility class (approach 1b); and (iii) the sus-ceptibility map is in pixel units (without generalization), and the population (dasymetric distributed) was assigned to the susceptibility class of the pixel (approach 2).
4 Results
The landslide susceptibility map (pixel terrain unit) valida-tion yields acceptable results with a 0.76 AUC for the suc-cess rate curve and 0.78 AUC for the independent validation with the prediction rate curve.
Figure 4 shows the obtained landslide susceptibility maps using different terrain units and generalization techniques: (a) a pixel-based map, (b) a BCU vector structure map according to the dominant susceptibility class inside each BCU and (c) a BCU vector structure map according to the weighted average susceptibility class in each BCU.
The visual differences between the maps are evident, mainly between the BCU susceptible map classified with the weighted average susceptibility (Fig. 4c) and the other maps. In fact, the use of the weighted average generates a signifi-cant decrease of the importance of the extreme classes (very high and very low). The differences between the two gen-eralization methods are significant (Fig. 4b and c), showing a 5-fold increase in the importance of the moderate class in approach 1b (Table 1). However, the visual agreement be-tween maps 4a and 4b is evident. Although the homoge-nization of the susceptibility classes per BCU leads to an increase of about 8 % of the area classified with very high susceptibility (Table 1), when the three highest susceptible
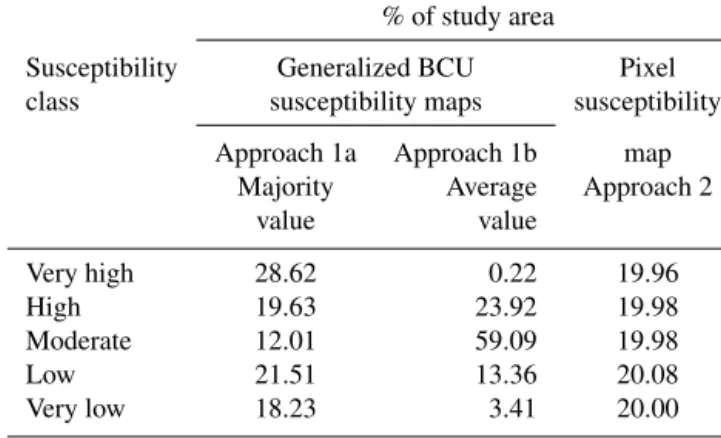
Table 1. Landslide susceptibility classes (%) in the Alenquer study area considering approach 1a (BCU susceptibility generalization considering the majority susceptibility class), approach 1b (BCU susceptibility generalization considering the weighted average sus-ceptibility) and approach 2 (pixel-based susceptibility map).
% of study area
Susceptibility Generalized BCU Pixel class susceptibility maps susceptibility
Approach 1a Approach 1b map Majority Average Approach 2
value value Very high 28.62 0.22 19.96 High 19.63 23.92 19.98 Moderate 12.01 59.09 19.98 Low 21.51 13.36 20.08 Very low 18.23 3.41 20.00
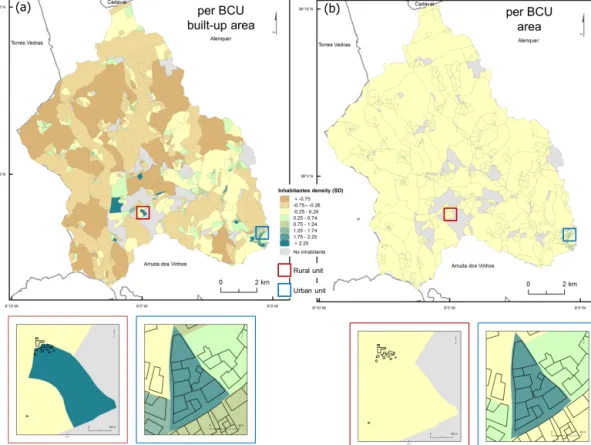
classes are combined their overall representation remains equal to the pixel map model (60 % of the total study area). Conversely, the same three susceptibility classes extend to 83 % of the total study area in the weighted average sus-ceptibility map, namely due to the overrepresentation of the moderate class. When evaluating population densities the use of different spatial units (BCUs and BCU built-up ar-eas) shows, as expected, considerable differences (Fig. 5). In fact, if a common approach is adopted and BCUs are classified according to their overall area (population density per BCU area), density values (mean: 0.002 inhabitants m−2; SD: 0.003) are around 1 order of magnitude lower when compared with results obtained considering only the built-up area (population density per BCU residential building area) (mean: 0.011 inhabitants m−2; SD: 0.009). Addition-ally, Fig. 5 shows that in high building density terrain units (blue outline squares), the registered population density hi-erarchy remains similar in maps (a) and (b), whereas in ru-ral terrain units (red outline squares) differences can be con-siderable (more than 2 standard deviations in the example shown). These differences are relevant in areas similar to the ones in the case study in which the majority of BCUs (73 %) have a residential built-up occupation below 20 %, which means that the use of total BCU area underestimates the population density.
Table 2 shows the results obtained regarding the number of potentially exposed population per susceptibility class con-sidering the three different approaches (1a, 1b and 2). It is clear that the number of exposed inhabitants changes consid-erably depending on the method used to estimate the popu-lation. The approaches 1a and 1b, in general, systematically generate a higher number of inhabitants in the three highest susceptibility classes than approach 2. The only exception is in approach 1b wherein the population assigned to the very high susceptibility class has only 31 inhabitants, which is
ex-Figure 4. Deep rotational slides (depth of rupture zone > 3 m) susceptibility maps in the Alenquer study area: (a) approach 2 (pixel-based unit), (b) approach 1a (basic census unit classified according to the majority susceptibility), (c) approach 1b (basic census unit classified according to the weighted average of the susceptibility).
plained by the diminished importance of this susceptibility class when the generalization is based on the average suscep-tibility. In fact, when the generalization of the susceptibility map is carried out, the percentage of exposed people is 29 % (approach 1a) and 35 % (approach 1b) of the total popula-tion. In contrast, when the most detailed susceptibility map is used, allowing the use of the dasymetric distribution of pop-ulation, the number of exposed inhabitants is much smaller (1926 people, 13 % of total inhabitants). The percentage of people exposed in the three most susceptible classes, within approach 1a, exceeds 132 % features of approach 2, which means that 2539 inhabitants are overestimated when using approach 1a. In addition, for practical use in emergency man-agement, approach 2 allows for the cartographic expression of people per building (Fig. 6), which is not the case in ap-proaches 1a and 1b.
5 Discussion
In this work, three different approaches were used to evaluate the number of potentially exposed inhabitants in a test site located in the Alenquer municipality.
The use of census data as a source of population data requires two major assumptions: (i) the resident population does not change in time and (ii) people are located at home. These are strong assumptions in the sense that residents are presumed to be at home at all times and that it does not take into account the fact that people living outside the study area might actually be in the study area. In fact, this is far from reality because people move around during the day. How-ever, in what concerns the study area there are no data about daily or seasonal fluctuation of population either at the build-ing scale or at the considered statistical unit. So, the above
Figure 5. Population density in the Alenquer study area (a) per BCU built-up area, (b) per BCU overall area. To facilitate visualization, the classification of target zones in map (a) was extended to the complete BCU.
Table 2. Potentially exposed population per susceptibility class in the Alenquer study area considering approach 1a (BCU suscepti-bility generalization considering the majority susceptisuscepti-bility class), approach 1b (BCU susceptibility generalization considering the weighted average susceptibility) and approach 2 (pixel-based sus-ceptibility map).
Potentially exposed population
Susceptibility BCU population distribution BCU population
class per building
Approach 1a Approach 1b Approach 2
Very high 1840 31 430
High 1201 1230 675
Moderate 1424 4197 821
Low 1639 4692 1454
Very low 9149 5103 11 873
scenarios can be considered the worst case scenarios for the resident people but the fluctuations during day/night to work, school or other outdoor activities should not be neglected. Additionally, the use of the worst case scenario is supported by the work of Pereira et al. (2016) which found that, in the period 1865–2010, the majority of landslide fatalities
oc-Figure 6. Potentially exposed population in Alenquer assigned to each building (approach 2).
curred while people were indoors (60 %) whereas 40 % oc-curred when people were outdoors or in a vehicle.
Once the population data are available in statistical units the use of these data implies the generalization of the
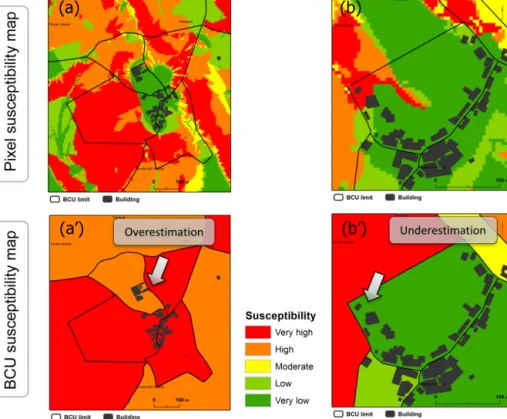
land-Figure 7. Examples of overestimation and underestimation of exposed buildings in the Alenquer study area considering the BCU suscepti-bility map in comparison with the pixel-based susceptisuscepti-bility map.
slide susceptibility map from the raster structure to the sta-tistical unit. Conversely, the approach that considers target zones (buildings) within each BCU to distribute population enables the use of the original landslide susceptibility map with 5 m-resolution pixels .
Independently of the approach, some uncertainties are present which affect the obtained results. In fact, the classifi-cation of the “original” landslide susceptibility map (pixel based) is needed to generate landslide susceptibility maps based on statistical units. The number of classes and the cho-sen method used to generalize the susceptibility may produce differences in the obtained results if the range of classes is higher and the importance of each class is significantly dif-ferent, because this influences the number of inhabitants in each class. However, the focus of this work is not to evalu-ate how classification methods or different number of sus-ceptibility classes influence the assessment of exposed in-habitants. Hence the option for the classification based on a quantile method that aims to get susceptibility classes with similar sizes without assigning importance a priori to any of those classes based on their sizes. Moreover, the number of people in each susceptibility class is only used to compare the adopted approaches. Even though the number of people per susceptibility class can change, it does not affect the dis-tribution of people per buildings because it is independent of the number of susceptibility classes.
Indeed, part of the differences observed between the ex-posed population in approach 2 and approaches 1a and 1b is due to the generalization process of landslide susceptibil-ity per BCU, which can generate an overestimation or un-derestimation of the total area of each susceptibility class when compared to the pixel-based susceptibility map. As a consequence, the classification of the same building can be very diverse in the produced landslide susceptibility maps (pixel based and BCU based) (Fig. 7). In a few cases a build-ing located in the very high susceptibility class in the pixel-based map is classified as having very low susceptibility in the BCU-based map, due to large spatial expression of that class within the BCU terrain unit (Fig. 7b), thus producing an underestimated exposure to landslide hazard. However, in the majority of cases, buildings are located in a very low sus-ceptibility class in the pixel-based map but, due to the gener-alization of susceptibility they become included in the very high susceptibility class in the BCU-based map (Fig. 7a), thus producing an overestimated exposure to landslide haz-ard. The use of the majority class as a classification method in the BCU susceptibility map is a source of error that tends to overestimate exposure of buildings and indirectly the ex-posure of inhabitants.
On the other hand, the use of a weighted average classifica-tion tends to overemphasize the importance of the mean sus-ceptibility class and underestimate the extreme sussus-ceptibility classes. When using statistical unit susceptibility, an
analy-sis should be carried out on the previous classification of the susceptibility map (in pixel structure) to evaluate the consid-erable changing area of the landslide susceptibility classes which will be reflected in the obtained results of people expo-sure. However, independently of the previous tests this kind of approach always has a large degree of generalization once it assumes that all spatial units are homogeneous in terms of landslide susceptibility.
Approach 2 is based on a detailed pixel-based susceptibil-ity map and does not require the generalization of landslide susceptibility, which is a major advantage of this method. Approach 2 is a user-friendly methodology that allows for improving the accuracy of the population spatial distribution and consequently improves the evaluation of the number of inhabitants exposed to a hazardous phenomenon. However, this approach is not free from uncertainties. The definition of target zones is one source of uncertainty. Therefore a binary classification that takes into account the residential use of the building was done. Despite the fact that the generality of the buildings have their use officially classified in the building layer database and fieldwork validation had been carried out, not all the buildings were individually validated, which is a source of uncertainty. However, we consider that the errors associated to this uncertainty can be neglected due to three reasons: (i) the majority of buildings have an exclusively res-idential use (93 %) and the buildings which have more than one type of use are small in number (5 % of total buildings); (ii) the vast majority of the buildings (96 %) in the study area have up to two floors, and (iii) once only the area of the building is considered and “double” functions of build-ings are confirmed, usually in different floors of the building (e.g. ground floor – commercial, 1st floor – residential), the effective area considered a target zone is correct even if the ground floor is not for residential usage.
The weighting of each target zone is another source of uncertainty. In fact, equal building areas can have differ-ent numbers of floors, differdiffer-ent numbers of bedrooms, and consequently a potentially different number of inhabitants, which is probably the major cause of uncertainty of this study. However, as already mentioned, 96 % of the buildings are in the same class regarding the number of floors (1–2), and buildings with higher numbers of floors are located in urban areas where the BCU are homogeneous and small in size. Therefore, we are confident that the achieved overall population distribution values are representative of the real-ity in the study area. Despite some uncertainties related to the distribution of people in the buildings, particularly in the more susceptible zones, this approach is definitely closer to reality than the one that takes the total population from BCU (the finest public population information available), since the susceptibility in BCUs is far from homogeneous.
In practical terms, the use of approach 2 allows for esti-mating the number of exposed people in each building using cartography, which is important for risk analysis and emer-gency management. Although this can be considered a coarse
distribution, because only the area was used to weight the importance of each building, this is a more detailed approach than the use of the total population per statistical unit.
Despite the described uncertainties, in real emergency sit-uations when three or four identified buildings were affected by a landslide, quickly gaining knowledge of the approxi-mate number of potential victims is essential for the correct allocation of rescue resources.
In this work, people were always assumed to be at home, which is a drawback for the analysis. In addition, the build-ing resistance was not accounted for and the assessment of the exposed inhabitants is insufficient to demonstrate the real exposure of people to landslide hazard. Topics such as the degree of vulnerability due to a person’s own characteristics (e.g. mobility, age, education and number of years living in the building) and due to existing infrastructures and facili-ties (e.g. sewerage, water or electricity supply, medical care) should be considered in a broader and more complete study.
Nowadays, it is assumed that analysing the vulnerability of the elements at risk may be the key to risk reduction (Papathoma-Köhle, 2016) and that detailed information on the characteristics and types of the current building func-tionality, dimension and number of residents would enhance the significance of the results with respect to exposed citi-zens (Fuchs et al., 2015). Lastly, considering that physical vulnerability can be related to the fact that a person is in-side a building, a more detailed distribution of people inin-side buildings complemented with information on building resis-tance, such as construction materials, age or maintenance, would be essential to landslide risk management and to sup-port the implementation of mitigation strategies. Summing up, for an integrated vulnerability study it is necessary that physical damages (building, persons) but also functionality (e.g. infrastructures, services) and the social community as a whole are included. The already mentioned topics associated to the population fluctuation data, the improvement of the classification of building typology and the use of additional variables to weight target zones are included in the working hypothesis to improve the obtained results.
6 Conclusion
From the point of view of a general cost–benefit analysis, the census data (available and free of charge in Portugal) and the digital maps with building footprint (available or easily acquirable through digital image interpretation), taken as an-cillary information to dasymetric mapping approach, prove to be a good option for increasing the resolution of the pop-ulation distribution at the regional/municipal scale and it can be considered a first approach to identify sites where future detailed surveys should be developed. Additionally it allows for fast, partial (per BCU) or global upgrades every time new information (e.g. population, building environment or land-slide susceptibility) is provided.
Thus, the methodology developed using dasymetric car-tography for the population distribution reveals three main advantages: (i) the increase in population resolution, which allows a more detailed evaluation of the number of inhab-itants potentially affected by a hazardous event; (ii) the in-crease in population resolution, which allows the use of de-tailed susceptibility maps to avoid generalization procedures that cause undesired homogenization of the data; and (iii) the location of people confined to an area (buildings) with phys-ical limits (not administrative nor statistphys-ical), which can be easily recognized by those responsible for civil protection, planning and emergency management. This is not the case when the analysis is performed using a grid-cell-based map. However, some uncertainties related to the dasymetric pop-ulation distribution are present, generally associated to three main assumptions that have to be adopted: (i) the binary clas-sification of the use of the building (residential/not residen-tial), (ii) people are always inside the buildings, and (iii) the building area was considered to be the only proxy of the num-ber of inhabitants per building.
The proposed methodology can be applied to multi-hazard studies and it is useful in both situations, considering the following probability–intensity relations: (i) low-probability and high-magnitude phenomena that can result in a high level of damage, and (ii) high-probability and lower-magnitude events that are expected to result in a few affected elements. In both cases, the estimation of the number of inhabitants per building will be useful for increasing the efficiency of ac-tions taken by civil protection agencies. In fact, bearing in mind the potentially affected inhabitants, the prioritization of buildings will enhance the accuracy of rescue operations. In the case of events that cause generalized damages over a large territorial extension, the focus on a specific building will not be so important because the whole region is affected. The exception can occur in low-density urbanization areas and in buildings where a high concentration of people is ex-pected. In case of low-magnitude and high-frequency events, local damages gain importance and therefore the proposed approach can be more useful. However, this understanding is completely dependent on the type of process, elements at risk and civil protection procedures, among many other fac-tors that influence emergency management operations.
Lastly and in spite of our good results, we would like to point out that assessing exposure of inhabitants is just a first step towards a desirable, integrated vulnerability analysis and a complete risk analysis.
7 Data availability
Portugal Population and Housing Census 2011 is avail-able on Statistics Portugal institute official website. Data and cartographic information are available online at http://censos.ine.pt/xportal/xmain?xpgid=censos2011_ apresentacao&xpid=CENSOS.
Garcia (2012) is available online in the repository of the University of Lisbon (http://hdl.handle.net/10451/7377).
Author contributions. Ricardo A. C. Garcia and Sérgio C. Oliveira performed fieldwork for landslide inventory and cartography data base validation. Cartographical and statistical input data, suscepti-bility modelling and dasymetric cartography adaptation were car-ried out by Ricardo A. C. Garcia that prepared the manuscript with contributions from all co-authors (that supervised all the work de-velopment).
Acknowledgements. The authors would like to thank Maria Papathoma-Köhle and Alexandre Tavares whose in-depth review, constructive comments and suggestions contributed to improving the quality of the final manuscript. The authors acknowledge the copy-editor, Manisha Gandhi, whose English language changes were really appreciated.
This work is part of the project FORLAND – Hydro-geomorphologic Risk in Portugal: Driving Forces and Appli-cation for Land Use Planning (PTDC/ATPGEO/1660/2014) financed by the Portuguese Foundation for Science and Tech-nology (FCT). Sérgio C. Oliveira obtained a Post-doctoral grant [SFRH/BPD/85827/2012] from the Portuguese Foundation for Science and Technology (FCT).
Edited by: S. Fuchs
Reviewed by: M. Papathoma-Koehle and A. Tavares
References
Aubrecht, C., Köstl, M., and Steinnocher, K.: Population exposure and impact assessment: Benefits of modeling urban land use in very high spatial and thematic detail, in: Computational Vision and Medical Image Processing: Recent Trends, Computational Methods in Applied Sciences, 19, Springer, Dordrecht, Heidel-berg, New York, London, 75–89, doi:10.1007/978-94-007-0011-6_4, 2010.
Aubrecht, C., Dilek, Ö, Steinnocher, K., and Freire, S.: Multi-level geospatial modeling of human exposure, patterns and vulnerabil-ity indicators, Nat. Hazards, 68, 147–163, doi:10.1007/s11069-012-0389-9, 2013.
Bell, R. and Glade, T.: Quantitative risk analysis for landslides – Ex-amples from Bíldudalur, NW Iceland, Nat. Hazards Earth Syst. Sci., 4, 117–131, doi:10.5194/nhess-4-117-2004, 2004. Bhaduri, B., Bright, E., Coleman, P., and Dobson, J.: LandScan:
Lo-cating People is What Matters, Geoinformatics, 5, 34–37, 2002. Brabb, E. E.: Innovative Approaches to Landslide Hazard and Risk
Mapping, in: Proceedings 4th International Symposium on Land-slides, Canadian Geotechnical Society, Toronto, 307–323, 1984. Chen, K., McAneney, J., Blong, R., Leigh, R., Hunter, L., and Mag-ill, C.: Defining area at risk and its effect in catastrophe loss es-timation: a dasymetric mapping approach, Appl. Geogr., 24, 97– 117, doi:10.1016/j.apgeog.2004.03.005, 2004.
Chung, C.-J. F. and Fabbri, A. G.: Validation of spatial prediction models for landslide hazard mapping, Nat. Hazards, 30, 451– 472, doi:10.1023/B:NHAZ.0000007172.62651.2b, 2003.
Chung, C.-J. F. and Fabbri, A. G.: Predicting landslides for risk analysis – Spatial models tested by a cross-validation technique, Geomorphology, 94, 438–452, doi:10.1016/j.geomorph.2006.12.036, 2008.
Corominas, J., van Westen, C., Frattini, P., Cascini, L., Malet, J.-P., Fotopoulou, S., Catani, F., Van Den Eeckhaut, M., Mavrouli, O., Agliardi, F., Pitilakis, K., Winter, M. G., Pastor, M., Ferlisi, S., Tofani, V., Hervas, J., and Smith, J. T.: Recommendations for the quantitative analysis of landslide risk, Bull. Eng. Geol. Environ., 73, 209–263, 2014.
Cruden, D. and Fell, R. (Eds.): Landslide risk assessment, in: Proceedings of the International Workshop on Landslide Risk Assessment, 19–21 February 1997, Honolulu, Hawai, USA, A. A. Balkema, Rotterdam, Brookfield, 1997.
Cutter, S. L., Boruff, B. J., and Shirley, W. L.: Social vulnera-bility to environmental hazards, Soc. Sci. Quart., 84, 242-261, doi:10.1111/1540-6237.8402002, 2003.
Dai, F. C., Lee, C. F., and Ngai, Y. Y.: Landslide risk assess-ment and manageassess-ment: an overview, Eng. Geol., 64, 65–87, doi:10.1016/S0013-7952(01)00093-X, 2002.
Deichmann, U., Ehrlich, D., Small, C., and Zeug, G.: Using high resolution satellite data for identification of urban natural risk, European Union and World Bank, Washington, 2011.
dos Santos, P. P., Tavares, A. O., and Zêzere, J. L.: Risk anal-ysis for local management from hydro-geomorphologic disaster databases, Environ. Sci. Policy, 40, 85–100, doi:10.1016/j.envsci.2013.12.007, 2014.
Eicher, C. L. and Brewer, C. A.: Dasymetric mapping and areal in-terpolation: implementation and evaluation, Cartogr. Geogr. In-form., 28, 125–138, doi:10.1559/152304001782173727, 2001. Evans, S. G.: Landslide risk – systematic approaches to assessment
and management, in Landslide Risk Assessment, in: Proceed-ings of the International Workshp on Landslide Risk Assessment, Honolulu, A. A. Balkema, Rotterdam, 25–50, 1997.
Fisher, P. and Langford, M.: Modeling sensitivity to accuracy in classified imagery: A study of areal interpolation by dasymet-ric mapping, Prof. Geogr., 48, 299–309, doi:10.1111/j.0033-0124.1996.00299.x, 1996.
Flowerdew, R. and Green, M.: Developments in areal inter-polation methods and GIS, Ann. Reg. Sci., 26, 67–78, doi:10.1007/BF01581481, 1992.
Fraser, S. A., Wood, N. J., Johnston, D. M., Leonard, G. S., Greening, P. D., and Rossetto, T.: Variable population expo-sure and distributed travel speeds in least-cost tsunami evacua-tion modelling, Nat. Hazards Earth Syst. Sci., 14, 2975–2991, doi:10.5194/nhess-14-2975-2014, 2014.
Freire, S. and Aubrecht, C.: Integrating population dynamics into mapping human exposure to seismic hazard, Nat. Hazards Earth Syst. Sci., 12, 3533–3543, doi:10.5194/nhess-12-3533-2012, 2012.
Freire, S., Aubrecht, C., and Wegscheider, S.: When the tsunami comes to town – improving evacuation modeling by integrat-ing high-resolution population exposure, in: Proceedintegrat-ings of the 9th International ISCRAM Conference, April 2012, Vancouver, Canada, 2012.
Fuchs, S.: Susceptibility versus resilience to mountain hazards in Austria – paradigms of vulnerability revisited, Nat. Hazards Earth Syst. Sci., 9, 337–352, doi:10.5194/nhess-9-337-2009, 2009.
Fuchs, S., Kuhlicke, C., and Meyer, V.: Editorial for the special is-sue: vulnerability to natural hazards – the challenge of integra-tion, Nat. Hazards, 58, 609–619, doi:10.1007/s11069-011-9825-5, 2011.
Fuchs, S., Keiler, M., Sokratov, S., and Shnyparkov, A.: Spatiotem-poral dynamics: the need for an innovative approach in moun-tain hazard risk management, Nat. Hazards, 68, 1217–1241, doi:10.1007/s11069-012-0508-7, 2013.
Fuchs, S., Keiler, M., and Zischg, A.: A spatiotemporal multi-hazard exposure assessment based on property data, Nat. Haz-ards Earth Syst. Sci., 15, 2127–2142, doi:10.5194/nhess-15-2127-2015, 2015.
Gallego, F. J.: A population density grid of the European Union, Popul. Environ., 31, 460–473, doi:10.1007/s11111-010-0108-y, 2010.
Galli, M. and Guzzetti, F.: Landslide vulnerability criteria: A case study from Umbria, central Italy, Environ. Manage., 40, 649– 664, doi:10.1007/s00267-006-0325-4, 2007.
Garcia, R. A. C.: Metodologias de avaliação da perigosidade e risco associado a movimentos de vertente: aplicação na bacia do rio Alenquer, PhD thesis, Universidade Lisboa, Lisboa, 2012. Guillard, C. and Zezere, J.: Landslide Susceptibility Assessment
and Validation in the Framework of Municipal Planning in Por-tugal: The Case of Loures Municipality, Environ. Manage., 50, 721–735, doi:10.1007/s00267-012-9921-7, 2012.
Guillard-Gonçalves, C., Cutter, S. L., Emrich, C. T., and Zêzere, J. L.: Application of Social Vulnerability Index (SoVI) and delin-eation of natural risk zones in Greater Lisbon, Portugal, J. Risk Res., 18, 651–674, doi:10.1080/13669877.2014.910689, 2015. Guillard-Gonçalves, C., Zêzere, J. L., Pereira, S., and Garcia, R. A.
C.: Assessment of physical vulnerability of buildings and anal-ysis of landslide risk at the municipal scale: application to the Loures municipality, Portugal, Nat. Hazards Earth Syst. Sci., 16, 311–331, doi:10.5194/nhess-16-311-2016, 2016.
Guzzetti, F.: Landslide fatalities and the evaluation of land-slide risk in Italy, Eng. Geol., 58, 89–107, doi:10.1016/S0013-7952(00)00047-8, 2000.
Guzzetti, F., Carrara, A., Cardinali, M., and Reichenbach, P.: Land-slide hazard evaluation: a review of current techniques and their application in a multi-scale study, Central Italy, Geomorphology, 31, 181–216, doi:10.1016/S0169-555X(99)00078-1, 1999. Guzzetti, F., Stark, C. P., and Salvati, P.: Evaluation of Flood and
Landslide Risk to the Population of Italy, Environ. Manage., 36, 15–36, doi:10.1007/s00267-003-0257-1, 2005.
Holt, J. B., Lo, C. P., and Hodler, T. W.: Dasymetric Estimation of Population Density and Areal Interpolation of Census Data, Cartogr. Geogr. Inf. Sci., 31, 103–121, doi:10.1559/1523040041649407, 2004.
HSE – Health and Safety Executive: The tolerability of Risk from nuclear power stations, revised, HMSO, London, UK, 1992. Kappes, M. S., Papathoma-Köhle, M., and Keiler, M.:
As-sessing physical vulnerability for multihazards using an indicator-based methodology, Appl. Geogr., 32, 577–590, doi:10.1016/j.apgeog.2011.07.002, 2012.
Karagiorgos, K., Thaler, T., Hübl, J., Maris, F., and Fuchs, S.: Multi-vulnerability analysis for flash flood risk management, Nat. Haz-ards, 82, 63–87, doi:10.1007/s11069-016-2296-y, 2016. Kaynia, A. M., Papathoma-Köhle, M., Neuhäuser, B., Ratzinger,
of vulnerability to landslide: Application to the village of Licht-enstein, Baden-Württemberg, Germany, Eng. Geol., 101, 33–48, doi:10.1016/j.enggeo.2008.03.008, 2008.
Keiler, M.: Development of the damage potential resulting from avalanche risk in the period 1950–2000, case study Galtür, Nat. Hazards Earth Syst. Sci., 4, 249–256, doi:10.5194/nhess-4-249-2004, 2004.
Keiler, M., Zischg, A., Fuchs, S., Hama, M., and Stötter, J.: Avalanche related damage potential – changes of persons and mobile values since the mid-twentieth century, case study Galtür, Nat. Hazards Earth Syst. Sci., 5, 49–58, doi:10.5194/nhess-5-49-2005, 2005.
Kienberger, S., Lang, S., and Zeil, P.: Spatial vulnerability units – expert-based spatial modeling of socio-economic vulnerability in the Salzach catchment, Austria, Nat. Hazards Earth Syst. Sci., 9, 767–778, doi:10.5194/nhess-9-767-2009, 2009.
Langford, M.: Rapid facilitation of dasymetric-based population interpolation by means of raster pixel maps, Comput. Environ. Urban Syst., 31, 19–32, doi:10.1016/j.compenvurbsys.2005.07.005, 2007.
Langford, M. and Unwin, D. J.: Generating and mapping popula-tion density surfaces within a geographical informapopula-tion system, Cartogr. J., 31, 21–26, doi:10.1179/000870494787073718, 1994. Langford, M., Higgs, G., Radcliffe, J., and White, S.: Ur-ban population distribution models and service accessibil-ity estimation, Comput. Environ. Urban Syst., 32, 66–80, doi:10.1016/j.compenvurbsys.2007.06.001, 2008.
Maantay, J. and Maroko, A.: Mapping urban risk: Flood hazards, race, & environmental justice in New York, Appl. Geogr., 29, 111–124, doi:10.1016/j.apgeog.2008.08.002, 2009.
Mendes, J. M.: Social vulnerability indexes as planning tools: beyond the preparedness paradigm, J. Risk Res., 12, 43–58, doi:10.1080/13669870802447962, 2009.
Mendes, J. M., Tavares, A. O., Freiria, S., and Cunha, L.: Social vul-nerability to natural and technological hazards: The relevance of scale, in: Reliability, Risk and Safety: Theory and Applications, vol. 1, edited by: Briš, R., Guedes Soares, C., and Martorell, S., Taylor & Francis Group, London, 445–451, 2010.
Mennis, J.: Generating Surface Models of Population Using Dasy-metric Mapping, Prof. Geogr., 55, 31–42, doi:10.1111/0033-0124.10042/abstract, 2003.
Mennis, J. and Hultgren, T.: Intelligent dasymetric mapping and its application to areal interpolation, Cartogr. Geogr. Inf. Sci., 33, 179–194, doi:10.1559/152304006779077309, 2006.
Michael-Leiba, M., Baynes, F., Scott, G., and Granger, K.: Regional landslide risk to the Cairns community, Nat. Hazards, 30, 233– 249, doi:10.1023/A:1026122518661, 2003.
Nathan, J. W., Burton, C. G., and Cutter, S. L.: Community variatons in social vulnerability to Cascadia-related tsunamis in the U.S. Pacific Northywest, Na. Hazards, 52, 369–389, doi:10.1007/s11069-009-9376-1, 2010.
Oliveira, S. C., Zêzere, J., L., Catalão, J., and Nico, G.: The contribution of PSInSAR interferometry to landslide haz-ard in weak rock-dominated areas, Landslides, 12, 703–719, doi:10.1007/s10346-014-0522-9, 2015.
Papathoma-Köhle, M., Neuhäuser, B., Ratzinger, K., Wenzel, H., and Dominey-Howes, D.: Elements at risk as a framework for assessing the vulnerability of communities to landslides, Nat.
Hazards Earth Syst. Sci., 7, 765–779, doi:10.5194/nhess-7-765-2007, 2007.
Papathoma-Köhle, M.: Vulnerability curves vs. vulnerability indi-cators: application of an indicator-based methodology for debris-flow hazards, Nat. Hazards Earth Syst. Sci., 16, 1771–1790, doi:10.5194/nhess-16-1771-2016, 2016.
Papathoma-Köhle, M., Kappes, M., Keiler, M., and Glade, T.: Physical vulnerability assessment for alpine hazards: state of the art and future needs, Nat. Hazards, 58, 645–680, doi:10.1007/s11069-010-9632-4, 2011.
Papathoma-Köhle, M., Keiler, M., Totschnig, R., and Glade, T.: Improvement of vulnerability curves using data from extreme events: debris flow event in South Tyrol, Nat. Hazards, 64, 2083– 2105, doi:10.1007/s11069-012-0105-9, 2012.
Pereira, S., Zêzere, J. L., and Bateira, C.: Technical Note: Assessing predictive capacity and conditional independence of landslide predisposing factors for shallow landslide susceptibility models, Nat. Hazards Earth Syst. Sci., 12, 979–988, doi:10.5194/nhess-12-979-2012, 2012.
Pereira, S., Zêzere, J. L., Quaresma, I., Santos, P. P., and San-tos, M.: Mortality Patterns of Hydro-Geomorphologic Disasters, Risk Anal., 36, 1188–1210, doi:10.1111/risa.12516, 2016. Petrucci, O. and Gullà, G.: A simplified method for
assess-ing landslide damage indices, Nat. Hazards, 52, 539–560, doi:10.1007/s11069-009-9398-8, 2010.
Piedade, A., Zezere, J. L., Garcia, R. A. C., and Oliveira, S.: Mode-los de suceptibilidade a deslizamentos superficiais translacionais na região a norte de Lisboa, Finisterra, 46, 9–26, 2011.
Promper, C. and Glade, T.: Multilayer-exposure maps as a ba-sis for a regional vulnerability assessment for landslides: ap-plied in Waidhofen/Ybbs, Austria, Nat. Hazards, 82, S111–S127, doi:10.1007/s11069-016-2311-3, 2016.
Promper, C., Gassner, C., and Glade, T.: Spatiotemporal patterns of landslide exposure - a step within future landslide risk analysis on a regional scale applied in Waidhofen/Ybbs Austria, Int. J. Disast. Risk Reduct., 12, 25–33, doi:10.1016/j.ijdrr.2014.11.003, 2015.
Ragozin, A. L. and Tikhvinsky, I. O.: Landslide hazard, vulner-ability and risk assessment in Landslides in research, theory and practice, in: Proceedings of the 8th ISL, Cardiff, Vol. 3, Thomas Telford, London, 1257–1262, 2000.
Reibel, M. and Agrawal, A.: Areal Interpolation of Population Counts Using Pre-classified Land Cover Data, Popul. Res. Policy Ver., 26, 619–633, doi:10.1007/s11113-007-9050-9, 2007. Reibel, M. and Bugalino, M. E.: Street-weighted interpolation
tech-niques for demographic count estimation in incompatible zone systems, Environ. Plan. A, 37, 127–139, doi:10.1068/a36202, 2005.
Remondo, J., Bonachea, J., and Cendrero, A.: Quantita-tive landslide risk assessment and mapping on the ba-sis of recent occurrences, Geomorphology, 94, 496–507, doi:10.1016/j.geomorph.2006.10.041, 2008.
Schwendtner, B., Papathoma-Köhle, M., and Glade, T.: Risk evo-lution: How can changes in the built environment influence the potential loss of natural hazards?, Nat. Hazards Earth Syst. Sci., 13, 2195–2207, doi:10.5194/nhess-13-2195-2013, 2013. Silva, M. and Pereira, S.: Assessment of physical vulnerability and
potential losses of buildings due to shallow slides, Nat. Hazards, 72, 1029–1050, doi:10.1007/s11069-014-1052-4, 2014.
Steinnocher, K., Köstl, M., and Weichselbaum, J.: Grid-based popu-lation and land take trend indicators – new approaches introduced by the geoland2 core information service for spatial planning, New Techniques and Technologies for Statistics, NTTS 2011, Brussels, 2011.
Su, M. D., Lin, M. C., Hsieh, H. I., Tsai, B. W., and Lin, C. H.: Multi-layer multi-class dasymetric mapping to estimate population distribution, Sci. Total Environ., 408, 4087–4816, doi:10.1016/j.scitotenv.2010.06.032, 2010.
Sutton, P., Elvidge, C., and Obremski, T.: Building and evaluating models to estimate ambient population density, Photogr. Eng. Re-mote Sens., 69, 545–553, doi:10.14358/PERS.69.5.545, 2003. Swets, J. A.: Measuring the accuracy of diagnostic systems,
Sci-ence, 240, 1285–1293, doi:10.1126/science.3287615, 1988. Tapp, A. F.: Areal Interpolation and Dasymetric Mapping Methods
Using Local Ancillary Data Sources, Cartogr. Geogr. Inf. Sci., 37, 215–228, doi:10.1559/152304010792194976, 2010. Tavares, A. O. and dos Santos, P. P.: Re-scaling risk governance
using local appraisal and community involvement, J. Risk Res., 17, 923–949, doi:10.1080/13669877.2013.822915, 2014. Tavares, A. O., Santos, P. P., Freire, P., Fortunato, A. B., Rilo, A.,
and Sá, L.: Flooding hazard in the Tagus estuarine area: The chal-lenge of scale in vulnerability assessments, Environ. Sci. Policy, 51, 238–255, doi:10.1016/j.envsci.2015.04.010, 2015.
UNISDR: 2009 UNISDR Terminology on Disaster Risk Reduction, Int. Strat. Disaster Reduct., Geneva, Switzerland, 1–30, 2009. Uzielli, M., Catani, F., Tofani, V., and Casagli, N.: Risk analysis
for the Ancona landslide – II: estimation of risk to buildings, Landslides, 12, 83–100, doi:10.1007/s10346-014-0477-x, 2014. Varnes, D. J. and International Association of Engineering Geol-ogy – Commission on Landslides and Other Mass Movements on Slopes: Landslide hazard zonation: a review of principles and practice, UNESCO, Paris, 1984.
Winter, M. G.; Smith, J. T., Fotopoulou, S., Pitilakis, K., Mavrouli, O., Corominas, J., and Argyroudis, S.: An expert judge-ment approach to determining the physical vulnerability of roads to debris flow, Bull. Eng. Geol. Environ., 73, 291–305, doi:10.1007/s10064-014-0570-3, 2014.
Wright, J. K.: A Method of Mapping Densities of Population: With Cape Cod as an Example, Geogr. Rev., 26, 103–110, doi:10.2307/209467, 1936.
Wu, S.-S., Wang, L. and Qiu, X.: Incorporating GIS build-ing data and Census housing statistics for sub-block-level population estimation, Prof. Geogr., 60, 121–135, doi:10.1080/00330120701724251, 2008.
Xanthopoulos, G.: Forest fire policy scenarios as a key element af-fecting the occurrence and characteristics of fire disasters, in: Proceedings of the 4th international wildland fire conference, Sevilla, 2007.
Yin, K. L. and Yan, T. Z.: Statistical prediction models for slope in-stability of metamorphosed rocks, in: Landslides, Proceedings of the 5th ISL, Lausanne, Balkema, Rotterdam, 1269–1272, 1988. Zêzere, J. L. and Trigo, R. M.: Impacts of the North Atlantic
Os-cillation on landslides in Hydrological, Socioeconomic and Eco-logical Impacts of the North Atlantic Oscillation in the Mediter-ranean Region, in: Advances in Global Change Research 46, Springer Science + Business Media B.V., Springer, Dordrecht, Heidelberg, London, New York, 199–212, 2011.
Zêzere, J. L., Oliveira, S. C., Garcia, R. A. C., and Reis, E.: Landslide risk analysis in the area North of Lisbon (Portugal): evaluation of direct and indirect costs resulting from a motor-way disruption by slope movements, Landslides, 4, 123–136, doi:10.1007/s10346-006-0070-z, 2007.
Zêzere, J. L., Garcia, R. A. C., Oliveira, S. C., and Reis, E.: Prob-abilistic landslide risk analysis considering direct costs in the area north of Lisbon (Portugal), Geomorphology, 94, 467–495, doi:10.1016/j.geomorph.2006.10.040, 2008.
Zêzere, J. L., Pereira, S., Tavares, A. O., Bateira, C., Trigo, R. M., Quaresma, I., Santos, P. P., Santos, M., and Verde, J.: DIS-ASTER: a GIS database on hydro-geomorphologic disasters in Portugal, Nat. Hazards, 72, 503–532, doi:10.1007/s11069-013-1018-y, 2014.