Faculdade de Engenharia da Universidade do Porto
A Decision Support System for Investments in Public
Transport Infrastructure
Marcos Paulo Schlickmann
Submitted in partial fulfilment of the requirements for the degree of
Ph.D. in Transportation Systems
Supervisors: Doctor Luís Miguel Garrido Martínez
Prof Doctor Jorge Manuel Pinho de Sousa
ii
iii
iv
ABSTRACT
When public authorities face the need to improve a transportation system, they normally have to make a difficult choice among a set of technological and operational alternatives. To help the correct evaluation of each alternative and its impacts, costs and benefits, it would be useful to have a decision support system (DSS) based on approaches such as Multi-Criteria Decision Analysis (MCDA) and/or Cost Benefit Analysis (CBA).
Among the many impacts caused by a public transportation system, typically those on the land use are not adequately considered in the decision-making processes, mainly because they are hard to monetize, they are often considered as value transfer instead of value creation, and they are too complex to be assessed by traditional transport modeling tools. To overcome these weaknesses, the objectives of this research are to identify and measure the impacts of transit systems on land use and accessibility, and to consider those impacts in decision-making processes, along with more traditional financial and transport related impacts. For this purpose, a DSS, combining a land use and transport model with a MCDA model, was developed. This system was assessed in a small case study, where Bus Rapid Transit (BRT) and Light Rail Transit (LRT) projects are presented, and in a real case study, the Green Line extension project in Boston, the USA.
The DSS incorporates a range of criteria and subcriteria organized in a hierarchical manner, covering a variety of decision aspects, expert opinions and sensitivity and risk analysis. It aims to more accurately, and realistically reflect uncertainties and exogenous conditions that may significantly affect the costs and the benefits of a project. Consequently, it facilitates public debate about investment alternatives, since it makes it possible to present, in a structured way, the decision problem to the affected community and decision-makers.
v
RESUMO
Quando as autoridades públicas enfrentam a necessidade de melhorar um sistema de transporte, têm normalmente de fazer uma escolha difícil entre um conjunto de alternativas tecnológicas e operacionais. Para ajudar a avaliação correta de cada alternativa e seus impactos, custos e benefícios, seria útil contar com um sistema de apoio à decisão (DSS) baseado em abordagens tais como Análise Multicritério (MCDA) e / ou Análise de Custo Benefício (CBA).
Entre os muitos impactos causados por um sistema de transporte público, tipicamente aqueles no uso do solo não são adequadamente considerados nos processos de tomada de decisão, principalmente porque são difíceis de monetizar, são geralmente considerados como transferência de valor em vez de criação de valor, e são muito complexos para serem avaliados por ferramentas de modelação de transporte tradicionais. Para superar essas fraquezas, os objetivos desta pesquisa são identificar e medir os impactos dos sistemas de transporte público sobre o uso do solo e a acessibilidade, e considerar esses impactos nos processos de tomada de decisão, juntamente com os impactos financeiros e de transportes mais tradicionais. Para isso, foi desenvolvido um DSS, combinando um modelo de uso do solo e transporte com um modelo MCDA. O DSS foi então aplicado em um pequeno estudo de caso ilustrativo, onde projetos de sistemas Bus Rapid Transit (BRT) e Light Rail Transit (LRT) são apresentados, e depois em um estudo de caso real, o projeto Green Line Extension em Boston, EUA.
O DSS incorpora uma série de critérios e subcritérios organizados de forma hierárquica, abrangendo uma variedade de aspectos de decisão, opiniões de especialistas e análises de risco e sensibilidade, de forma precisa e realista, refletindo incertezas e condições exógenas que podem afetar significativamente os custos e os benefícios de um projeto. Consequentemente, facilita o debate público sobre alternativas de investimento, uma vez que permite, de forma estruturada, apresentar o problema de decisão à comunidade afetada e aos decisores.
vi
ACKNOWLEDGEMENTS
This Ph.D. was a fantastic journey. I met so many interesting and inspiring people.
First, I would like to thank my supervisors, Luís Martínez and Jorge Pinho de Sousa. They were
great during the entire process. I would also like to thank professor Manuel Matos, Carla Monteiro and all MIT Portugal staff and professors.
Second, I would like to thank professor Chris Zegras for hosting me during my stay in Cambridge. I
want also to thank lecturer Mikel Murga, lecturer Fred Salvucci, professor Joe Ferreira and MIT friends from Boston BRT and LUTUncertainty projects and MIT staff for welcoming me and helping me with my research during my time at MIT back in 2015.
Third, I would like to thank Sebastian, we talked about everything and shared office at MIT. He is
a good friend, a friend for life. Cristina, Marco, António Lobo, Teresa and the remainder of my MIT Portugal friends must also receive my acknowledgements.
Fourth, I want to thank the experts from various countries who answered my survey.
Fifth, I want to thank my family back in Brazil and my in-laws here in Portugal for all the support
during this period.
Lastly – but most importantly – I want to thank my wife Sofia and my kids Gabriel and Rodrigo, for
all the love and support. You are the best things that happened in my life.
In addition, I am thankful to FCT for the scholarship SFRH/BD/52001/2012 and to FEUP for being such an incredible school.
vii
TABLE OF CONTENTS
Abstract ... iv
Resumo ... v
Acknowledgements ... vi
Table of Contents ... vii
Figures ... x
Tables ... xii
List of abbreviations ...xvi
1. Introduction ... 1
1.1. Motivation ... 2
1.2. Objectives ... 4
1.3. Research questions ... 5
1.4. Research methodology ... 5
2. Capital investment decision-making on Public Transport systems ... 9
2.1. Introduction ... 10
2.2. Definition of investment alternatives ... 13
2.3. Common decision parameters and aspects ... 24
2.4. Four-step model ... 35
2.5. Cost Benefit Analysis ... 37
2.6. Multi-Criteria Decision Analysis ... 39
2.7. Risk and uncertainty ... 42
2.8. The final choice ... 45
2.9. Conclusions and further research... 46
3. Land use and public transport decision-making ... 49
3.1. Introduction ... 50
3.2. Accessibility ... 51
3.3. Mixed-use, density and Transit Oriented Development ... 55
3.4. Property prices and Value Capture mechanisms ... 62
3.5. Forecasting land use changes ... 70
3.6. Evaluating land use changes ... 74
3.7. Conclusions and further research... 84
viii
4.1. Introduction and DSS requirements ... 88
4.2. Definition of criteria and subcriteria ... 92
4.3. Land use and transport models ... 93
4.4. Value functions ... 95
4.5. Sensitivity analysis ... 105
4.6. An illustrative small case study ... 106
4.7. Conclusions ... 134
5. Case study... 137
5.1. Introduction ... 138
5.2. MBTA ... 139
5.3. The Green Line extension project ... 142
5.4. Applying the approach to the GLX project ... 150
5.5. Conclusions ... 177
6. Conclusions and further research ... 181
6.1. Introduction ... 182
6.2. Conclusions on the methodological approach ... 182
6.3. Conclusions on the literature review ... 186
6.4. Conclusions on the Decision Support System ... 188
6.5. Conclusions on the case study ... 189
6.6. Strengths and shortcomings of the research and proposals for future work ... 189
Appendix... 193
A.1. Accessibility ... 194
A.2. Emissions ... 195
A.3. Capital cost, Revenues, Operating cost, Density and Mixed-use ... 197
A.4. Travel time ... 201
A.5. Mode share ... 202
A.6. Real Estate ... 212
A.7. E-mail example ... 212
A.8. List of experts ... 213
A.9. Survey responses ... 214
A.10. AM Home based work O/D matrices by mode ... 247
A.11. AM transit travel time skims ... 248
A.12. Transfer data ... 249
ix
x
FIGURES
Figure 1 – A decision tree ... 10
Figure 2 . A decision process ... 12
Figure 3 - ROW, system performance and costs (Source: Vuchic, 2007). ... 14
Figure 4 - BRT in Curitiba, Brazil and LRT in Porto, Portugal (Source: Wikipedia 2015). ... 19
Figure 5 - BRT station in Curitiba, Brazil and LRT station in Porto, Portugal (Source: Barcex 2011). ... 21
Figure 6 – Bus with a capacity of 260 passengers, operated in Curitiba. ... 22
Figure 7 - Trunk-feeder and direct services scheme ... 23
Figure 8 – Total mechanical failures (Source: FTA, 2016c). ... 32
Figure 9 – Road and rail accidents (Source: Litman, 2013a). ... 33
Figure 10 – Four-step model ... 36
Figure 11 – Linear and exponential normalization functions ... 41
Figure 12 - Tornado plots ... 44
Figure 13 -Theoretical land use transport feedback cycle (Source: Wegener, 2004). ... 50
Figure 14 - Accessibility by transit at AM peak period (Source: Accessibility Observatory, 2014).53 Figure 15 - A decision process incorporating accessibility ... 54
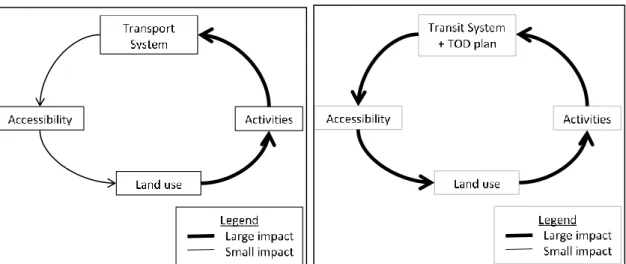
Figure 16 - Relationship between density and transit (Source: Guerra and Cervero 2010). ... 55
Figure 17 - Relationship between density and petroleum consumption (Source: Newman and Kenworthy, 1996; Wikipedia, 2012). ... 56
Figure 18 – “Realistic” feedback cycle (left) and feedback cycle with a TOD plan (right)... 58
Figure 19 - A theoretical example of TOD ... 58
Figure 20 – The value premium from transit along time (Source: Knowles and Ferbrache, 2016). ... 62
Figure 22 - A decision process incorporating TOD plans ... 63
Figure 23 - A decision process incorporating value capture. ... 69
Figure 23 – General framework of LUT models (Source: Southworth, 1995). ... 70
Figure 25 - A decision process incorporating a LUT model ... 73
Figure 25 - FTA's rating process (Source: FTA, 2015). ... 76
Figure 26 - Metro do Porto decision process (Source: Tavares and Antunes, 2000). ... 83
Figure 27 - The DSS structure ... 91
xi
Figure 29 - Linear normalization ... 100
Figure 30 - Results from the first set of scenarios ... 125
Figure 31 - Results from the reliability set of scenarios ... 126
Figure 32 - Tornado plot for travel times ... 127
Figure 33 - Tornado plot for revenues... 128
Figure 34 - Travel time and revenues for No Build ... 128
Figure 35 - Travel time and revenues for BRT1 ... 128
Figure 36 - Travel time and revenues for BRT2 ... 129
Figure 37 - Travel time and revenues for LRT1... 129
Figure 38 - Travel time and revenues for LRT2... 130
Figure 39 - Normalization functions ... 131
Figure 40 - MBTA network (Source: MBTA, 2017a). ... 139
Figure 41 – MBTA yearly ridership (Source: MBTA, 2017b). ... 140
Figure 42 – MBTA daily ridership for 2016 (Source: MBTA, 2017b). ... 140
Figure 43 – MBTA mode share (Source: MBTA, 2017b). ... 141
Figure 44 – MBTA yearly revenues, expenses and deficit (Source: MBTA, 2017b). ... 142
Figure 45 – Farebox recovery ratio (Source: Mass DOT, 2014). ... 142
Figure 46 - Proposed GLX alignment (Source: Mass DOT, 2016). ... 144
Figure 47 - GLX vehicles (Source: Railway Gazette, 2014). ... 145
Figure 48 - Current Somerville mode share (Source: U. S. Census Bureau, 2014). ... 146
Figure 49 - Median home price per square feet (Source: Zillow, 2016). ... 147
Figure 50 - BA and A1 alternatives from GLX project (Source: FTA & EOT, 2009). ... 149
Figure 51 - A typical at ground level Green Line station (Source: Phelan, 2011). ... 152
Figure 52 - The LRT alternative ... 153
Figure 53 - Silver Line BRT bus (Source: Lawrence, 2015) (left) and typical Silver Line BRT stop (Source: Nickerson, 2010) (right). ... 154
Figure 54 – NB and BRT alternatives ... 155
Figure 55 - Model area (Source: Han, 2015). ... 156
Figure 56 – Global (left) and corridor (right) levels ... 162
Figure 57 - Results from the first set of scenarios ... 174
xii
TABLES
Table 1 - Impacts of transit on land use ... 3
Table 2 - Research methodology ... 7
Table 3 - A decision process ... 11
Table 4 – Comparison of systems ... 15
Table 5 – FTA’s funding recommendations for 2017 – Estimated average capital costs ... 26
Table 6 - TransMilenio infrastructure costs (Source: Wright, 2004). ... 26
Table 7 – Capital costs misestimation (Source: FTA, 2016b)... 27
Table 8 - TransMilenio operating costs (Source: Wright and Hook, 2007). ... 27
Table 9 – FTA’s funding recommendations for 2017 – Estimated average operating costs ... 28
Table 10 – Operating costs misestimation (Source: FTA, 2016b). ... 28
Table 11 – Ridership misestimation (Source: FTA, 2016b). ... 29
Table 12 – Value of Travel Time Savings (Source: MacKie and Worsley, 2013). ... 31
Table 13 – Value of Statistical Life (Source: MacKie and Worsley, 2013). ... 33
Table 14 – Emissions (Source: FTA, 2010). ... 35
Table 15 - Decision matrix ... 40
Table 16 - Transit impacts on neighboring land use ... 57
Table 17 - Transit impacts on neighboring property prices ... 68
Table 18 - Policy impacts on modeling studies (Source: Wegener and Fürst, 1999). ... 72
Table 19 - 2017 Funding Recommendations ... 77
Table 20 - Land use ratings ... 79
Table 21 - Economic development effects ratings ... 80
Table 22 - PAC projects... 81
Table 23 - Summary of the decision processes ... 84
Table 24 - Growth indicators ... 94
Table 25 - Market values ... 99
Table 26 - The survey ... 102
Table 27 - Expert's priority profile ... 104
Table 28 – Features of investment alternatives ... 108
Table 29 - Investment alternatives, distances and car and walking inputs ... 109
Table 30 - Population, households, jobs and trip generation data ... 110
Table 31 - O/D matrix for all modes ... 110
xiii
Table 33 - O/D matrices for LRT1 and LRT2 ... 113
Table 34 - Land use data ... 114
Table 35 - Land use data at a station area... 114
Table 36 - Population at a station area (persons) ... 114
Table 37 - Jobs at a station area (jobs) ... 114
Table 38 - Population density at a station area (persons/km2) ... 115
Table 39 - Percentage of jobs at a station area ... 115
Table 40 - Entropy index at a station area ... 115
Table 41 - Residential property prices at a station area ... 115
Table 42 - Current Job data ... 116
Table 43 – Transit travel time skims for No Build... 116
Table 44 - Transit travel time skims for BRT1 ... 116
Table 45 - Transit travel time skims for BRT2 ... 116
Table 46 - Transit travel time skims for LRT1 ... 117
Table 47 - Transit travel time skims for LRT2 ... 117
Table 48 - Accessibility for No Build ... 117
Table 49 - Accessibility for BRT1 ... 117
Table 50 - Accessibility for BRT2 ... 117
Table 51 – Accessibility for LRT1 ... 118
Table 52 - Accessibility for LRT2 ... 118
Table 53 - Capacity check for lines NB1 and NB2 ... 118
Table 54 - Capacity check for lines A and B ... 118
Table 55 - Capacity check for lines D and E ... 119
Table 56 - Capacity check for lines C and F ... 119
Table 57 - LUT model outputs ... 120
Table 58 - Normalized values ... 121
Table 59 – Experts’ priority profile ... 122
Table 60 - Choice and ranking ... 123
Table 61 - Inputs to the first set of scenarios ... 124
Table 62 - Results from the first set of scenarios ... 124
Table 63 - Inputs of the reliability set of scenarios ... 125
Table 64 - Results from the reliability set of scenarios ... 125
Table 65 - Inputs to the real estate set of scenarios ... 127
xiv
Table 67 - Results from the optimization scenario ... 130
Table 68 - Average priority profile case ... 132
Table 69 - Mode priority profile case ... 132
Table 70 - Transit user case ... 133
Table 71 - Financial-constrained case ... 133
Table 72 - Urban-friendly case ... 134
Table 73 – BMA population statistics (Source: U.S. Census Bureau & CTPS, 2012). ... 138
Table 74 – BMA commute and transport statistics (Source: U.S. Census Bureau & CTPS, 2012).138 Table 75 - MBTA operating budget for FY2015 (Source: MBTA & Mass DOT, 2016). ... 141
Table 76 - GLX "Build" alternatives (Source: FTA & EOT, 2009). ... 143
Table 77 - GLX estimated daily ridership ... 146
Table 78 - Estimated population, jobs and entropy at GLX station areas ... 148
Table 79 - Estimated accessibility ... 148
Table 80 - Comparisons between BRT and LRT alternatives for the GLX project ... 150
Table 81 – Bus Route 80 (NB investment alternative) ... 158
Table 82 – Bus Route 87 (NB investment alternative) ... 158
Table 83 – Bus Route 80 (BRT investment alternative) ... 159
Table 84 – Bus Route 87 (BRT investment alternative) ... 159
Table 85 – College Avenue branch (BRT investment alternative) ... 159
Table 86 – Union Square branch (BRT investment alternative) ... 160
Table 87 – Bus Route 80 (LRT investment alternative) ... 160
Table 88 – Bus Route 87 (LRT investment alternative) ... 160
Table 89 – College Avenue branch (LRT investment alternative) ... 161
Table 90 – Union Square branch (LRT investment alternative) ... 161
Table 91 - Data about the corridor level ... 162
Table 92 - Capital costs ... 163
Table 93 - Operating costs ... 163
Table 94 - Revenues ... 164
Table 95 - Average transit commute travel time ... 164
Table 96 - Mode share ... 165
Table 97 - Transfers ... 165
Table 98 – Emissions ... 166
Table 99 – Home prices (2020) ... 167
xv
Table 101 – Population density (2020) ... 167
Table 102 - Population density growth ... 168
Table 103 - Population and jobs (2020)... 169
Table 104 - Entropy index ... 169
Table 105 - Accessibility by transit ... 169
Table 106 - The outputs ... 170
Table 107 – Normalized results ... 170
Table 108 - Experts' priority profile ... 171
Table 109 - Choice and Ranking. ... 172
Table 110 - Inputs to the first set of scenarios ... 173
Table 111 - Results from the first set of scenarios ... 173
Table 112 - Inputs to the reliability set of scenarios ... 174
Table 113 - Results from the reliability set of scenarios ... 174
Table 114 - Inputs to the real estate set of scenarios ... 175
Table 115 - Results from the real estate set of scenarios ... 175
Table 116 - Average priority profile case ... 176
Table 117 - Mode priority profile case ... 177
xvi
LIST OF ABBREVIATIONS
€ Euro
A1 Alternative 1
AHP Analytic Hierarchy Process
APAX Auto Passenger
AVL Automatic Vehicle Location
BA Baseline Alternative
BCR Benefit Cost Ratio
BHLS Bus with High Level of Service
BMA Boston Metropolitan Area
BRT Bus Rapid Transit
CBA Cost Benefit Analysis
CBD Central Business District
CO2 Carbon Dioxide
CR Consistency Ratio
CTPS Central Transportation Planning Staff
DAT Drive to access transit
DI Diversity Index
DSI Dissimilarity Index
DSS Decision Support System
DU Dwelling Units
EI Entropy Index
EJ Environmental Justice
FAR Floor Area Ratio
FTA Federal Transit Administration
xvii GWR Geographic Weighted Regression
HHI Herfindahl-Hirschman Index
HR Heavy Rail Transit
HRT Heavy Rail Transit
In Inbound Boston
IRR Internal Rate of Return
ITS Intelligent Transportation Systems
k One Thousand
km Kilometer
KM Kilometer
LRT Light Rail Transit
LUT Land Use and Transport
M One Million
Mass DOT Massachusetts Department of Transportation
Max. Maximum
MBTA Massachusetts Bay Transportation Authority
MCDA Multi-Criteria Decision Analysis
min. Minutes
Min. Minimum
MIT Massachusetts Institute of Technology
MIT-FSM MIT Boston Metro Region Four Step Model
MPO Boston Region Metropolitan Planning Organization
NB No Build
Non-EJ Non-environmental Justice
NPV Net Present Value
xviii O/D Origin/Destination
Out Outbound Boston
PAC Growth Acceleration Program
PAX Passenger
POP Population
pphpd Passenger per hour per direction
ROW Right-of-Way
SCBA Social Cost Benefit Analysis
SOV Single Occupancy Vehicle
TAZ Traffic Analysis Zone
TM TransMilenio
TOD Transit Oriented Development
US$ American Dollar
VOSL Value of Statistical Life
VTTS Value of Travel Time Savings
WALK Walk
1. INTRODUCTION
• Motivation • Objectives
• Research questions • Research methodology
2
1.1. Motivation
As cities grow, so does the need for better public transportation systems. With limited budgets and under an environmentally-constrained setting, it is paramount that transportation systems and land use are considered together, thus ensuring higher sustainability levels. However, changes in land use induced by new transportation services or infrastructure, typically occurring within half-mile from stations, are not adequately considered in decision-making1, mainly because they
are hard to monetize to fit in a traditional Cost Benefit Analysis (CBA) (Börjesson et al., 2014; Damart and Roy, 2009; Douglas et al., 2013; Eliasson, 2013; May et al., 2008). Normally, these benefits are often considered as value transfer instead of value creation, and they are too complex to be assessed by traditional transport modeling software. Gains in accessibility, density, mixed-use and property values are some impacts of transportation services that reflect changes in land use and should be considered when designing or re-designing those services.
Recent research clearly shows that proximity to transportation stations can increase local accessibility and therefore influence the value of surrounding properties and rents, affect population and job density, attract business and services and spur economic development. The magnitude of these impacts can greatly vary according to systems, urban patterns and local market behaviors. It is frequently considered (Vuchic, 2002) that rail systems, e.g. Light Rail Transit (LRT), have more impact on land use, when compared to road systems, mainly because of the “sense of permanence” they bring. Currie (2006) and Deng and Nelson (2011) state differently, arguing that road systems such as Bus Rapid Transit (BRT) can have substantial positive impacts on land use, mainly when integrated land use transport plans are applied. Table 1 lists some cases showing the impact of transit on land use2.
There are several approaches for understanding and handling land use changes in terms of decision-making processes for transportation systems. These approaches are used in more theoretical research, in academia (Banai, 2010; Bertolini et al., 2005; da Silva et al., 2008; Hull et
1 In this thesis, the term decision-making refers to major capital investments on public transport
infrastructure, i.e. the process for choosing an investment alternative to build, among a set of alternatives.
2 For similar studies regarding the impacts of transit on land use see Banister and Thurstain-Goodwin
(2011); Knowles and Ferbrache (2016); Debrezion et al. (2007), (2011); Deng and Nelson (2011); Hensher et al. (2012); Legaspi et al. (2015); Stokenberga (2014); Wirasinghe et al. (2013).
3
al., 2012; Thomopoulos and Grant-Muller, 2013) and in practice by government funding agencies (FTA, 2015; MacKie and Worsley, 2013). These approaches can be summarized as follows:
- political/planning approaches: value capture mechanisms, Transit Oriented Development (TOD) plans;
- methodological/modeling approaches: Land Use and Transport (LUT) models, evaluation at face values.
Table 1 - Impacts of transit on land use
City Mode Impact Reference
Bogotá BRT Residential prices up between 5.8%
and 17% Perdomo Calvo et al., 2010
Pittsburgh BRT A residential property 300 meters away from a station is valued
approximately US$ 10,000 less than a property 30 meters away from it
Perk and Catalá, 2009
Seoul BRT 54% increase in employment density Kang, 2010 Buffalo LRT Residential prices up between 2% and
5% Hess and Almeida, 2007
Freiburg LRT Office rents per square meter on the periphery were nearly 37% lower than at similar locations served by the system
Hass-Klau and Crampton, 2005
Nantes LRT About 25% of all new offices were located along a light rail line
Hass-Klau and Crampton, 2005
Mexico City Metro Residential density increased
significantly more around stations Guerra, 2014
Value capture mechanism takes part of the monetary gains from surrounding properties to help financing the transit system, which can then be evaluated with traditional CBA as a capital influx (Levinson and Zhao, 2012), while TOD plans ensure that zoning regulations near stations will favor dense and mixed land use patterns that, in the medium/long term, will help increase station ridership. Instead of estimating and evaluating the changes caused by transport investments on land use, a TOD plan is evaluated, for instance with Multi-Criteria Decision Analysis (MCDA) (FTA, 2015). In this way, the decision-maker knows, to a certain degree, that the changes will happen, even if their impact cannot be fully estimated. On the other hand, LUT models can estimate changes in land use triggered by transit systems, typically based on project development catalogs and hedonic models, and update baseline population and activity data, that are typically the inputs for four-step models – this process is iterated several times, and then the evaluation is performed. Other metrics (such as accessibility), evaluated at their face value, by MCDA-type methods, are less common in the literature (Hull et al., 2012).
4
TOD plans can be difficult to implement, because responsibilities and decision-making processes are fragmented (Börjesson et al., 2014). Value capture approaches can also be difficult to use, as they demand some articulation between different stakeholders to guarantee their application (Martínez, 2010). On the other hand, LUT models are also challenging, as they are rather sophisticated, data intensive, and expensive to build and to keep updated. Hence, a new decision system, incorporating land use changes, not requiring TOD plans, value capture mechanisms or sophisticated LUT models, may be quite valuable in practical terms.
1.2. Objectives
Taking into account the above discussion, the objectives of this research are:
1. Understand current decision-making processes focusing on, but not limiting to, BRT and LRT systems;
2. Understand the impacts of transit systems on land use and accessibility; 3. Measure these impacts; and
4. Consider those impacts in the relevant decision-making processes.
The first and second objectives aim at identifying how current decision-making is carried out, when it comes to choose a transit investment alternative, among a set of potential projects, and how transit systems, typically within half-mile from transit stations, affect land use and accessibility. To support these objectives, a structured literature review was performed.
For the third objective, as referred before, LUT models cannot in general be used, as they are rather expensive to build and to keep updated. Such difficulties might hinder a broader interest on analyzing, estimating and incorporating in decision-making processes impacts triggered by transit systems on land use and accessibility. Hence, a practical way of forecasting impacts of transit systems on land use and accessibility was developed.
Finally for the fourth objective, as stated by Meyer and Miller (2001), Quinet (2000) and TRB (2011), appraisal tools such as CBA normally do not consider land use impacts, despite the substantial benefits and costs that can emerge. Problems as complex as the implementation of transit networks need a more sophisticated decision support system (DSS) that considers the diversity of criteria related to an urban intervention with such magnitude. Usually CBA fits very well to problems for which the process of impact monetization is easy, i.e., giving a monetary value
5
for each cost and benefit, but for problems where it is not, others appraisal tools should be used, such as MCDA.
1.3. Research questions
The following research questions resulted naturally from a comprehensive literature review and the identification of a set of relevant gaps:
- Question 1: Have BRT and LRT some impact on accessibility, land use, density and land value that can be measured?
o 1.1: Are those impacts mostly benefits rather than costs? o 1.2: Can those benefits and costs help decision-making?
o 1.3: Can those benefits (mainly density increase and land use mix increase) induce medium and long-term ridership?
o 1.4: Could this “induced ridership” be considered during decision-making as a qualitative criterion or as part of passenger forecasts?
- Question 2: How can this knowledge help decision-making? Is it worth considering those benefits during the decision-making process, or the more traditional benefits (travel time and traffic reduction) are enough?
- Question 3: What means the sense of permanence?
- Question 4: Can we achieve a sense of permanence, and its associated benefits, with road service or only with rail service?
To help answer these questions, a methodology framework was developed and is briefly presented in the next section.
1.4. Research methodology
The methodology framework for this study is divided in three phases: Observe, Understand and Intervene. In the first phase, Observe, a structured literature review of the following fields was performed:
- capital investment decision-making on public transport systems; - land use and transit decision-making;
6 - BRT and LRT;
- accessibility, land use and transport interaction (LUTI) and LUT models; - DSSs and appraisal methods: CBA, MCDA, sensitivity and risk analysis; - interviewing and opinion surveys methods.
The second phase, Understand, comprises the major contributions of this research to society, being the most relevant part of this research. The objective of this phase is to provide a deep understating of the relations at a disaggregated and more detailed level. To achieve that, a DSS, combining a “straightforward” LUT model (Meyer and Miller, 2001) with a MCDA model (Vincke, 1992), was developed and assessed in a small case study and in a real case study (the Green Line Extension Project in Boston, Massachusetts, the USA). Although the system has a more general scope, this instance was configured to focus on BRT and LRT systems, as they are comparable to a certain degree (Vuchic, 2007; Wright and Hook, 2007). Still in this phase, some public transport experts were interviewed, to understand what is the level of consideration that should be given to each decision parameter. Finally, the Intervene phase consists of delivering the final thesis report and the DSS. Table 2 presents the methodology framework.
In this framework, item 1.1 reviews BRT and LRT systems. 1.2 and 1.3 cover the state of the art and practice regarding decision-making, while 1.4 and 1.5 review how land use changes are modeled, forecasted and evaluated. 1.6 and 1.7 review how the decision-making process is structured, typically starting with the definition of investment alternatives, modeling, forecasting, evaluation, sensitivity analysis and final decision. All these items are covered in chapters 2 and 3.
The development of the DSS (items 2.1, 2.2 and 2.3) consists: in designing a “straightforward” LUT model, to foster the incorporation of land use changes (which are sometimes ignored due to the complexity of state of the art LUT models); the development of a MCDA model, as such models are more adequate to evaluate land use changes than CBA; and, finally, a survey with public transport experts to gather the views and opinions for the MCDA weights. Chapter 4 presents the DSS. Still in chapter 4, a small case study is developed and assessed with the DSS. Later, the DSS is tested in a real decision problem, the GLX project, under construction in Boston, the USA.
7
Table 2 - Research methodology
1.
OBSERVE
Structured literature review: State of the art, State of the practice
1. BRT and LRT.
2. Capital investment decision-making on public transport systems.
3. Decision parameters and aspects. 4. Land use and transit decision-making. 5. Accessibility, LUTI and LUT models.
6. DSSs and appraisal methods: CBA, MCDA, sensitivity and risk analysis.
7. Interviewing and opinion surveys methods.
2.
UNDERSTAND
Development of the DSS
1. A “straightforward” LUT model. 2. A MCDA model.
3. A survey with public transport experts.
Small case study development and assessment
1. Development of a “toy problem”; a simple and small case study (5 zones) to test the DSS. 2. This case study will replicate, based on the
literature review applied over a generic dataset, the cause-effect relationship between BRT or LRT systems with land use and transport.
3. Various investment alternatives will be analyzed, each with a BRT or LRT system and their respective features: costs; route; station spacing; speed; capacity; frequency; etc.
4. The investment alternatives will be assessed applying the DSS, to choose the best investment alternative, from a set of alternatives.
The Green Line Extension Project
1. Like the previous process, investment alternatives will be introduced on the transport model developed for the city of Boston by MIT;
2. The investment alternatives will be assessed applying the DSS, in order to choose the best investment alternative, from a set of alternatives.
3.
INTERVENE
2. CAPITAL INVESTMENT DECISION-MAKING ON
PUBLIC TRANSPORT SYSTEMS
• Introduction
• Definition of investment alternatives • Common decision parameters and aspects • Four-step model
• Cost Benefit Analysis
• Multi-Criteria Decision Analysis • Risk and uncertainty
• The final choice
10
2.1. Introduction
When planning a new transportation system or improving an existing one, analysts face several decisions regarding the choices of solutions (e.g. double-decker or articulated buses?) or courses of action (e.g. buy new buses or renovate the old ones?). Normally, depending on the level of complexity involved, decisions may have good or adverse consequences on short and/or medium/long term. Therefore, the process of decision-making should be carefully conducted to minimize future negative impacts and maximize possible direct and indirect benefits.
Despite the level of sophistication and precision associated with highly detailed transport models, their results should be considered as a guidance for planning and not necessarily be adopted blindly by the analyst and the decision-makers. Moreover, not all information is available, leading to some level of uncertainty over the results.
Consider the following problem: a rural transit agency owns three buses, each one with a current value of $5,000. One of them broke down yesterday and must be replaced or become operational as soon as possible. To address the issue, the agency has two main options: buy a new bus for $10,000 plus the old one, or fix the old bus with repairs costing either $1,000 or $5,000. The experienced mechanic believes there are 60% chances the repair might cost $1,000, and 40% it can go up to $5,000 (Figure 1). What should the agency do?
Figure 1 – A decision tree
Such problems may be solved in several ways: the agency can spend more time getting additional information about the outcomes, and improve the decision model (at what cost?); or they can implement single criterion decision approaches by adopting a decision paradigm such as the minimization of the expected value. Since the only item to consider is cost, it is a straightforward decision process that is more related with the risk the agency is willing to take rather than the problem itself. For more complex problems, e.g. capital-intensive projects, more sophisticated and structured evaluation methods and tools must be applied to assist the decision process.
11
Dror (1968), cited by Meyer and Miller (2001), presents a five-step rational decision-making model that starts by understanding the context for decision-making and weighting societal values and goals, and finishes by selecting the alternative which maximizes the specified goals. UK Gov. (2009) presents a similar six-step process that includes a last feedback stage. Turban, Aronson, and Liang (2005) divide the process in four broad phases named as “Intelligence, Design, Choice and Implementation”, and Baker et al. (2001), cited by Fülöp (2005), state that before initiating the process of decision-making, a clear identification of the decision-makers and stakeholders should be made, in order to reduce misunderstanding regarding problem definition, requirements, goals and criteria. Then, an eight-step decision-making process can be performed. Some authors (Clemen and Reilly, 2013; European Commission, 2008; Instituto Nacional de Ecología, 2006; TRB, 2011) also emphasize the importance of a final sensitivity analysis.
Despite the different considerations and highlights, all authors agree that, to help make the decision, some sort of decision support system, technique or aid should be utilized. The most common techniques in the transportation field are CBA and MCDA. Those techniques can be applied separately or in an integrated way. Hence, a typical decision methodology encompasses the definition of investment alternatives, definition of the decision parameters, forecasting, evaluation, sensitivity analysis and final choice. Figure 2 and Table 3 present this general methodology along with the associated sections of this literature review.
Table 3 - A decision process
Step Description Sections
1 Definition of investment alternatives 2.2 Definition of investment alternatives 2 Definition of decision parameters and
aspects
2.3 Common decision parameters and aspects
3 Forecasting 2.4 Four-step model
4 Evaluation 2.5 Cost Benefit Analysis
2.6 Multi-Criteria Decision Analysis 5 Sensitivity analysis 2.7 Risk and uncertainty
6 Final choice 2.8 The final choice
This chapter presents a literature review, with the state of the art and of the practice on decision-making for capital investments in public transport systems, i.e. in the construction of new or extended transit systems. Section 2.2 reviews public transport systems focusing on medium capacity solutions such as Bus Rapid Transit and Light Rail Transit. Section 2.3 addresses common decision parameters and aspects, regularly considered in the decision process, followed by the explanation of one of the most widely used methods for estimating those parameters, the four-step model (2.4).
12
Then, two extensively employed evaluation methods, Cost Benefit Analysis and Multi-Criteria Decision Analysis, are presented (2.5 and 2.6), followed by a section about how to incorporate risk and uncertainty on decision-making (2.7). Before concluding, section 2.8 discusses some drawbacks found in current decision-making that lead to poor final choices, and section 2.9 concludes this first part of the literature review and presents some issues for future research, such as the need of including land use issues on decision-making. The chapter is concluded showing the potential in researching and experimenting new and innovative decision tools based on Multi-Criteria Decision Analysis, mainly when hard to monetize decision parameters, such as accessibility, density, mixed-use and property values, take part in the decision-making process, therefore serving as a complement to traditional Cost Benefit Analysis. These issues will be addressed in the second part of this literature review: Land use and public transport decision-making (chapter 3).
2.2. Definition of investment alternatives
2.2.1. Introduction
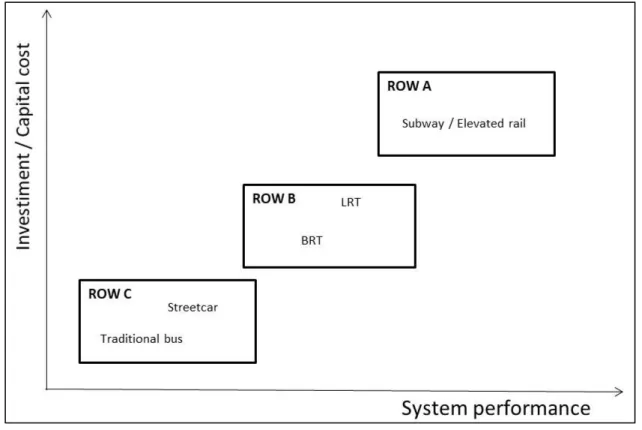
For a long time, city managers have been facing a dilemma concerning transportation options. As stated by Vuchic (2007) there was a great need for medium capacity services. Bus Rapid Transit (BRT) and Light Rail Transit (LRT) are two public transport technologies that can be framed as medium capacity solutions. Despite some different visions regarding the details, researchers (Cain et al., 2006; ITDP, 2013; TRB, 2012; Vuchic, 2007; Wright and Hook, 2007) generally agree that those two systems need some level of segregated Right-of-Way (ROW) to achieve a good overall system performance (Figure 3).
According to Vuchic (2002) there are 3 categories of ROW: A, B and C. ROW C represents urban streets with mixed traffic. In category ROW B, transit systems are partially separated from other traffic but have crossings at grade; and ROW A comprises all transit systems that are totally grade separated, such as underground subways and elevated rail systems. Added to the physical segregation schemes described, traffic lights coordination and Intelligent Transportation Systems can improve system performance by reducing travel times (Wright and Hook, 2007). Despite this classification in three ROWs, the frontiers are not always that clear, and sometimes solutions are somehow in between, containing some features from one category or another.
14
Figure 3 - ROW, system performance and costs (Source: Vuchic, 2007).
As stated by Deng and Nelson (2011), BRT is an emerging form of mass transit, tying the speed and reliability of rail service with the operating flexibility and lower cost of conventional bus service. The development of BRT systems became a cheaper and viable alternative to rail modes, mainly competing with LRT systems. Table 4 shows a comparison between the main transit solutions available and their most common features (based on Cain et al., 2006; De Bruijn and Veeneman, 2009; Deng and Nelson, 2011; TRB, 2012; Vuchic, 2002; Wright and Hook, 2007).
Table 4 shows various relevant features of four major transit systems. Considering capacity, speed, ROW and headway, BRT and LRT are the most similar. Both can deliver medium capacity solutions with good speed and headway; however, a BRT tends to generate more local pollution and gives a less sophisticated image to the city. Concerning capital costs, BRT’s capital costs are lower than LRT’s: according to Wright and Hook (2007), BRT can be four to 20 times cheaper than LRT. Regarding operating costs, Vuchic (2002) states that LRT can have smaller costs due to economies of scale, generated by large vehicles and train operation.
The capacity of transit systems can be measured by the number of passengers per hour per direction (pphpd) transported. The capacity range of BRT systems is significant. Some European and American systems, with some mixed-traffic operations and regular buses, present capacities ranging from 3,000 pphpd to 6,000 pphpd (Kerkhof et al., 2011). Other South American and Asian
15
Table 4 – Comparison of systems
Features
Transit Systems Conventional
bus services
Bus rapid transit (BRT)
Light rail transit (LRT)
Subway/ elevated rail Capacity (pphpd)
(1 lane) Low: 500-5k Medium: 3-15k Medium: 6-26k High: 30-80k
Speed Slow Medium Medium Fast
ROW Mixed with
traffic Partially separated Partially separated Totally separated Headway
Medium-Long Short-Medium Short Short
Support Roadway Roadway Steel track Steel track
Guidance Steered Steered/Guided Guided Guided
Vehicle control Visual Visual Visual/Signal Signal
Vehicle propulsion Internal combustion
Internal
combustion Electric Electric
Vehicle capacity 120 160-260 170-280 250
Vehicle combination 1 1 1-4 4-10
Construction time Fast Medium Slow Very Slow
Capital cost Low Medium High Very High
Operating cost Low Medium Low-Medium Low-Medium
Local emission Medium Medium Low Low
System image Low Medium High High
Passenger attraction Low Medium High High
Impacts on land use
and city livability Low Medium High High
systems, such as Curitiba, Porto Alegre and Guangzhou, can have ridership between 10,000 pphpd until 30,000 pphpd (Hook, 2008). Bogotá, as a unique case, reaches 45,000 pphpd mainly because it has, in almost all the routes, two reserved lanes each way (Gilbert, 2008), multiple stopping bays and an average speed up to 30km/h. As stated by Hook (2008), no matter how big the vehicles are, BRT can only reach 15,000 pphpd with only one lane per direction.
Another advantage of BRT when compared to LRT is the flexibility to improve when more capacity is needed, possibly by converting the system into a LRT (Henke, 2013; Rathwell and Schijns, 2002; Wood et al., 2006). And also to branch out bus lines off the busways, such as in Guangzhou, Brisbane and Ottawa (Hidalgo and Gutiérrez, 2013; Rathwell and Schijns, 2002). Because of the “poor image” normally associated with the bus, some experts (Vuchic, 2002) believe that BRT’s impact on land use can almost be negligible. Lacking the “sense of permanence” (Currie, 2006), usually associated with rail systems and rail tracks, weakens the perception of benefits derived from this kind of transport system. The “excessive versatility” of the bus systems (i.e. very easy to
16
change routes, stops and schedules) can rather create a “sense of instability” and reduce the interest in land development near bus stops and stations. In a way that is different from a bus service on a road or street, rail tracks give a more integrated “system-like” impression, a reason for promoting rail services. On the other hand, the LRT infrastructure cannot be easily removed in case of misplaced investment or ridership losses, thus it is very important to couple rail investments with local urban development incentives, e.g. TOD (to be discussed further on). Cities such as Cuiabá (Brazil) and Malaga (Spain) fail to do that, but this is not the case of many European cities that successfully integrated land use and rail development. Integration can be divided in three major areas (Wright, 2004):
- modal integration; - land use integration;
- travel demand management.
Modal integration comprises all the other transport modes that can connect with a BRT or LRT system in a station. Weather-protected pedestrian access, connection with cycle paths and
Bike-and-Ride facilities; Park-Bike-and-Ride facilities mainly in suburban stations; a station layout that allows
fast and comfortable transfers between feeder buses and trains; and, finally, connection with taxi services, are the main characteristics of a good modal Integration scheme. This kind of integration can also extend beyond just being physical and have integration of fares (e.g. same ticket for parking and public transport) and information (crossing multiple systems data concerning departures and arrivals, travel time, speed, delays, parking availability). European BRT, also known as Bus with High Level of Service (BHLS) (Heddebaut et al., 2010), and LRT systems have a strong “integration tradition”, when compared to similar solutions in other countries. A strong trend ― intermodality with cycling – can be observed in the Netherlands, Sweden and the UK, so that many stations have some space dedicated for Bike-and-Ride (Kerkhof et al., 2011). In Almere, the Netherlands, this “integrated system approach” is very clear with a BHLS system strongly integrated with bikes, Park-and-Ride, train stations, and urban development.
Land use integration may also be viewed in the context of as TOD (Transit Oriented Development). TOD3 is an urban design and public transport combination that aims at improving the effectiveness
17
of transit as well as supporting community goals and improving accessibility (Cervero et al. (2004) cited by Currie (2006)). Proximity to mass transit can save time and money from commuting, properties near transport facilities generally become desirable for new development or redevelopment (Deng and Nelson, 2011). For BRT systems, solutions such as the one in Curitiba (high density residential and commercial development along the corridors) show the true advantage of orienting land development nearby BRT stations and corridors, or even in the whole city. Connection with shopping malls or hospitals can greatly increase transit ridership.
Travel demand management is based on set of policy measures that discourage automobile use or promote public transport ridership. Some common measures are (Wright and Hook, 2007): reduction in parking supply; increase in parking fee and enforcement; circulation restricted by license number; congestion charging and road pricing; traffic calming measures. These three subjects (modal integration; land use integration; and travel demand management) can be handled together or separately. Normally more Integration measures lead to better transport planning.
BRT and LRT are having a growing role on the future of cities. To cite just some recent and current undertakings: in Brazil a new BRT in Belo Horizonte; and LRTs in Santos, Rio de Janeiro and Cuiabá (globo.com, 2015). China, among other countries, have also launched or upgraded, during the last decade, 16 BRT systems with various configurations and features (Deng et al., 2013; Global BRT Data, 2013; Hidalgo and Gutiérrez, 2013). In the US and Canada, planning and construction of various LRT project are taking place in almost 40 different cities, some of them still looking for funding under federal transit programs (thetransportpolitic.com, 2015) Therefore, there are no doubts about the importance given to BRT and LRT as transit solutions.
2.2.2. Bus Rapid Transit and Light Rail Transit
Bus Rapid Transit (BRT) are mass transit systems. Such as subways and suburban trains, a BRT aims at providing transport capacity and commercial speed that a regular bus service cannot achieve. The precise definition of a BRT system depends on the authors (Deng and Nelson, 2011; Levinson et al., 2003b; Wright and Hook, 2007). Although they generally agree that a BRT is a rubber-tired flexible bus-based system that combines stations, busways, pre-boarding payment and Intelligent Transportation Systems (ITS), with a cost-effective proposal. It puts together the qualities, reliability, medium capacity and speed normally associated to rail systems, with the versatility and low cost of buses. Moreover, another acronym recently emerged in France and in the European
18
bus industry, the BHLS, a BRT inspired by rail performance and adapted to the European urban context (Kerkhof et al., 2011). Basically, a BHLS is a lighter version of a BRT, more focused on reliability and integration, rather than capacity and speed. In the family of tire-based transit systems, BRT and BHLS are the available solutions with best performance.
Light Rail Transit (LRT) are mass transit systems with a longer history than BRT. Their deployment becomes popular after World War II, through Central Europe and the developed world, as the backbone of many urban transit systems. According to the American Transportation Research Board (as cited by De Bruijn and Veeneman (2009)) a LRT is a metropolitan electric railway system characterized by its ability to operate single cars or short trains, along exclusive rights-of-way at ground level, on aerial structures, in subways or, occasionally, in streets, and to board and alight passengers at track or car-floor level. LRT fit in a spectrum of rail transit solutions that can be divided in four types, allowing some overlapping: Streetcar / Tramway; Light Rail Transit; Rapid Transit (underground or elevated) and Regional Rail / Commuter Rail. Being in the middle of this spectrum, an LRT is a versatile option that can be considered as a semi rapid transit system (Vuchic, 2007). Such as a BRT, it demands some level of segregated ROW to properly operate. The main features that distinguish rail systems from other transit solutions are external guidance, rail technology, electric propulsion and ROW separation (De Bruijn and Veeneman, 2009; Hass-Klau and Crampton, 2005; TRB, 2012). Other characteristics associated with LRT are: low floor level; greater, cleaner and more sophisticated appearance when compared to buses; wide body; and higher passenger capacity per driver, because of the possibility of combining several transit units altogether operated just by one driver, thus increasing substantially passenger throughput (Vuchic, 2007).
The reason for creating BRT solutions was the need of a fast, medium capacity, reliable and cheap transit solution, when compared to the rail costs. According to Deng and Nelson (2011), the first exclusive bus lane appeared back in 1937 in Chicago, the USA. Later, the busway concept was improved until 1974, when the first proper BRT system was deployed in Curitiba, Brazil.
In fact, this system introduced a set of innovative features, creating, in this way, the Bus Rapid Transit concept. Its key features are (Lindau et al., 2010):
- median busways longitudinally segregated;
- tube-shaped stations with fare prepayment and level access;
19 - various retail and services at terminal stations; - dispatch control;
- high capacity bi-articulated vehicles up to 260 passengers/vehicle; - passenger information inside the vehicles, terminals and tube stations.
Figure 4 - BRT in Curitiba, Brazil and LRT in Porto, Portugal (Source: Wikipedia 2015).
BRT or LRT systems need to have the following main elements (Deng and Nelson, 2011; Hass-Klau and Crampton, 2005; Levinson et al., 2003b; TRB, 2012; Wright and Hook, 2007):
- ROW: busways and railways; - stations;
- vehicles;
- service configuration; - system identity and image; - Intelligent Transportation Systems
2.2.2.1. ROW: busways and railways
Bus runways can be classified in curb bus lanes and in median busways on city streets (Levinson et al., 2003a). There are also reserved lanes on freeways, bus-only roads and corridors, tunnels, and buses on highway shoulders. The most significant factor to substantially improve the quality of the bus service is the level of segregation from regular traffic. Wright and Hook (2007) strengthen the difference between bus lanes and busways regarding the ROW (Figure 3). Bus lanes are widely spread across the world, and can have substantial impact on performance, as for example in the case of London. However, normally when implemented alone in the curb lane without any other priority measures, there will be no significant effect in improving transit service. In a different way, busways are exclusively used by public transport because they are physically segregated from traffic, considerably enhancing the system performance. For BRT systems, the busways can also be painted in a distinct color (e.g. in Castellón), made with regular asphalt (e.g. in Curitiba), or
20
concrete (e.g.in Twente). They can also have some guidance devices like in Rouen with optical guidance; in Cambridge, Adelaide and Nagoya with physical guidance; and in Eindhoven, with magnetic guidance (Kerkhof et al., 2011).
LRT systems, by default, tend to have higher ROW than BRT systems. With an LRT, a rail-based system, it is politically easier to prohibit mixed traffic from occupying the rail corridor. In some sense the most iconic element of an LRT in particular, and a rail system in general is the railway. Rail tracks deployed over the countryside, or in an urban environment, bring a “sense of permanence” and some certainty about a potential transportation service running on that infrastructure. LRT must have some level of segregated ROW to properly operate, allowing general traffic to cross the tracks at signalized intersections, preferably with transit prioritization, i.e. the train should only stop at stations or when an event such as a traffic accident blocks the rail tracks. On the other hand, when such level of ROW is not achievable and thus mixed-traffic can circulate over the rail tracks and there is no signal prioritization for LRT vehicles, the rail option substantially loses performance, due to the inability of changing lanes and overtaking and having to stop at red lights.
2.2.2.2. Stations
Stations are a critical element in achieving system identity and image (Levinson et al., 2002). They are the interface that connects the system with the passengers, and they can have a variety of configurations, from regular open bus/streetcar stops (very common in European systems), to closed pre-board payment stations, with the iconic tube-shaped station of Curitiba. The station layout can be designed to allow multiple docking and passing for express services.
A BRT or LRT station must have good walking / feeder services connections, passenger information, protection from the weather and, if possible, park/bike-and-ride facilities. Other essential features are the platform level boarding and efficient vehicle alignment with the station. According to ITDP (2013), those features are important ways of reducing dwell times, allowing faster entering and exiting the vehicles, and enhancing conditions for all passengers. The platform level boarding can be done by using low floor vehicles or elevated stations. For an efficient bus alignment, the solutions vary from very sophisticated guided system, such as in Nagoya and Rouen, to just relying on the bus driver skills. Light rail drivers do not face such issue due to rail tracks guidance.
21
Figure 5 - BRT station in Curitiba, Brazil and LRT station in Porto, Portugal (Source: Barcex 2011).
The station can be located on the curbside or in a central island between the corridors. The station spacing regularly range from 300 to 1,000 meters (Wright and Hook, 2007). The spacing will also depend on local demand levels, walking conditions and destinations (shopping malls, public services) on the surroundings.
On-board fare collection and verification, very common in traditional bus systems, tend to dramatically increase dwell time and reduce passenger throughputs. Emulating rail systems, off-board fare collection and verification became the standard of quality for BRT systems. Combined with level boarding and alighting, off-board fare collection and verification crucially contribute to the reduction in total journey time and time variability, and lead to less crowding at stations (Hensher and Li, 2012).
Two types of fare collection and verification are mostly used in practice. The first type, very common in Latin American systems, is the barrier-controlled system. In this system passengers must pass through a gate or turnstile when entering and, sometimes, exiting the station. The other type, common in the USA and Europe, is the proof-of-payment system, where the passenger pays at a kiosk or vending machine and collects a paper ticket or magnetic card, which might be later verified by a random inspection inside the vehicle. ITDP (2013) states that the barrier-controlled system is preferable because it minimizes fare evasion. The data collected by the turnstile upon boarding, and sometimes upon alighting, can be useful in future system planning and evaluation.
LRT are quite different from BRT (that can be viewed as the “metronization of buses”), really belonging to the family of rail transit modes and therefore having higher project standards from the outset. For LRT nowadays, stations not offering the amenities found on traditional rail systems are therefore quite uncommon.
22
2.2.2.3. Vehicles
For BRT, the type of vehicles can range from standard buses to articulated or to bi-articulated vehicles with capacity up to 260 passengers (Lindau et al., 2010). Yet, the most common BRT vehicle is the low-floor articulated bus that can carry up to 160 passengers. Diesel is still the main fuel used, but Levinson et al. (2003a) and Kerkhof et al. (2011) recognize a trend towards more environmentally friendly fuels, such as clean diesel, compressed natural gas, liquid petroleum gas, biofuels, or towards the adoption of hybrid-electric vehicles. Moreover, BRT vehicles can have features that improve comfort, speed and safety, such as multiple wide double-doors to allow fast and convenient boarding, wide aisles to provide ease of passenger movement, in addition to having a distinctive design to provide a unique identity (Jarzab et al., 2002).
Figure 6 – Bus with a capacity of 260 passengers, operated in Curitiba.
LRT vehicles, on the other hand, have a higher capacity range, being able to couple multiple transit units, thus easily increasing capacity. Such vehicles are sometimes designed in cooperation with the manufacturer, specifically for each project, and a common configuration with two transit units can easily serve up to 450 passengers. This is quite different from BRT vehicles which are an upgrade from traditional buses. Light rail vehicles are, in fact, adaptations of heavy rail vehicles for traveling through the urban environment. They may operate alone or combined, thus achieving economies of scale by increasing transit capacity without increasing the labor force. Light rail vehicles are also more wide and comfortable than BRT vehicles, and trains in opposite directions can run more closely due to guidance provided by the rail tracks. Light rail vehicles are, in general, more appealing than buses as they have a set of features such as electric powered engines, quietness, riding comfort and low-floor access, that are not so common in buses.
23
2.2.2.4. Service Configuration
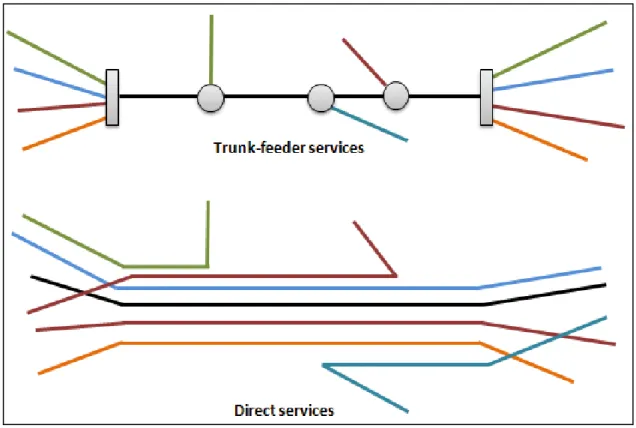
One of the key issues characterizing BRT and LRT is service configuration. There are basically two types of service configuration: trunk-feeder, or direct service. Both BRT and LRT might operate in either configuration type (see Figure 7).
Figure 7 - Trunk-feeder and direct services scheme
Most BRTs operate trunk-and-feeder, using conventional buses in the feeder lines and larger buses in the trunk lines. Passengers must transfer between the trunk and the feeder lines. This service is normally associated to closed systems such as Bogotá and Curitiba, i.e. only certain operators can use the main BRT corridor, normally with a special bus identity and contract. Direct services, however, can reduce the need of transfers, having direct connections to areas outside the main BRT corridor. This type of service is normally found in open systems, such as Guangzhou (Dai, 2011), where any operator can use the busways and stations. According to Wright and Hook (2007), until 2007, most open-type systems have been of somewhat lower quality than closed systems.
Following a tradition of rail systems, LRT systems generally operate direct services, branching out from main corridors to various endings. This is the case of the Green Line in Boston, with 4 light
24
rail lines sharing a common corridor at downtown, thus substantially increasing frequency. LRT trunk-and-feeder services might have traditional buses as feeders as well.
2.2.2.5. System Identity and Image
Identity and image are elements that can be incorporated on a BRT or an LRT system, as key features. Some systems have a strong distinctive image from the rest of the transit network, with their own type of vehicles, corridors, stations, services and fares. They have created a brand, thus making transit riders aware of the differences in service, along with vehicles that are easily differentiated from the standard transit service (Jarzab et al., 2002). Also, aiming at bringing new costumers from cars to public transport, authorities tried different approaches in this area (Kerkhof et al., 2011), varying from specific designed and colored vehicles (BusWay in Nantes, TEOR in Rouen, Trunk Network in Stockholm) to painting bus lanes and busways (almost all UK systems). Another interesting branding solution is found in Las Vegas (ITDP, 2013) with old casino signs at stations.
2.2.2.6. Intelligent Transportation Systems
ITS can be implemented in virtually all components of a BRT or an LRT system. In stations and in vehicles, real-time information about waiting times, next stops and possible intermodal connections can alleviate concerns over the reliability of the service (Wright, 2004). ITS can help the system operation, tracking buses and trains and speed up intersection crossings. Automatic Vehicle Location (AVL) systems locate vehicles on the network, improve dispatch, and allow quicker response to service disruptions and emergencies (Levinson et al., 2003). Traffic Signal Priority systems, such as in Los Angeles (Levinson et al., 2003a) can get up to nine seconds of additional green time when a vehicle arrives at a signalized intersection. Bus guidance systems, another important ITS technology, can be mechanical, optical or magnetic. Other ITS technologies can be applied in fare collection, safety, security, and passenger counting systems.
2.3. Common decision parameters and aspects
A comprehensive literature review led to the identification of a large set of decision parameters and aspects, commonly employed in the decision-making processes, and that can be organized as follows:
25 - operating costs;
- ridership / revenues; - travel time;
- reliability, journey quality, comfort and crowding; - safety;
- fitness and health; - environment.
The next sections will discuss these sets of variables and parameters, by presenting their definitions and ways to estimate and evaluate their values.
2.3.1. Capital costs
Capital costs consist of both infrastructure costs and any related land or property acquisition costs. They are the costs related to the deployment of the system and, depending on the procurement strategy, may include vehicles acquisition costs, fare collection and control systems equipment. Capital costs are normally covered by the public sector through grants. Some of the main factors influencing capital costs are (Wright and Hook, 2007; Hensher and Golob, 2008):
- number and length of exclusive lanes / railways; - materials utilized (asphalt, concrete, rail tracks);
- expected system capacity that influences the size of stations, terminals and depots; - local construction costs;
- amount of property expropriation required; - local context of the negotiation;
- number of bidders; - project financing;
- number of major works such as bridges and tunnels.
The funding recommendations of the US Federal Transit Administration’s (FTA) for the financial year of 2017 (FTA, 2016a) proposes 63 projects ranging from streetcar to commuter rail. Table 5 presents a brief overview on their capital costs.
According to Wright (2004), for the TransMilenio (TM), the BRT system of Bogotá, Colombia, the infrastructure cost division for the initial 37 kilometers are those presented in Table 6. LRT systems infrastructure have a similar cost partition. As shown in Table 6, the total infrastructure cost for