A Work Project, presented as part of the requirements for the Award of a Master Degree in Management from the NOVA – School of Business and Economics
ANALYSIS OF NOS MERGER: THE SHAREHOLDER PERSPECTIVE
EDUARDO DE GOUVEIA QUADRADO MORA MARQUES 1964
A Project carried out on the Master in Management Program, under the supervision of: Supervisor: Prof. Doutor Duarte Ivens Pitta Ferraz
ANALYSIS OF NOS MERGER: THE SHAREHOLDER PERSPECTIVE
Abstract
This research aims to answer the question Did the ZON/Optimus merger added value to the shareholders? Through a quantitative analysis, using data from Bloomberg, companies’ reports and newspapers, a wide range of stock analysis, financial ratios, estimations and comparisons were performed. This study indicates that the merger was successful for the shareholders so far, the company has become stronger, more powerful in the Portuguese market and presents signals of financial sustainability in the long term. There is proved evidence that the merger added value to the shareholders and is on the right way to continue doing so.
Table of Contents
Abstract ... 2
Table of Contents ... 3
Table of Figures ... 4
List of abbreviations ... 5
Introduction, methodology and method ... 6
Literature Review ... 6
Research Method, data collection and sample ... 10
Stock performance analysis ... 11
Long term analysis ... 17
Market Share ... 23
Investment Banks Recommendations ... 25
Dividend analysis ... 26
Conclusion ... 27
Table of Figures
Table 1 - Stock Change before and after the merger ... 13
Table 2 - Stock Change in other Index and Stocks ... 14
Table 3 - Sonaecom/ Optimus Sales Proportion ... 18
Table 4 - ZON and Optimus estimations ... 19
Table 5 - ZON and Optimus combined realistic estimations ... 20
Table 6 - Financial Ratios before and after the Merger ... 21
Table 7 - Financial Ratios in 2015 and 3-year average ... 22
Table 8 – Multiple comparison before and after the merger ... 23
Table 9 - NOS market share evolution ... 24
Table 10 - Investment Banks' Recommendations ... 25
List of abbreviations
M&A Mergers and Acquisitions Telecom Telecommunications
EBITDA Earnings Before Interest, Taxes, Depreciation and Amortization CMVM Comissão do Mercado de Valores Mobiliários
EV Enterprise Value
FCF Free Cash Flow
CAPEX Capital Expenditure
NI Net Income
Rev Revenues
Liab Liabilities
Introduction, methodology and method
ZON and Optimus announced in December 2012 the merger of their operations, which was the largest one in this decade in Portugal. The strategic question of the dissertation has the objective of researching the added value to the shareholders of the merged company NOS from the merger of ZON and Optimus. The methodology adopted will be quantitative, and the method will be the analysis of public available data (e.g. Bloomberg, annual reports, Euronext). The empirical research encompasses 2 sections: the first based on the post-merger NOS market performance, encompassing namely the stock development and performance, volatility. While the second part, will be a brief equity research to analyze performance over time, including pre-merged companies, stock performance sustainability, dividends and the ratings. Part of the research will also include the analysis of the merger, both in the national and international paradigm to conclude on if the merger added value to the international investors.
Literature Review
Harper (1997) and Lehn (2002) confirmed that the telecom sector is one of the most affected by oligopolization. According to Graham and Marvin (1996), the telecom sector relies heavily on the economies of scale and minimal international competition, as the governmental regulation keeps protecting the domestic companies. According to Weston et al (2004), mergers and acquisitions are the least-cost responsive to the deregulation inside the telecommunications industry and to technological change.
Rosenbaum and Pearl (2013) state that the synergies are the primary value enhancers for M&A deals, especially when targeting companies with the same core business. The principle of 2 plus 2 equals five is in the origin of every merger. The timing and success on delivering expected
synergies are decisive factors for the success of the merger which is reflected on the share price movement.
Lebraud and Karlströmer (2001) conducted an analysis of the mergers and acquisitions in the telecom industry, confirming that it has been a very relevant strategy for many years in the sector. According to Farrel (2016), M&A deals in telecom, media and technology are increasing over time, having reached an all-time high in 2015 with transactions valued at 768,3 billion dollars. That is one of the reasons why the sector is so competitive today. According to this research, the motivations for M&A in the Telecom industry have evolved over time. The conclusion achieved in the analysis is that the majority of the deals occur between firms who share the core business and within their domestic market.
Lebraud and Karlströmer also concluded that the future of M&A in Telecom will be determined by the gain of “scale benefits, and whether they can achieve these on a cross-border basis”, “the amount of in-country consolidation that regulators will allow” and the “operator decisions to expand aggressively in non-core areas”.
Kumar (2012) states that until the late 1990s the most common strategy among huge firms were the strategic alliances, however, with the deregulation of the industry cross-border, M&A became the most preferred solution.
According to Ward (2003), there are five reasons for mergers and acquisitions in the telecommunications industry. Theses major forces are the globalization phenomenon, the deregulation, technological change caused by the digital revolution, the search for scale and scope economies as well as the advantages offered under corporate tax laws. On the other hand, Koi-Akrofi (2014) states that the main reasons for M&A activity in the telecommunications industry are the synergies, growth, market standing improvement, wealth creating for shareholders and empire building. A McKinsey report (2001) states that in domestic
acquisitions in telecom, each single percentage point increase in market share can add 0,5 percent to a telecommunication’s firm EBITDA.
In what dividends in the telecom industry are concerned, Blundell-Wignall and Roulet (2013) stated that “companies in low-growth sectors with a high earnings yield (low price to earnings) such as (...) telecommunications (...) pay higher dividends” than high growth companies (with high price to earnings ratio).
Verma and Sharma (2014), conducted an analysis of M&A impact in Indian Telecom firms on their long term performance. Their conclusion was that M&A in this industry, on average, did not “improve shareholder funds of the acquiring firm; rather, it actually decreases them”. In spite of having levered the synergies between the two firms, “they haven’t been able to improve their financial and operational performance”. Another conclusion was that in Telecom, most of the mergers do not aim at “maximizing profits and henceforth, the wealth of shareholders. The decisions for M&A may have been inspired by the intention of empire building, market consolidation or acquiring bigger size.” The major obstacles to M&A success are, for Charman (1999), the inability to sustain financial performance, loss of productivity, incompatible cultures, loss of key talent and clash of management styles. Dixon and Nelson (2005) also stated the following: “three of the five obstacles listed above fall squarely within the human resource arena.”
Bouwman et al (2003) agree that the acquiring firms are losers in the long-run, however, “this underperformance has been attributed to the smallest acquirers”. Related to that comes Girma’s finding (2008) that post-acquisition security prices are higher for larger firms. While hostile offers create value for bidders, mergers do not. On top of that, “diversification tends to destroy value, whereas focus conserves it”. Kemal (2011) conducted an experiment of the impact of a merger in twenty financial ratios concluding that the overall impact was negative. Of course, there is no consensus in this subject and an evidence of that are the conclusions of a similar
study by Altunbas and Ybañez (2004) that proved that there were improvements on the merging firms’ financial ratios. Hu (2009) found mixed financial results after the merger concluding only that the industry and year of transaction are determinant factors of the success of a deal. Mantravadi and Reddy (2008) examined the profitability of acquiring firms and conclusively registering an increase.
Kotzen et al (2003) conducted a study that indicates “that acquisitions that take place during periods with below-average economic growth create more shareholder value than strong-economy acquisitions.” In contrast, Rosen (2006) found evidence that when a market reacts positively to a merger announcement, the tendency is to continue to do so, and also that announcements on hot stock markets tend to have a better reaction. Bruner (2004) added that two-thirds of the mergers analyzed, with only one bidder, had a positive result.
On the other hand, Yen and Andre (2010) disagree stating that the acquiring firms’ shareholders could expect at maximum a break even, when loss is the most likely scenario.
To sum up, M&A deals have been very relevant inside the telecom industry. There is no general opinion on the success of this strategy as there are different factors that determine the success of each case which has to be analyzed individually. The success of a merger can be measured by comparing financial ratios, the profits and the stock performance.
Research Method, data collection and sample
This section summarizes the data collection, the sample selection, and the method of analysis adopted in the research.
Data collection: All daily stock last price data was collected from Bloomberg. This data was
used to calculate the percentage change of the stock price during that period by comparing the last value with the first and was also calculated the volatility by computing the standard deviation of the daily changes of stock prices. Since the merger resulted in an incorporation of Optimus in ZON, NOS SGPS stock price was used as a reference, Sonaecom (former major shareholder of Optimus) has a stake of NOS but it reflects a smaller part of its operations. All the quantitative data was collected from companies’ websites and newspaper articles.
For the equity analysis of ZON, since it was listed in the Stock Market, all the yearly financial results information is available online. On the other hand, Optimus was not listed, so the only information available is the one inside Sonaecom’s reports, which does not include profits from Optimus, only revenues, costs and EBITDA. As there is little information about Optimus financial performance, a proportion was made between the company and Sonaecom in order to have an approximate value for each of the values of the income statement and statement of financial position. According to Fernández (2006), “a company’s profit after tax is quite an arbitrary figure, obtained after assuming certain accounting hypotheses regarding expenses and revenues. On the other hand, its cash flow is an objective measure, a single figure that is not subject to any personal criterion”. The research will focus on the analysis of the net income, and particularly on the free cash flow generated by the new merged company.
Sample selection: To compare NOS stock performance six different bundles of stocks where
selected. The first is the Portuguese Index, PSI 20 and the second includes all the Portuguese listed companies that were traded since the merger was announced until now. The third includes
the fifty closest firms to NOS by market capitalization, in the Media Industry, according to Bloomberg. The fourth involves the fifty biggest telecom companies, by market capitalization, also according to Bloomberg. Then, one that includes the major listed NOS shareholders, as of 24 March 2016. The last one includes twenty different companies in different time periods, after a merger or acquisition between two strong players in the market. The biggest in terms of market capacity from those that resulted on a firm that is still listed were chosen. All stock price data for this quantitative analysis was collected from Bloomberg.
Method of analysis: To eliminate the ‘speculation effect’ on the post-announcement of the
merger on the stock prices, a two-month period of abnormal returns was stipulated based on Bessembinder and Zhang conclusion in their paper Overreaction to Merger and Acquisition Announcements (2015). For this reason, in all the stock bundles analyzed, the first two months after the M&A announcement were ignored. For consistency purposes, the time period under study was the same for every stock, the same as the period between two months after NOS merger announcement (14 February, 2013) and the 24 March, 2016, corresponding to three years, 1 month and ten days. For the past merger and acquisitions newspapers and companies’ institutional websites were used for finding the official announcement date.
For the financial statement analysis and trend creation for the pre-merger companies, data from the companies’ yearly financial report was collected and a five-year period was analyzed. However, for the stock price analysis, only data from the four-year period before the merger announcement was used. If one additional year had been included, the effects of Sonaecom takeover attempt over Portugal Telecom would be reflected. These effects, generated huge speculation on the stock market but had little effect on company activity. Financial multiples and ratios were also considered to complement the analysis.
Stock performance analysis
The merger by incorporation of Optimus in ZON, firstly creating ZON-Optimus was launched in the stock market right after the merger conclusion, on August 2013, increasing the equity by 66% and the number of outstanding shares by 206.064.552 (CMVM, 2013). On May of the next year, the official name was changed to NOS. ZON was the 8th biggest company in the PSI 20 before the merger and now is the 6th.
As Hogan & Overmyer-Day stated (1994), there appears to be a developing consensus that M&A performance should be based on performance over a two-year period. ZON-Optimus merger was approved on August 2013 and on the beginning of March of 2016 the results of the second year of the new firm, NOS, were announced, so it is now possible to perform a financial analysis of the firm and understand how successful the merger was.
The stock price movement is an indicator of how the markets assess the current value of the firm, it is correlated with financial crisis, wars, and with the application of strategies by the companies in the industry. With the information on the stock price change it is possible to say how the market reacted to a merger, in the short run, and that will be what the first part of the research consists on.
For the stock performance analysis, a research was performed on the evolution of the last daily prices of the stocks of NOS (ZON Multimedia and PT Multimedia previously), until the 24 March, three weeks after the announcement of the 2015 results, when NOS stocks were traded at 5,88€.
According to Bessembinder and Zhang (2015), there is a significant overreaction to merger and acquisition announcements on the first two months after the official announcement. The two professors studied the Cumulative Abnormal returns, concluding that they were negative
(-3,5%) on the two months following the merger or acquisition announcement in the top 10% speculative stocks.
This study was made with an analysis of the “returns to target firm shareholders in the months following announcements of potential acquisitions of publicly traded firms” for “6,413 mergers and acquisitions announced between 1980 and 2012.”
In the case of NOS, on the two months after the announcement, the stock price increased 24,3%. This performance was caused to a certain extent the by speculation on the merger so two different periods of analysis will be considered for the NOS stock price analysis.
The first period are the four years prior to the announcement, the typical five-year period analysis will not be used due to the fact that the effects of the Sonaecom takeover attempt over Portugal Telecom on the ZON stock price still existed in the end of 2007 (PT Multimedia was spun of from Portugal Telecom as a measure to prevent the takeover). The second period englobes the first day after two months of the merger announcement, the 14 February 2013 until the 24 March 2016. On the following table the stock price change and volatility during the two periods is presented.
Table 1 - Stock Change before and after the merger
Period Stock Price % Change Stock Volatility 14/12/2008 – 14/12/2012 -5,89% 0,019421 14/02/2013 – 24/03/2016 82,48% 0,017559
(Source: Bloomberg)
At a first look, the merger appears to have had a positive result for NOS shareholders. While in the last 4 years of ZON the stock price decreased by almost 6%, the merger brought an increase of more than 82%, later on this research a conclusion will be determined on the reflection of whether this price change is added value to the investors or not. On top of that, the volatility
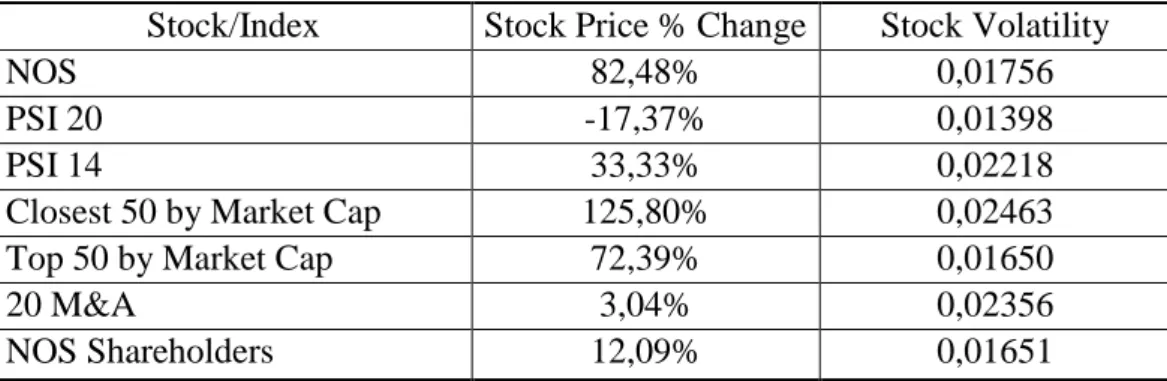
investors. However, it is relevant to compare the performance of NOS stocks with other environments (indexes and stocks), as most of the shareholders are international institutions with whom the Portuguese listed stocks compete along with other companies from all over the world. For this reason, another 6 indexes and stocks were also researched for analysis. The time series is within the same time range, the 14 February 2013–24 March 2016 (37 months). The following table includes all the comparisons and later explains why they were chosen as well as what can be concluded.
Table 2 - Stock Change in other Index and Stocks
Stock/Index Stock Price % Change Stock Volatility
NOS 82,48% 0,01756
PSI 20 -17,37% 0,01398
PSI 14 33,33% 0,02218
Closest 50 by Market Cap 125,80% 0,02463
Top 50 by Market Cap 72,39% 0,01650
20 M&A 3,04% 0,02356
NOS Shareholders 12,09% 0,01651
(Source: Bloomberg)
NOS main competitors are Vodafone, a global firm listed in London, and Portugal Telecom which was divided last year. The MEO Communications was sold to the French group Altice and PT segment that owned the participations in Rio Forte and Oni being listed as Pharol. As the impact of the Portuguese operations are not relevant for the performance of Vodafone and Altice stocks, it is impossible to compare NOS stock performance with its competitors’.
The first comparison is to determine whether the stock, disregarding its increase, over performed the domestic market, the PSI 20. Despite the smaller volatility of the PSI 20 Index, which according to the laws of the statistics was expected given that a bigger number of samples means a smaller standard deviation, the stock value change was much bigger in NOS than in
the Portuguese Index, which on top of that was negative. NOS was overall, a good stock to invest in Portugal since the returns were substantially higher than the average (which was negative). For the period in analysis it was the 3rd top performing stock in the PSI 20 after Altri and Semapa.
Since the announcement of the merger, the PSI 20 suffered changes, some companies were removed and others were added. An interesting analysis would be to compare NOS stock price with those that remained in the Index during the whole period in analysis, which includes 14 companies, forming the “PSI 14”. As these Index does not include bankruptcy firms such as BES and Banif, the expected returns are higher than the returns from PSI 20. In spite of the latter NOS managed to over perform this Index even with a lower volatility.
Since NOS was the 3rd best performing stock of the period in analysis, this result was expected, as the typical exiting firm from the stock market is a bad performing one. In conclusion, on a national basis, the ZON-Optimus Merger was positive for the ZON/NOS shareholders, granting much higher returns than the average stock in PSI 20.
Regarding international companies, the first comparison will be with the Industry 50 closest
companies by market capitalization. From these 50 companies [Bloomberg] six were taken
out because they were not listed yet on the beginning of the period in analysis. Due to the fact that the Portuguese market is smaller and better established than the ones in scope, some of those 50 companies are still growing, and are not established as NOS is, so their stock price growth cannot be compared the NOS which only competes on a consolidated 10 million market. As expected, and due to the high amount of Asian emerging countries’ companies, the stock increase was much higher than NOS’ and so was the volatility, as growing companies’ stocks are more vulnerable to idiosyncratic effects. For this reason, the performance of the 50 biggest
telecom companies in the world, which are already established in their markets, will be added
to this analysis. There is evidence that NOS outperformed the latter group, despite the higher volatility.
To continue the stock performance analysis, the stock price change for 20 companies involved
in mergers and acquisitions was analyzed. These mergers and acquisitions occurred in
Europe, America and Asia and all of them involved close competitors. Cases like this were chosen specifically in order to maximize the similarity with NOS.
Findings from Stunda (2014) suggest that for merging companies, the 2009-2012 period presents a significantly negative stock price effect when compared to the 2004-2007 period. From the 20 mergers analyzed, 4 occurred on that period. If the 2008 financial crisis and its impact on the stock market is considerer, 4 other mergers were affected. If the 2000-2003 breakdown in S&P 500, CAC 40, FTSE 100 and DAX 30 is also considered, 8 other mergers were affected. For this reason, it is not possible to reach a conclusion and there is no valid interpretation for the result presented (3,044%).
Finally, the last comparison will be between NOS and its main shareholders. The aim of this part of the research is to understand if an investment in NOS would be more profitable than an investment in the own company. The point is to justify whether the investment in NOS was profitable for the shareholders of NOS’ shareholders. To do so the change in stock price of some of NOS largest shareholders was computed. Since they increased an average of 12,09%, which is far below than NOS performance, it appears to have been an advantageous investment. In that sense, for instance a BPI or a Sonaecom shareholder does not have motives to question the investment in NOS stocks.
The time period analyzed ended on the 24 March 2016, however, the conclusion still holds until the present as the value of NOS has increased since then, being traded at 6.51€ as of 20 May 2016, corresponding to a total increase of 102% since the beginning of the research period. Considering that on the first day of ZON-Optimus, approximately 513,5 million stocks were traded at 3,9623. This current value corresponds to an increase in the market capitalization of around 1200€ million.
The NOS merger could be viewed as a success in the short-run, based on the stock performance, but assessing the success on the long run requires a deeper analysis of the change in the financial indicators and in the statement of financial position, to understand whether the short-run success is or is not sustainable and if the merger will continue to add value.
Long term analysis
After analyzing the impact of the merger on the shareholders it is time to analyze it in the company performance, to understand whether the good performance in the stock market is still based on speculation or if the company presents a sustainable growth and better financial health, which means that the success of the merger will be sustainable on the long run. DePamphilis (2014) states that examining post-merger accounting and other performance measures on the three to five years prior to the merger are relevant to determine how performance changed. The information available on ZON’s yearly reports can be used to compute the average growth rate on the five years prior to the merger (2008-2012) of several indicators of the statement of financial position and income statement. This average is then used to estimate the values that ZON would present if the merger did not occur for the years after the merger (2013-2015). In some reports, the information was different from the previous one due to alterations in the
accounting method, in that case, the most recent information was prioritized and past information was adjusted to it.
As Optimus was not listed in the stock market, the information available of the firm is not sufficient to perform a financial analysis. On the other hand, Sonaecom was listed until the end of February 2016, before the takeover on the not owned equity. Optimus financial information can be estimated based on information from Sonaecom.
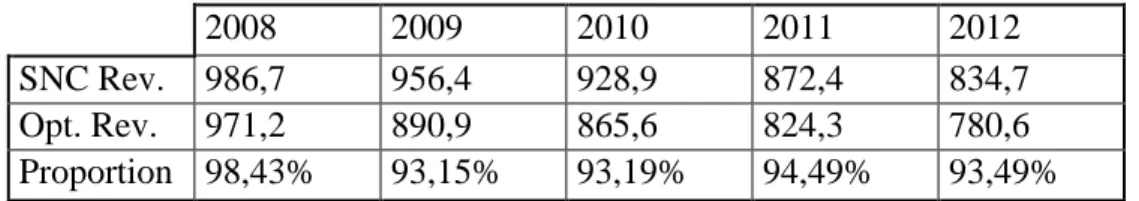
A proportion between the revenues of Soanaecom group and Optimus revenues that are announced on group financial reports was estimated and then an average of this proportion across the five years before the merger was computed.
Table 3 - Sonaecom/ Optimus Sales Proportion
2008 2009 2010 2011 2012
SNC Rev. 986,7 956,4 928,9 872,4 834,7 Opt. Rev. 971,2 890,9 865,6 824,3 780,6 Proportion 98,43% 93,15% 93,19% 94,49% 93,49% Values in Thousands of Euros.
(Source: NOS and Sonaecom financial reports)
The five-year average is 94,55%, so from now on will be assumed that 94,55% of Sonaecom indicators represent Optimus stake on the firm. A similar proportion was computed with the EBITDA of the company and the group reaching a percentage of 98%. Based on Optimus’ yearly reports, an estimation for the Revenues, EBITDA and CAPEX growth was performed for the next three years. Then, an estimate of the Net Income and FCF for the 2013-2015 period was also performed. Using an average of the proportions calculated previously, it was reached a possible value of Optimus Net Income and FCF estimates. Finally, those values were added to ZON estimations and compared to the reality, the post merger company performance over the last three years. Although Optimus’ operations may represent around 94,55% of Sonaecom
operations, the presence of Optimus in the statement of financial position is not so influential. The average value of the assets, liabilities and equity of Sonaecom before the merger is 1938,76, 947,28 and 991,5 respectively. While after the merger the values were the following: 1136,73, 76,60 and 1060,17, for assets, liabilities and equity. Based on these values one can estimate the percentage of each one of these that represents Optimus, adjusting the equity value so that its sum with the liabilities equals assets. An estimation for the 2013-2015 period was also conducted and then the Optimus percentage stake was applied for the value of the Total Assets and Liabilities. The Equity is the difference of the other two indicators. The computed values are presented on the following table.
Table 4 - ZON and Optimus estimations
Rev. EBITDA CAPEX FCF NI Assets Liab. Equity NOS 1444,3 533,1 408,3 37,5 82,7 2976,5 1913 1063,5 ZON 937,31 381,09,9 115,44 76,63 38,93 1888,8 1646,6 242,2 Optimus 662,75 338,9 105,16 -29,73 182,35 776,83 639,13 129,7 Z+O 1600,1 719,9 220,6 49,9 221,3 2665,6 2285,73 371,9 Values in Thousands of Euros
(Source: NOS and Sonaecom financial reports)
The table does not show evidence of financial growth. Although the ratio between assets and liabilities got better, the revenues, EBITDA, FCF and Net Income got reduced. On a first look the merger appeared to have destroyed value. However, it is important to have in consideration two aspects: the first is that both Optimus and ZON’s revenue growth rates have been decreasing in the last 3 years (the 5 year increasing growth rate is supported by the 2009 and 2010 values), as well as the CAPEX and market share, which shows that both companies were slowing down and needed a new strategy to survive this very competitive market. On the other hand, NOS has been increasing the revenues, EBITDA and Net Income since the merger and
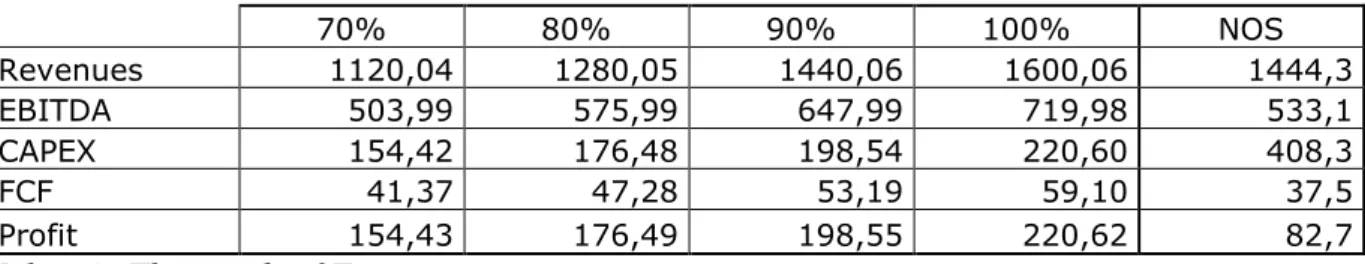
becoming more competitive and preparing for the international expansion, presenting a tendency for financial growth. Taking into account that the 3-year tendency of ZON and Optimus was not to grow, a study was performed to estimate the value of the two pre-merger companies combined on the long-run. Also, it is relevant to understand that the increase in SONAECOM profits and revenue derives from the fact that the group is investing in other activities with more potential to grow. So, 3 scenarios were assessed. The first scenario includes the estimates of pre-merger companies combined as if their performance only corresponds to 90% of the estimated potential. A more likely scenario due to the fact that the companies did not increase their operations and were losing market share to the competitors. The same study was performed to an 80% and 70% comparison, all of them likely, depending on the time period and presence of innovative strategies.
Table 5 - ZON and Optimus combined realistic estimations
70% 80% 90% 100% NOS Revenues 1120,04 1280,05 1440,06 1600,06 1444,3 EBITDA 503,99 575,99 647,99 719,98 533,1 CAPEX 154,42 176,48 198,54 220,60 408,3 FCF 41,37 47,28 53,19 59,10 37,5 Profit 154,43 176,49 198,55 220,62 82,7
Values in Thousands of Euros
(Source: NOS and Sonaecom financial reports)
If the two ex-companies only assured 90% of the estimates for 2015, the revenues would be lower than NOS’ and the EBITDA would be lower on a 70% scenario. Following the Professor of Financial Management of IESE, Pablo Fernández (2006) statement about the importance of the FCF when compared to Net Income it is conclusive that despite the small difference on the FCF of NOS and the ex-companies combined, it is by far compensated with the difference on
the Capital Expenditure. Which means that NOS is presenting positive results even though the high investment, which will have positive consequences in the future.
To continue this research an empirical analysis was performed. A method to assess the differences in the financial health of a firm can be obtained by comparing financial ratios. To be the most complete possible, 19 ratios were analyzed (liquidity, profitability, leverage, return on investment, market stock). The ratios refer to the average of the 5-year period results before the announcement of the merger (2008-2012) and the 3-year period after the merger (2013-2015).
Table 6 - Financial Ratios before and after the Merger
Pre Merger average Post merger average Better Performance
Current Ratio 84,34% 52,89% ZON
Acid Test Ratio 76,93% 49,23% ZON
Cash Ratio 40,94% 4,01% ZON
Working Capital -93,38 -412,40 ZON
Return on Assets 2,13% 2,49% NOS
Return on Equity 15,41% 6,94% ZON
Gross Profit Margin 75,36% 73,05% ZON
Net Profit Margin 4,02% 5,19% NOS
Op. Profit Margin 11,40% 10,75% ZON
Net Debt / EBITDA 213,17% 188,18% NOS
Total Debts to Equity 622,91% 178,36% NOS
Financial Leverage 722,93% 278,36% NOS
Interest/Cover. Ratio 276,65% 280,55% NOS
Debt Ratio 86,16% 64,07% NOS
Long Term D/E 287,55% 70,44% NOS
Ret. on Capital Employ 9,22% 7,08% ZON
EBITDA/EV 34,25% 27,86% ZON
Earning Per Share 0,1103 0,1431 NOS
Earning Yield Ratio 0,0241 0,0198 ZON
(Source: NOS and Sonaecom financial reports)
In 10 ratios the company performed better before the merger and in 9 ratios performed better after. Although the outperformance of NOS on the leverage ratios and the underperformance
Damodaran (2016) conducted a study on 65 telecommunications companies from the 5 continents, concluding that the average return on equity of the industry is 12,21%, NOS was closer to this average before the merger.
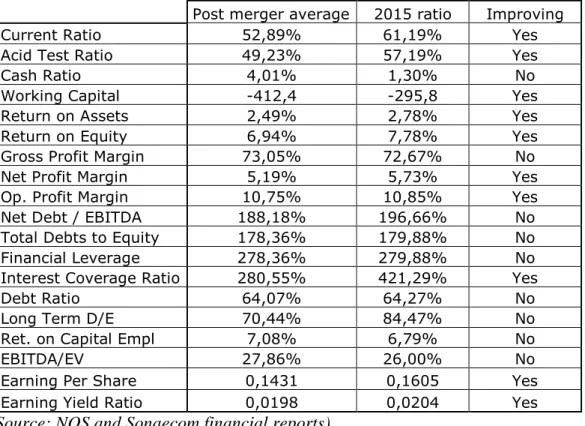
The results of the 3 years of NOS existence have changed dramatically, so it is important to compare the current value with the 3-year average to understand what direction are there ratios going. The results are presented on the following table:
Table 7 - Financial Ratios in 2015 and 3-year average
Post merger average 2015 ratio Improving
Current Ratio 52,89% 61,19% Yes
Acid Test Ratio 49,23% 57,19% Yes
Cash Ratio 4,01% 1,30% No
Working Capital -412,4 -295,8 Yes
Return on Assets 2,49% 2,78% Yes
Return on Equity 6,94% 7,78% Yes
Gross Profit Margin 73,05% 72,67% No
Net Profit Margin 5,19% 5,73% Yes
Op. Profit Margin 10,75% 10,85% Yes
Net Debt / EBITDA 188,18% 196,66% No
Total Debts to Equity 178,36% 179,88% No
Financial Leverage 278,36% 279,88% No
Interest Coverage Ratio 280,55% 421,29% Yes
Debt Ratio 64,07% 64,27% No
Long Term D/E 70,44% 84,47% No
Ret. on Capital Empl 7,08% 6,79% No
EBITDA/EV 27,86% 26,00% No
Earning Per Share 0,1431 0,1605 Yes
Earning Yield Ratio 0,0198 0,0204 Yes
(Source: NOS and Sonaecom financial reports)
Again, 10 ratios are moving towards a healthier value while 9 are not, so no conclusion can be made.
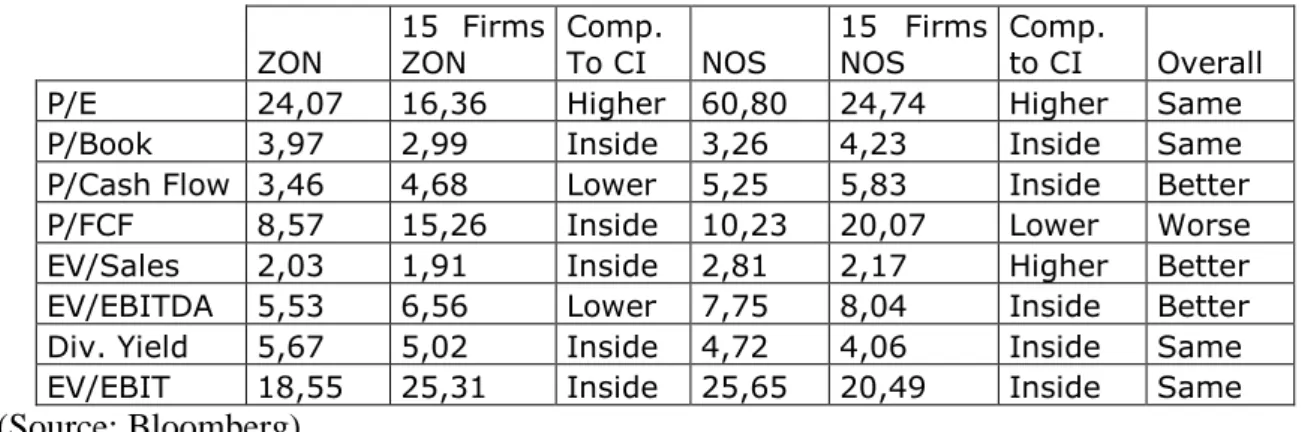
Finally, to complete this part of the research, it is required a relative valuation of NOS. For that, a sample of 15 big European and American telecom firms with a similar stock performance as NOS were analyzed. The stock price movement is an important filter for this part of the research
The 8 eight valuation multiples directly presented in Bloomberg terminal were observed. In order to make a more reliable comparison, 95% confidence intervals were calculated for the time periods before and after the merger and compared to the multiples’ values of ZON and NOS to understand whether they lay on the confidence interval or not and if not, if they are above of below the interval.
Table 8 – Multiple comparison before and after the merger
ZON 15 Firms ZON Comp. To CI NOS 15 Firms NOS Comp. to CI Overall
P/E 24,07 16,36 Higher 60,80 24,74 Higher Same
P/Book 3,97 2,99 Inside 3,26 4,23 Inside Same
P/Cash Flow 3,46 4,68 Lower 5,25 5,83 Inside Better
P/FCF 8,57 15,26 Inside 10,23 20,07 Lower Worse
EV/Sales 2,03 1,91 Inside 2,81 2,17 Higher Better EV/EBITDA 5,53 6,56 Lower 7,75 8,04 Inside Better Div. Yield 5,67 5,02 Inside 4,72 4,06 Inside Same EV/EBIT 18,55 25,31 Inside 25,65 20,49 Inside Same (Source: Bloomberg)
From the 8 multiples, 6 have increased after the merger. Before the merger, 2 multiples were lower than the average and 1 was higher (for a 95% confidence level). On the other hand, there is significant evidence that after the merger, 2 multiples were higher than the average and 1 was lower. On the overall, from the 8 multiples observed with a 95% confidence level, it could be concluded that 3 got better after the merger, 1 got worse and 4 remained the same which means that the merger had a positive impact in NOS when compared to the industry.
Market Share
The 3 telecom companies that operate in Portugal are competing for the 10 million Portuguese population. Since the ZON/Optimus merger, none of the the telecom companies initiated relevant international expansion strategies (except from Vodafone Group and Altice but that is
irrelevant for this analysis), so the more direct way to increase revenues is to conquer market share to the competitors. If the market shares of the different services are increasing, it is a good sign that the merger is having a positive impact on the firm market power. In the Anacom (Communications National Authority) website is presented data from the market shares since the 3rd trimester of 2014 until de last of 2015. Based on that, an estimation was made for the following two trimesters to understand the tendency.
Table 9 - NOS market share evolution
(Source: Anacom)
According to the graph, most of the services are increasing its market share. Double play and triple play are losing market share which is being compensated with the increase in the quadruple and quintuple play. The only evident decline is on the paid TV service, which has been declining for ZON Multimedia since the deregulation of the market and the entrance of the big competitors in this sector.
Investment Banks Recommendations
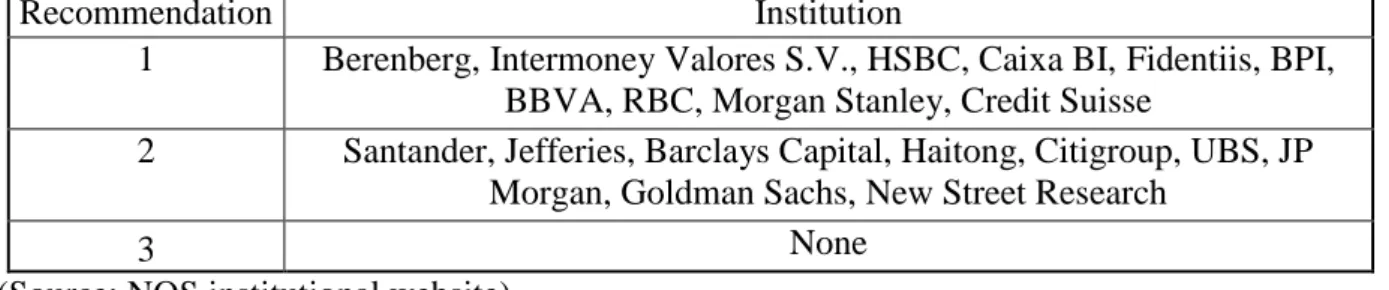
Listed companies very often have their stocks analyzed by financial experts who make recommendations on the stocks, based on their future value and performance. As banks use different names for each category, the similar ones are grouped together using numbers, with the following connotation:
1 – Buy, Strong Buy, Outperform, Overweight 2 - Neutral, Equal weight, Hold
3 – Sell, Underperform, Underweight
Table 10 - Investment Banks' Recommendations
Recommendation Institution
1 Berenberg, Intermoney Valores S.V., HSBC, Caixa BI, Fidentiis, BPI, BBVA, RBC, Morgan Stanley, Credit Suisse
2 Santander, Jefferies, Barclays Capital, Haitong, Citigroup, UBS, JP Morgan, Goldman Sachs, New Street Research
3 None
(Source: NOS institutional website)
This table shows the latest recommendation from some of the biggest banks in the world. Considering that none of the Investment banks analyzed recommend selling, it could be assumed that the analysts have a generalized positive opinion on the future performance of NOS’ stock. Investment banks agree that NOS will grow and that the stock increase is sustainable in the long term.
Dividend analysis
In what concerns the dividend policy, telecommunications companies present more stable and predictable results, they are less vulnerable to the overall market volatility and don’t invest as much of the profits compared to companies in other sectors. For this reason, they can support bigger payout ratios than cyclical firms.
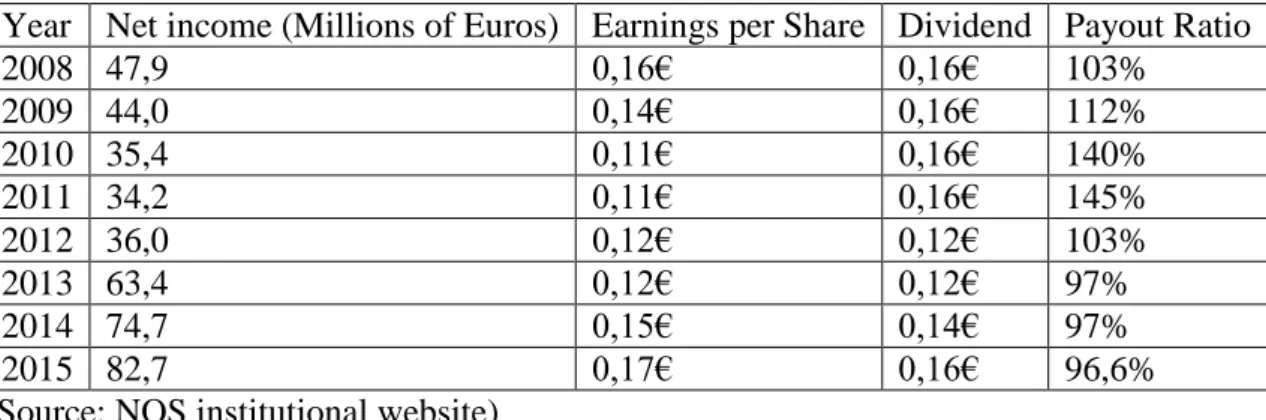
PT Multimedia (prior ZON Multimedia) was spun-off during the Sonaecom takeover attempt on PT Comunicações. During this period, the dividend policy was aggressive and for this research the policy will only be analyzed since after the attempt, when ZON was created. The dividends paid are showed on the following table.
Table 11 - Dividends in each year
Year Net income (Millions of Euros) Earnings per Share Dividend Payout Ratio
2008 47,9 0,16€ 0,16€ 103% 2009 44,0 0,14€ 0,16€ 112% 2010 35,4 0,11€ 0,16€ 140% 2011 34,2 0,11€ 0,16€ 145% 2012 36,0 0,12€ 0,12€ 103% 2013 63,4 0,12€ 0,12€ 97% 2014 74,7 0,15€ 0,14€ 97% 2015 82,7 0,17€ 0,16€ 96,6%
(Source: NOS institutional website)
If one had invested 100€ in NOS 4 years before the announcement and reinvested the dividends in more stocks, one would have 290€ today. Besides that, if the 100€ were invested when the merger announcement was made, today the stocks would be worth 271,5€.
Damodaran (2016) conducted a study on 65 telecommunications companies from the 5 continents, concluding that the average payout ratio was 124,64% (Jan 2016), the 3rd highest after Real Estate (449,37%) and Oil/Gas Distribution (225, 73%). In the case of NOS, the almost 100% payout ratio is sustainable because the dividends from the shares owned by the
in the next year can be higher than 100%. According to Gaughan (2011), most deals utilize a third subsidiary corporation that is created to facilitate the acquisition. In this case, the third company is Zopt and it still exists representing Isabel dos Santos and Sonaecom stake.
Conclusion
The aim of the research was to analyze the profitability of ZON/Optimus merger for the shareholders. The merger was consolidated in August 2013 so the data available from then until now can be used to determine the short term success.
Comparing the stock price movement with the national and international paradigm, the merger appears to have achieved the objective, as NOS’ stock was the 3rd best performer
in the PSI 20 and above the average of the biggest, established players in the telecom industry and also over performed its investors’ performance.
When comparing NOS financial statements with the predictions of ZON and Optimus for the past 3 years, NOS appears to be worth less due to the lower profits and lower FCF however, its growing revenues and profits, aligned with a much bigger CAPEX value show that NOS is on a different stage than the ZON and Optimus estimations. NOS is consolidating its position in the market and preparing for international expansion while ZON and Optimus showed a tendency to underperform.
From the 19 financial ratios analyzed (liquidity ratios, profitability ratios, solvency ratios, return on investment ratio and market stock ratios) 10 were more favorable before the merger and 9 were after, so no conclusion could be made.
The 3-year average of the 19 ratios was compared with the latest year value (2015) to analyze the evolution of the ratios. Again, no conclusion could be made.
Through the multiples valuation, it was concluded that NOS is now performing better than its peers than before the merger. From the 8 multiples analyzed, 3 got better and only 1 got worse.
Despite the decline of the market shares of the double play and triple play services, which are compensated with the increase the quadruple play and quintuple play, NOS is facing a general increase in market share and the tendency is also positive. With exception to the paid TV which has been declining since the deregulation of the market From the 20 banks observed, 10 recommended holding the stock while 10 recommended buying NOS stocks, with none recommending to sell or expecting an underperformance.
If the profit from dividends were reinvested in more stocks at the time they were paid, for each 100€ invested in ZON 4 years before the merger, the investor would now have 290€ and for each 100€ invested when the merger was announced, the current value of the stocks would be 271,5€. There is clear evidence that the merger added value to the shareholders.
On the overall, regarding all topics mentioned above, there is significant evidence that the merger added value to the shareholders.
As mentioned before, 2 years is the period after which is possible to analyze the impact of a merger. Since the results of the 2 complete years of operations were disclosed on March of 2016, this research was the first research ever made about this topic so it is an important contribution to the world of business.
In what concerns the body of knowledge, this research presents several methods to analyze a merger. It indicates how to analyze in the short and long run.
Further suggestions:
Analyze the consumer perspective to the merger, understand if NOS brand image had a positive impact on the consumers. Study the movement of the telecom prices and compare it with the period before the merger. With this could be concluded that the market became more competitive. Interviews can be performed to get a general opinion. Besides that, according to the biggest shareholder, Isabel dos Santos (2013), the power of the new company and the multi market vision of its shareholders will open doors for expansion to other countries. This means that despite the success that NOS is having in Portugal, it is expected to be even bigger after the internationalization.
References
Altunbas, Yener and Ybanez, David. 2004. “Mergers and Acquisitions and Bank Performance In Europe: The Role of Strategic Similarities.” European Central Bank Working Paper Series no 398: 7-26.
Bessembinder, Hendrik and Zhang, Feng. 2015. “Overreaction to merger and acquisition announcements”. Available at SSRN:
http://ssrn.com/abstract=2595329 or http://dx.doi.org/10.2139/ssrn.2595329. 2-5
Blundell-Wignall, Adrian and Roulet, Caroline. 2013. “Long-term investment, the cost of capital and the dividend and buyback puzzle”, OECD Journal: Financial Market Trends, 2013(1): 9-11
Bouwman, Christa, Fuller, Kathleen and Nain, Amrita. 2003. “Stock Valuation and mergers. A review of research that explores the link between valuation, activity and performance.” MIT Sloan Management Review (Fall): 9-11
Bruner, Robert F. (2004). Applied Mergers & Acquisitions. Hoboken, N. J: Wiley & Sons Inc. 62-63.
Cartwright, Sue and Cooper, Cary. 1996. Managing Mergers, Acquisitions and Strategic Alliances: Integrating People and Cultures. New York, N.Y: Butterworth-Heinemann. Charman, A. 1999. “Global mergers and acquisitions: The human resource challenge.” Focus Paper, Alexandria, VA: Society for Human Resource Management, Institute for International Human Resources International Focus.
Damodaran, Aswath. 2016. “Dividend Fundamentals by Sector”. Retrieved from: http://pages.stern.nyu.edu/~adamodar/New_Home_Page/datafile/divfund.htm (accessed May 21, 2016)
Farrel, Michael. 2016. “Global Telecom, M&A Reached All-Time High in 2015”. Multichannel, 14 January 2016.
http://www.multichannel.com/news/cable-operators/global-telecom-ma-reached-all-time-high-2015/396561 (accessed May 21, 2016)
Fernández, Pablo. 2006. “Cash Flow is cash and is a fact: net income is just an opinion”. IESE Business School – Universidad de Navarra Working Paper no 629
Gaughan, Patrick A. 2011. Mergers, Acquisitions and Corporate Restructurings. Hoboken, New Jersey: John Wiley & Sons, Inc. 24-25
Girma, Sourafel .2008. “The impact of mergers and acquisitions on earnings and stock prices.” Journal of Globalization and Labor Markets (Spring): 63-82
Graham, Stephen, and Marvin, Simon. 1996. “Telecommunications and the city: Electronic spaces, urban places”. London and New York: Routledge
Harper, John. 1997. Monopoly and competition in British telecommunications: The past, the present and the future. London: Pinter Publishers.
Hogan, E. and Overmyer-Day, L. (1994). “The psychology of mergers and acquisitions.” International Review of Industrial and Organizational Psychology. Vol. 9 (C.L. Cooper and I.T. Robertson, eds), Chinchester: John Wiley & Sons. 247-279
Hu, Y. (2009). “The long-term performance of acquiring firms: Evidence from Chinese Stock Markets”. Journal of International Business. 66-83
Kemal, Muhammad. 2011. “Post Merger Profitability: A Case of Royal Bank of Scotland”. International Journal of Business and Social Science, 5:22-41.
Koi-Akrofi, Godfred. 2014. “Motives for Telecom Mergers and Acquisitions”. International Journal of Innovation and Applied Studies, 9:1809-1817
Kotzen, J., Neenan, C., Roos, A. and Stelter, D. 2003. “Winning through Mergers in Lean Times”. Research report, Boston Consulting Group.
Kumar, Rajesh, B. 2012. Mergers and Acquisitions: Case Studies from Key Industries. London, Palgrave Macmillan, 1st edition. 61-62
Lebraud, Jean-Christophe and Karlströmer, Peter. 2001. “The future of M&A in Telecom”. McKinsey & Company Telecom, Media & High Tech Extranet
Lehn, Kenneth. 2002. Corporate governance in the deregulated telecommunications industry: Lessons from the airline industry. Telecommunications Policy, 26:225-242.
Mantravadi, Pramod and Reddy, A. Vidyadhar. (2008). “Post-merger performance of acquiring firms from different industries”. International Research Journal of Finance and Economics, 15:44-67
McKinsey and Company. 2001. Reshaping telco organization to meet the industry’s new challenges. Telecommunications, Media and Technology Practice and Organizational Practice, March 2011.
Rosen, Richard. 2006. “Merger Momentum and investor sentiment: the stock market reaction to merger announcements”. Journal of Business, 79: 987-1017
Rosenbaum, Joshua and Pearl,, Joshua. 2013. Investment Banking: Valuation, Leverage Buyouts, and Mergers & Acquisitions. New Jersey, Wiley. , 2nd Edition. 357
Stunda, Ronald. 2014 “The market Impact of mergers and acquisitions on acquiring firms in the U.S.” Journal of Accounting and Taxation, 6:31-37
Verma, Neha and Sharma, Rahul. 2014. “Impact of Mergers & Acquisitions on Firms’ Long Term Performance: A Pre & Post Analysis of the Indian Telecom Industry”. International Journal of Research in Management Technology, 4:11-17
Ward, Barney. 2003. “Mergers and Acquisitions in the Telecommunications Industry”. Growth and Change, 34:321-344
Weston, J. Fred, Mitchell, Mark, L., Mulherin, J. Harold. 2004. Takeovers, Restructuring, and Corporate Governance. New Jersey, Pearson Prentice Hall, 4th Edition. 188-190.
Yen, Tze-Yu and Andre, Paul. 2010. “The effects of ownership structure of acquiring firms.” Journal of Business Policy Research, 5:59-76