Are the States United? An analysis of US hotels’ offers through TripAdvisor’s eyes
ABSTRACT
This empirical data-driven research aims to unveil thought-provoking insights on the United States (US) hotel offer across its 50 states. Information of more than thirty thousand hotels was collected through web scraping from TripAdvisor. Using such data, 50 support vector machine (SVM) models were trained to model the TripAdvisor score, one per state, to assess the convergent and divergent factors in customer satisfaction across all the US states.
A conceptual model is proposed and validated through the data-driven SVM models developed for each state to identify convergent features across the states to explain customer satisfaction (here represented by TripAdvisor score). Hotel size, price, and stars are not moderated by the location, expressed by the corresponding state, although these highly influence satisfaction, whereas both hotel number of published photos and the amenities are affected by the location. Thus, adaptation issues were found regarding amenities and published photos within each state’s offer.
KEYWORDS
1. INTRODUCTION
Tourism analytics is a novel research trend that emerged from data analytics to leverage tourism knowledge based on available Big Data sources, from which social media is one of the most prominent (Aluri et al., 2018; Marine-Roig & Clavé, 2015; Moro et al., 2018b). Social media includes any online platform developed under the Web 2.0 paradigm, where the user is the major content contributor (Kaplan & Haenlein, 2010). Tourism is among the pioneer industries to implement a popular format of social media on a worldwide scale: online review platforms (Moro & Rita, 2018). One of the most recognized is TripAdvisor, where users are encouraged to write their opinions about the hotels where they stayed (Moro et al., 2019). Therefore, it is one of the information richest online review platforms where relevant information about hotels can be found.
The United States (US) is one of the largest and most populated countries in the world and with both Atlantic and Pacific coasts. The regional asymmetries across its 50 states are widely known (Voulgaris et al., 2017), with coastal states being the most densely populated and wealthier ones (e.g., California, New York, Florida). The US government has recently adopted a public data policy, providing free access to government data, including travel and tourism information (Zuiderwijk & Janssen, 2014). Travel and tourism researchers have taken advantage of such data in studying problems such as modeling air travel passenger flows (Mao et al., 2015). However, such data is limited to factual information, not accounting for the traveler experience which enables
understanding the customers’ perspective. Alternatively, scholars have designed surveys to obtain customer feedback (e.g., Yuan et al., 2008). Nevertheless, this is a method limited to a reduced number of responses in comparison to retrieving data from social media platforms. The present study addresses such limitation by modeling the
TripAdvisor hotel score, which can be considered a proxy for customer satisfaction (Moro et al., 2017).
Customer satisfaction based on social media data has been widely investigated in
tourism (Calheiros et al., 2017). Current literature acknowledges the influence of several dimensions to tourist satisfaction, including hotel stars, price, and the amenities (Moro et al., 2018b). Additionally, hotel location is regarded as an important construct to tourist satisfaction (Gao et al., 2018). Both scholars and practitioners agree that selecting a place for a new hotel unit is a difficult task (Yang et al., 2014). Thus, this study contributes to the existing body of knowledge by assessing how the location affects the influence of well-known dimensions from the guests’ perspective. The findings from the undertaken analysis can help hoteliers to invest more in some
dimensions in detriment of others, depending on the unit’s location. Yet, most of these dimensions have been analyzed separately. We propose to address such gap in the existing body of knowledge by bringing together a coherent set of relevant features to customer satisfaction, with a specific emphasis on the moderating effect of region through 50 data-driven models, one per each US state. Each model is then scrutinized to assess the most meaningful hotel features contributing to traveler satisfaction. This study aims to include previously identified features in the literature that influence hotel guest’s satisfaction (e.g., price and amenities), under a unique data-driven model that enables to highlight the regional symmetries and asymmetries of US states. Thus, the study is guided by two research questions: (RQ1) which hotel features influence most customer satisfaction? And (RQ2) is customer satisfaction moderated by the location (i.e., state) in the US?
2. LITERATURE REVIEW AND PROPOSED MODEL
2.1. The Importance of Regional Asymmetries on Accommodation
Regional asymmetries play a key role in the accommodation offer (Andraz et al., 2015). These can result from several factors, such as local competition and weather (Barros & Mascarenhas, 2005). The recent body of knowledge on the subject acknowledges regional asymmetries’ influence on price, amenities (Moro et al., 2018b), and hotel size (Tundis et al., 2017). Additionally, there is evidence that the star level of a location’s offer is also affected by competition (Radojevic et al., 2015).
The highly mature US tourism market, with most of the hotels present in TripAdvisor, and with a vast territory covering from desert to tundra and including tropical regions, was scrutinized. Cultural country-level constraints exist that support an analysis of the US market, even when compared to other English-speaking countries such as the UK (Voss et al., 2004). The vastness of the US also encompasses regional contexts that need to be isolated under a state level analysis (Alonso et al., 2013). The large volume of information justifies a data-driven approach, while the localized phenomenon associated with tourism across the US (Baker et al., 2013) advocates a cross-state analysis.
2.2. The moderating effect of location
A hotel’s location can have a key influence on its performance in many ways. Regional clusters enhance individual units’ productivity (Peiró-Signes et al., 2015), and
competition may lead to a convergent service relevance within the same region (Frochot & Gyimóthy, 2001). Thus, hotels that start offering a specific amenity that is aligned with tourists’ needs (e.g., refrigerator in rooms for warmer regions), have an advantage over the remaining ones, emphasizing the importance of that service to tourists’ choices (Stringam, 2008). Nonetheless, Abrate and Viglia (2016) found that although amenities
have an influence on customer satisfaction, the reputational dimension translated by the hotel stars holds a stronger impact in comparison. Additionally, since the destination image highly influences accommodation offer, the impact of travelers’ photos is considerably higher for less known destinations (Deng & Li, 2018). The importance of hotel location is perceived differently by guests depending on the hotel number of stars (Rhee & Yang, 2015). This suggests that location moderates how hotel stars influence customer satisfaction. Likewise, guests are willing to pay more per hotel rooms in more attractive locations. Sánchez-Pérez et al. (2019) confirmed the influence of the city where the hotel is located on prices in four European countries, and its subsequent impact on customer satisfaction. Therefore, location also has a moderating effect on guests’ perceived relevance of room price. Thus, we hypothesize that these (i.e., amenities, price, size, stars, number of photos) are features that are moderated by US regional asymmetries to influence tourists on their stays and that may be translated into a higher or lower granted quantitative score along with their written opinion.
2.3. The Importance of Consumer’s Satisfaction on Tourism
Tourism is an industry driven by the human nature of exploring and living different experiences (Chang, 2008). Thus, consumer satisfaction is of chief importance to attract visitors, who may choose to stay on a certain hotel based on its number of stars,
amenities, or on what they read and see online (Moro et al., 2018a). Additionally, recent literature has added more features to such body-of-knowledge, including gamification awards (Moro et al., 2019) and consumers’ published photos (Ma et al., 2018). Yet, literature is scarce in adopting a holistic view that encompasses all those features as inputs of a unique model able to understand which of those features contribute the most to guests’ perceptions and subsequent evaluation of units. Achieving such task requires non-linear complex techniques that enable to compute each feature’s contribution to the
defined target (Cortez & Embrechts, 2013). One of these techniques is based on support vector machines (SVM) and was used by Moro et al. (2017) to study guests’ feedback about Las Vegas hotels at the user granularity level. The present study takes a different approach by focusing instead on the hotel granularity level.
2.4. Conceptual Model
Sainaghi (2011) proposed a model for explaining revenue per available room (RevPAR) based on two dimensions: (1) “what”, including features such as size and stars; and (2) “where”, based on the location. His results show that both dimensions influence RevPAR. The present study is framed by those two dimensions to propose a novel model supported by known features from previous studies to understand how each of them influences customer satisfaction (Figure 1). Those features are unfolded into the ones available in TripAdvisor. Notably, individual amenities encompass many features. The proposed model guides the research questions raised in the previous section, particularly, the “what” question regarding RQ1, and the “where” question regarding RQ2.
3. METHODOLOGY
3.1. Web Scraping and Knowledge Extraction Procedure
An experimental approach was implemented using two of the most popular data analysis scripting languages, Python and R, to achieve a fully automated procedure. It consisted of extracting all the required data through a specifically developed web scraping script, and in modeling the TripAdvisor’s score for each registered hotel using a support vector machine (SVM). This enabled knowledge extraction from the model
using data-based sensitivity analysis (DSA) (Figure 2). DSA uses a randomly selected sample of the data to train the model and to assess its sensitivity by simultaneously varying the input features used for training the model through their range of possible values (Cortez & Embrechts, 2013), thus unveiling the most influential features in building each hotel’s reputation in TripAdvisor. Although recent, both web scraping and DSA for knowledge extraction are not a novelty in tourism (see Johnson et al., 2012, for the former, and Moro et al., 2018b, for the latter). However, the combined use of both for a fully automated analysis of customer satisfaction of a large country across its regions has no precedent in previous literature. The major advantage of the proposed approach based on both methods is scalability. First, the model can be trained with any amount of collected reviews. Second, the model can be fed with any number of input features. The only limitation to the abovementioned advantages is computational capability. Third, DSA is independent of the modeling technique, thus it can be applied to any type of model, including other advanced machine learning techniques such as neural networks (Barraza et al., 2019).
3.2. Data Collection
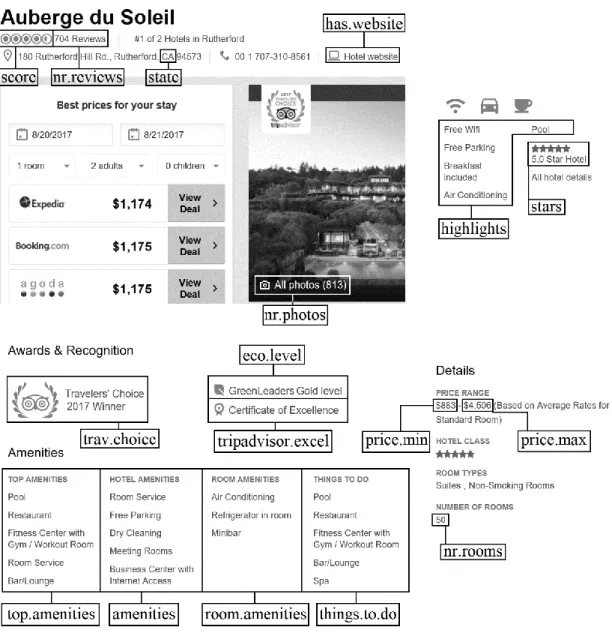
The information concerning a total of 37,059 registered hotels was collected on July 27-30, 2017, from which 17 features that characterize each hotel were derived. Figure 3 depicts the information gathered per hotel (the names of the features displayed are used henceforth). From the initial dataset, 6,475 hotels were found to have missing values in features such as price and the number of rooms, denoting lack of investment in
TripAdvisor. Hence, those hotels were removed, leaving a total of 30,584 for all the 50 US states. A few distinct features concealed similar hotel amenities (i.e., Figure 3: highlights; top.amenities; amenities; room.amenities; things.to.do). Thus, the individual amenities were computed based on those features, with each extracted amenity
constituting a new added feature. As a result, the final tuned dataset consisted of 30,584 hotels, each one characterized by 46 features, hence a volume of information requiring an automated analysis procedure such as the one proposed.
3.3. Data Analysis
The score on TripAdvisor to model was a numerical discrete value between 1 and 5 with an interval of 0.5 (overall statistics and per state are shown in Table 1). Therefore, the SVM became a support vector regressor.
A 10-fold cross-validation scheme was followed to achieve a robust model validation, similarly to experiments conducted by Moro et al. (2017). Such scheme consists in training the SVM with 9/10 of the hotels and then testing the built model with the remaining 1/10, iteratively shifting the fold used for testing, thus ensuring all data was used for both training and testing (Refaeilzadeh et al., 2009). To assess SVM’s
accuracy, two metrics were computed: the mean absolute error (MAE), which measures the deviation of the modeled score to the real one; and the mean absolute percentage error (MAPE), which is the ratio between MAE and the real score (Hyndman & Koehler, 2006), one of the most popular measures for forecasting error.
4. RESULTS AND DISCUSSION
4.1. Accommodation Offer per State
Figure 4 highlights the divergences in hotel offer across the states. In a mature hotel market as the US, the offer is adjusted to the regional market size. As such, the larger and more populous is the state, the higher is the number of hotel units and rooms available. In that sense, the largest states like California and Texas tend to offer larger
units (i.e., with more rooms per unit). The state of Nevada is a notable exception: its capital, Las Vegas, the notorious city of gambling and entertainment is driven by tourism (Moro et al., 2017) and offers the largest hotels in the US - the 18 largest hotels from the collected set, with more than 3 thousand rooms per unit, are all located in Las Vegas. When comparing the average number of stars per state with the average
TripAdvisor score (Figure 5), it is possible to observe that customer satisfaction registered in TripAdvisor is clearly above the number of stars, although both encompassing a 1 to 5 scale. In addition, there is not a full convergence on both
averages. Some states with a score above 4 have an average number of stars around 2.5 (e.g., Maine), while others have a number of stars clearly above 3 (e.g., Hawaii). This result is consistent with current literature since traditional rating systems are associated with the offered conditions and amenities, not reflecting the overall quality of the service (Stringam et al., 2010). The performance results for the 50 models were
considered valid for knowledge extraction: MAPE ranged from 4.8% (Florida) to 14.7% (Rhode Island). Such results are consistent with current machine learning literature: a larger dataset (as it is the case for Florida, the state with more hotels) is likely to achieve a more robust model when compared to smaller datasets (e.g., Chen et al., 2012).
Nevertheless, all the models achieved a good modeling performance when compared to similar studies (e.g., Moro et al., 2017, achieved a MAPE of 27%), validating them for knowledge extraction.
4.2. Customer Satisfaction Model
We have also modeled the TripAdvisor score for each one of the states using the previous feature set, composed of 46 features. The relative importance (i.e.,
contribution) of each one of the features to the score was obtained for each state, again using DSA. Figure 6 shows the resulting heat matrix, where each column represents a
state, identified by its abbreviation (see Figure 5). Thus, the sum of the rows for each state is 100%. Marked cells correspond to the top 30% values, while the darkest cells correspond to the top 10% values (14.2% is the highest value within the matrix). The features were collected through the process mentioned in Section 2. There is an apparent convergence of the high relevance of the top seven features highlighted in Figure 6. Nonetheless, there are some lighter spots across the darker frame observed in those seven rows. Notably, the number of photos hotels show on TripAdvisor is clearly less relevant in the most mature destinations, namely California, Florida, and New York (Tasci et al., 2018). One hypothesis for such finding derives from the strong brand image associated with these states, where there is no need to show the magnificent landscapes (Pan, 2010).
While looking at the features corresponding to amenities and observing the darker and whiter spots within the heat matrix, other findings emerge. Free parking tends to be more relevant in highly populated states (e.g., Florida, New Jersey) when compared to sparsely populated ones such as Delaware and Montana. Since most rooms in New York hotels are small, those that still have room for a refrigerator are appreciated by families1, which is supported by Figure 6 when comparing NY to other states such as LA and NC. Being a non-smoking hotel is highly relevant in Nevada, likely due to the dichotomy between stressed gambling tourists unloading the pressure to win on cigars and the families in leisure trips annoyed with the load of smoke within hotels that allow smoking (York & Lee, 2010).
Another interesting result emerging from Figure 6 is the power of TripAdvisor as an influential tourism platform: the TripAdvisor Excellence award (“tripadvisor.excel”) emerges as a relevant feature for all states. According to TripAdvisor, the Excellence
award2 is computed based on customers’ reviews. However, the specific criteria used are not disclosed. Not even the algorithm for computing hotel’s score is disclosed, strengthening TripAdvisor’s influence over hotels (see a forum thread on the subject, answered by an identified TripAdvisor staff3). Furthermore, there is not a direct relationship between the score and the abovementioned award, as there are several hotels scoring 5 without the Excellence award, while some hotels with lower scores such as 3.5 still hold that award.
The moderating effect of location is observed by comparing the features shades in each column in Figure 6. Such effect is noticeable for some features. For example, in NY state, the great relevance of the features family rooms, breakfast included, and
refrigerator in room, is evidence of a tourist segment visiting NY. Such result is aligned
with the study by Ahn et al. (2017), who found that food is a great concern for families staying in NY hotels. A closer look at Figure 6 enables to uncover a type of amenity that seems to have always some influence on customer satisfaction: food-related amenities. In fact, refrigerator in room, microwave, and kitchenette are amenities that appear with relevance for many US states, thus appealing for basic food preparation and storing needs. Still related to food, breakfast is the most important meal in hotels, since people usually need a good meal for fresh-starting the day. Thus, in several states, breakfast available or included is valued, although there is little overlap (i.e., states where both appear in darker shades in Figure 6), showing evidence of the moderating effect of regions. Also, smoking patterns appear moderated by each state, considering there are nine states for which being a non-smoking hotel has relevance, while six give
2
http://www.tripadvisor.com/TripAdvisorInsights/n2290/frequently-asked-questions-about-certificate-excellence
3
importance to non-smoking rooms, with only one state overlapping the importance of both features.
Recent studies in tourism concur on TripAdvisor’s influence on tourism electronic word-of-mouth. As a result, empirical research is often conducted using TripAdvisor’s data (e.g., Nicely & Ghazali, 2014; Calheiros et al., 2017). Recent research also shows that hotel managers are generally aware of the power of TripAdvisor (Ayeh et al., 2013). Yet, other online platforms are becoming increasingly important, and currently many sales-based platforms provide customer feedback tools, such as Booking.com (Moro et al., 2018b). Thus, online platforms are contributing to an information overload, to add to existing survey-based governmental databases and scholarly collected primary data. Such information richness is often explored by researchers to study a small list of specific feature’s influence over a phenomenon. However, non-linear complex techniques such as SVMs can be fed with a large number of features. Furthermore, data can be combined to have an enriched dataset including several distinct sources and platforms (Moro et al., 2018b). National tourist offices can benefit from similar approaches to mine insightful knowledge that can enrich current
governmental databases (Moro et al., 2018a). Nevertheless, both regional, national tourist offices and destination marketing organizations are still not fully exploring social media to understand what drives customer satisfaction (Tussyadiah et al., 2011).
The proposed model can be validated through the heat matrix presented in Figure 6. In general, the amenities are highly influenced by the location. This is an expected result, considering the appreciation of many amenities is dependent on context factors such as the weather (e.g., air conditioning). Yet, overall, amenities are less relevant than the remaining four features (price, stars, size, number of published photos). Conversely, price, stars, and hotel size are less subjected to location influence, but have a high
impact on customer satisfaction. This has direct managerial implications for global chains operating different segment-brands across the US, suggesting a globalization effect on the US. The “number of photos” feature also highly influences customer satisfaction, but on a different scale. Specifically, the TripAdvisor Excellence award appears to have a homogeneous effect, while having an own website or even having published photos is moderated by the location. Thus, the two research questions can be answered as follows: (RQ1) customer satisfaction is highly influenced by the hotel number of photos, size, stars, and price, and also by the offered amenities, although at a smaller scale; and (RQ2) the amenities and the hotel number of photos are moderated by the location (i.e., state) when explaining customer satisfaction, although price, size, and stars are not.
5. CONCLUSIONS
This study highlights the convergent and divergent factors contributing to TripAdvisor score in each of the 50 US states. Features such as the number of rooms, price, and the number of stars contribute highly to hotels’ score in all states, although at different levels. Likewise, the amenities’ observed relevance showed that each state has adapted its respective offer to meet regional demand. For example, in the hot dry weather of Arizona, it is crucial that hoteliers keep their air conditioning units in proper operation. Our study also unveiled that guests visiting Nevada are highly sensitive to the non-smoking issue, but on a unit level. Thus, it is not enough that units offer non-non-smoking rooms, since guests are demanding non-smoking lobbies and common spaces.
Additionally, the results revealed that a huge and mature tourism market such as the US where the large majority of the population has access to the Internet and uses social
media is highly influenced by TripAdvisor’s awards. The validated model provides evidence of the influence of five major hotel features on customer satisfaction: hotel price, stars, size, number of photos, and amenities. The two latter were found to be highly moderated by the location, while the former three were not. Some major
contributions emerge, related to the moderating effect of regions on amenities. First, the same segments of visitors in a region can leverage the relevance of some amenities valued by these visitors (e.g., families appreciate more refrigerator in room when visiting NY in comparison to other states). Second, at least one food-related amenity is accountable for some relevance in customer satisfaction, although which amenity depends on the state. Hoteliers should pay special attention to food and analyze
competition to understand if competitors are offering the amenity that is most valued by their region’s visitors.
However, there are some limitations that should be noted. The analysis is limited to TripAdvisor as the single source and, although it provides a large amount of
information, a richer dataset might be compiled by aggregating other sources such as governmental databases, and survey responses, as well as other online platforms. Also, the results are restricted to the large US market. Finally, the hotel-granularity level analysis prevents an evaluation of individual features influencing guests, such as the cultural origins. Thus, it would be interesting in future research to extend the proposed approach to other distinct markets to assess if those awards also play such a significant role as observed for the US. Furthermore, it would be also of interest to build in the future a model that could mimic hotel scores based on individual user reviews, helping to add transparency to this widely used platform. Such research could be developed using the same tools presented in this study. The information and sources’ overload also suggest enriching data collected from TripAdvisor with external governmental
databases and/or primary collected data from surveys. Given the SVM is able to include a large number of input features, a model could be trained to validate if the US national tourist office’s perception is aligned with customer satisfaction.
REFERENCES
Abrate, G., & Viglia, G. (2016). Strategic and tactical price decisions in hotel revenue management. Tourism Management, 55, 123-132.
Alonso, A. D., O'Neill, M., Liu, Y., & O'Shea, M. (2013). Factors driving consumer restaurant choice: An exploratory study from the Southeastern United States. Journal of
Hospitality Marketing & Management, 22(5), 547-567.
Aluri, A., Price, B. S., & McIntyre, N. H. (2018). Using Machine Learning to Cocreate Value through Dynamic Customer Engagement in a Brand Loyalty Program. Journal of
Hospitality & Tourism Research, DOI: 10.1177/1096348017753521.
Andraz, J. M., Norte, N. M., & Gonçalves, H. S. (2015). Effects of tourism on regional asymmetries: Empirical evidence for Portugal. Tourism Management, 50, 257-267.
Ahn, D., Park, H., & Yoo, B. (2017). Which group do you want to travel with? A study of rating differences among groups in online travel reviews. Electronic Commerce
Research and Applications, 25, 105-114.
Ayeh, J. K., Au, N., & Law, R. (2013). “Do we believe in TripAdvisor?” Examining credibility perceptions and online travelers’ attitude toward using user-generated content. Journal of Travel Research, 52(4), 437-452.
Baker, M., Murrmann, S. K., & Green, C. (2013). Dining in the city: server behaviors, time preferences, and the effect of urbanization in restaurants. Journal of Foodservice
Business Research, 16(2), 113-138.
Barraza, N., Moro, S., Ferreyra, M., & de la Peña, A. (2019). Mutual information and sensitivity analysis for feature selection in customer targeting: A comparative study.
Journal of Information Science, 45(1), 53-67.
Barros, C. P., & Mascarenhas, M. J. (2005). Technical and allocative efficiency in a chain of small hotels. International Journal of Hospitality Management, 24(3), 415-436.
Calheiros, A. C., Moro, S., & Rita, P. (2017). Sentiment classification of consumer-generated online reviews using topic modeling. Journal of Hospitality Marketing &
Management, 26(7), 675-69.
Chang, J. C. (2008). Tourists' satisfaction judgments: An investigation of emotion, equity, and attribution. Journal of Hospitality & Tourism Research, 32(1), 108-134.
Chen, H., Chiang, R. H., & Storey, V. C. (2012). Business intelligence and analytics: from big data to big impact. MIS Quarterly, 1165-1188.
Cortez, P., & Embrechts, M. J. (2013). Using sensitivity analysis and visualization techniques to open black box data mining models. Information Sciences, 225, 1-17. Deng, N., & Li, X. R. (2018). Feeling a destination through the “right” photos: A machine learning model for DMOs’ photo selection. Tourism Management, 65, 267-278.
Frochot, I., & Gyimóthy, S. (2001). Converging services marketing and tourism
approaches in satisfaction and service quality research. Journal of Quality Assurance in
Hospitality & Tourism, 2(1-2), 29-48.
Gao, B., Li, X., Liu, S., & Fang, D. (2018). How power distance affects online hotel ratings: the positive moderating roles of hotel chain and reviewers’ travel experience.
Tourism Management, 65, 176-186.
Hyndman, R. J., & Koehler, A. B. (2006). Another look at measures of forecast accuracy. International Journal of Forecasting, 22(4), 679–688.
Johnson, P. A., Sieber, R. E., Magnien, N., & Ariwi, J. (2012). Automated web harvesting to collect and analyse user-generated content for tourism. Current Issues in
Tourism, 15(3), 293-299.
Kaplan, A. M., & Haenlein, M. (2010). Users of the world, unite! The challenges and opportunities of Social Media. Business Horizons, 53(1), 59-68.
Ma, Y., Xiang, Z., Du, Q., & Fan, W. (2018). Effects of user-provided photos on hotel review helpfulness: An analytical approach with deep leaning. International Journal of
Hospitality Management, 71, 120-131.
Mao, L., Wu, X., Huang, Z., & Tatem, A. J. (2015). Modeling monthly flows of global air travel passengers: An open-access data resource. Journal of Transport Geography, 48, 52-60.
Marine-Roig, E., & Clavé, S. A. (2015). Tourism analytics with massive user-generated content: A case study of Barcelona. Journal of Destination Marketing & Management, 4(3), 162-172.
Moro, S., Rita, P., & Coelho, J. (2017). Stripping customers' feedback on hotels through data mining: the case of Las Vegas Strip. Tourism Management Perspectives, 23, 41-52.
Moro, S., & Rita, P. (2018). Brand strategies in social media in hospitality and tourism.
International Journal of Contemporary Hospitality Management, 30(1), 343-364.
Moro, S., Batista, F., Rita, P., Oliveira, C., & Ribeiro, R. (2018a). Leveraging national tourist offices through data analytics. International Journal of Culture, Tourism, and
Hospitality Research, 12(4), 420-426.
Moro, S., Ramos, P., Esmerado, J., & Jalali, S. M. J. (2019). Can we trace back hotel online reviews’ characteristics using gamification features? International Journal of
Information Management, 44, 88-95.
Moro, S., Rita, P., & Oliveira, C. (2018b). Factors influencing hotels’ online prices.
Journal of Hospitality Marketing & Management, 27(4), 443-464.
Nicely, A., & Ghazali, R. M. (2014). Demystifying visitor harassment. Annals of
Tourism Research, 48, 266-269.
Pan, S. (2010). Media strategies for marketing places in crisis. Improving the images of cities, countries, and tourist destinations. Current Issues in Tourism, 13(2), 195-198.
Peiró-Signes, A., Segarra-Oña, M. D. V., Miret-Pastor, L., & Verma, R. (2015). The effect of tourism clusters on US hotel performance. Cornell Hospitality Quarterly, 56(2), 155-167.
Radojevic, T., Stanisic, N., & Stanic, N. (2015). Ensuring positive feedback: Factors that influence customer satisfaction in the contemporary hospitality industry. Tourism
Refaeilzadeh, P., Tang, L., & Liu, H. (2009). Cross-validation. In L. Liu, & M. T. Özsu (Eds.), Encyclopedia of database systems (pp. 532–538). USA: Springer.
Rhee, H. T., & Yang, S. B. (2015). Does hotel attribute importance differ by hotel? Focusing on hotel star-classifications and customers’ overall ratings. Computers in
Human Behavior, 50, 576-587.
Sainaghi, R. (2011). RevPAR determinants of individual hotels: evidences from Milan.
International Journal of Contemporary Hospitality Management, 23(3), 297-311.
Sánchez-Pérez, M., Illescas-Manzano, M. D., & Martínez-Puertas, S. (2019). Modeling hotel room pricing: A multi-country analysis. International Journal of Hospitality
Management, 79, 89-99.
Stringam, B. B. (2008). A comparison of vacation ownership amenities with hotel and resort hotel amenities. Journal of Retail & Leisure Property, 7(3), 186-203.
Stringam, B. B., Gerdes Jr, J., & Vanleeuwen, D. M. (2010). Assessing the importance and relationships of ratings on user-generated traveler reviews. Journal of Quality
Assurance in Hospitality & Tourism, 11(2), 73-92.
Tasci, A. D., Khalilzadeh, J., Pizam, A., & Wang, Y. (2018). Network analysis of the sensory capital of a destination brand. Journal of Destination Marketing &
Management, 9, 112-125.
Tundis, E., Gabriele, R., & Zaninotto, E. (2017). Investigating the effectiveness of public subsidies to hotels: Evidence from an Alpine region. Tourism Management
Tussyadiah, I. P., Park, S., & Fesenmaier, D. R. (2011). Assessing the effectiveness of consumer narratives for destination marketing. Journal of Hospitality & Tourism
Research, 35(1), 64-78.
Voss, C. A., Roth, A. V., Rosenzweig, E. D., Blackmon, K., & Chase, R. B. (2004). A tale of two countries’ conservatism, service quality, and feedback on customer
satisfaction. Journal of Service Research, 6(3), 212-230.
Voulgaris, C. T., Taylor, B. D., Blumenberg, E., Brown, A., & Ralph, K. (2017). Synergistic neighborhood relationships with travel behavior: An analysis of travel in 30,000 US neighborhoods. Journal of Transport and Land Use, 10(1), 437-461.
Xiang, Z., Schwartz, Z., Gerdes Jr, J. H., & Uysal, M. (2015). What can big data and text analytics tell us about hotel guest experience and satisfaction? International
Journal of Hospitality Management, 44, 120-130.
Xu, X. (2018). Examining the Relevance of Online Customer Textual Reviews on Hotels’ Product and Service Attributes. Journal of Hospitality & Tourism Research, DOI:10.1177/1096348018764573.
Yang, Y., Luo, H., & Law, R. (2014). Theoretical, empirical, and operational models in hotel location research. International Journal of Hospitality Management, 36, 209-220.
Ye, Q., Li, H., Wang, Z., & Law, R. (2014). The influence of hotel price on perceived service quality and value in e-tourism: An empirical investigation based on online traveler reviews. Journal of Hospitality & Tourism Research, 38(1), 23-39.
York, N. L., & Lee, K. (2010). A baseline evaluation of casino air quality after enactment of Nevada's Clean Indoor Air Act. Public Health Nursing, 27(2), 158-163.
Yuan, Y. H. E., & Wu, C. K. (2008). Relationships among experiential marketing, experiential value, and customer satisfaction. Journal of Hospitality & Tourism
Research, 32(3), 387-410.
Zuiderwijk, A., & Janssen, M. (2014). Open data policies, their implementation and impact: A framework for comparison. Government Information Quarterly, 31(1), 17-29.
Table 1 - Statistics on TripAdvisor’s score for the 30,584 hotels.
State Nr. hotels Nr. Rooms (k) Mean SD
Alabama 728 63 3.63 0.84 Alaska 162 15 3.70 0.67 Arizona 824 97 3.91 0.56 Arkansas 535 40 3.71 0.75 California 1045 166 4.27 0.34 Colorado 810 82 4.11 0.44 Connecticut 309 36 3.64 0.72 Delaware 121 11 3.72 0.76 Florida 1082 209 4.31 0.33 Georgia 973 109 4.04 0.42 Hawaii 186 53 4.08 0.49 Idaho 238 20 3.90 0.70 Illinois 925 131 4.02 0.43 Indiana 778 74 3.64 0.76 Iowa 592 45 3.76 0.70 Kansas 491 39 3.73 0.69 Kentucky 608 55 3.72 0.72 Louisiana 741 86 3.68 0.79 Maine 357 24 4.02 0.62 Maryland 587 73 3.69 0.67 Massachusetts 650 74 3.80 0.70 Michigan 790 81 4.00 0.45 Minnesota 697 69 3.85 0.69 Mississippi 517 49 3.54 0.81 Missouri 858 90 3.80 0.67 Montana 352 25 3.89 0.64 Nebraska 335 28 3.79 0.73 Nevada 410 195 3.68 0.66 New Hampshire 254 19 3.92 0.62 New Jersey 774 90 3.62 0.70 New Mexico 520 43 3.71 0.69 New York 967 147 4.21 0.39 North Carolina 917 98 4.15 0.40 North Dakota 245 21 3.96 0.64 Ohio 935 99 4.04 0.45 Oklahoma 634 56 3.68 0.78 Oregon 752 59 3.77 0.69 Pennsylvania 943 107 4.09 0.46 Rhode Island 106 10 3.72 0.76 South Carolina 859 97 3.66 0.75 South Dakota 299 21 3.84 0.62 Tennessee 877 92 3.94 0.51 Texas 1045 155 4.28 0.36 Utah 510 46 3.82 0.69 Vermont 161 12 3.84 0.64 Virginia 959 118 4.03 0.45 Washington 817 84 3.82 0.65
West Virginia 248 24 3.76 0.76
Wisconsin 753 66 3.96 0.52
Wyoming 308 23 3.76 0.74
Web scraping Modeling (support vector machine) Knowledge extraction (data-based sensitivity analysis)
Figure 5 - TripAdvisor score by hotel stars and US state. 1.5 2 2.5 3 3.5 4 4.5 5 A la b am a (A L ) A la sk a (A K ) A ri zo n a (A Z ) A rk an sa s (A R ) C al if o rn ia ( C A ) C o lo ra d o ( C O ) C o n n ec ti cu t (C T ) D el aw ar e (D E ) F lo ri d a (F L ) G eo rg ia ( G A ) H aw ai i (H I) Id ah o ( ID ) Il li n o is ( IL ) In d ia n a (I N ) Io w a (I A ) K an sa s (K S ) K en tu ck y ( K Y ) L o u is ia n a (L A ) M ai n e (M E ) M ar y la n d ( M D ) M as sa ch u se tt s (M A ) M ic h ig an ( M I) M in n es o ta ( M N ) M is si ss ip p i (M S ) M is so u ri ( M O ) M o n ta n a (M T ) N eb ra sk a (N E ) N ev a d a (N V ) N ew H am p sh ir e (N H ) N ew J er se y ( N J) N ew M ex ic o ( N M ) N ew Y o rk ( N Y ) N o rt h C ar o li n a (N C ) N o rt h D ak o ta ( N D ) O h io ( O H ) O k la h o m a ( O K ) O re g o n ( O R ) P en n sy lv an ia ( P A ) R h o d e Is la n d ( R I) S o u th C ar o li n a (S C ) S o u th D ak o ta ( S D ) T en n es se e (T N ) T ex as ( T X ) U ta h ( U T ) V er m o n t (V T ) V ir g in ia ( V A ) W as h in g to n ( W A ) W es t V ir g in ia ( W V ) W is co n si n ( W I) W y o m in g ( W Y )
Figure 6 - Heat matrix. State Feature A L A K A Z A R C A C O C T D E F L G A H I I D I L I N I A K S K Y L A M E M D M A M I M N M S M O M T N E N V N H N J N M N Y N C N D O H O K O R P A R I S C S D T N T X U T V T V A W A W V W I W Y nr.rooms price.min nr.reviews stars nr.photos price.max tripadvisor.excel has.website air.conditioning Suites eco.level laundry.service housekeeping pool refrig.in.room microwave dry.cleaning free.parking non.smoking.hotel children.activities non.smoking.rooms free.wifi high.speed.net breakfast.avail room.service kitchenette trav.choice breakfast.included family.rooms pets.allowed concierge wheelchair.access shuttle.bus airport.transp conference.facilities hot.tub restaurant fitness.center gym multilingual.staff meeting.rooms bar.lounge self.serv.laundry business.center.net business.center banquet.room