COMPUTATIONAL TOOL FOR THE ANALYSIS AND SIMULATION OF
COLD ROOM PERFORMANCE IN PERISHABLE PRODUCTS INDUSTRY
R. SANTOS
(a), J. NUNES
(b), P.D. SILVA
(c), P.D. GASPAR
(d), L.P. ANDRADE
(e)(a)(c) (d)
University of Beira Interior - Engineering Faculty, Electromechanical Engineering Department, Covilhã, 6201-001, Portugal
(a)
r_santos14@hotmail.com, (c)dinho@ubi.pt; (d)dinis@ubi.pt
(b)(e)
Polytechnic Institute of Castelo Branco; Av. Pedro Álvares Cabral nº 12, Castelo Branco, 6000, Portugal
(b)
jnunes@ipcb.pt; (e)luispa@ipcb.pt
ABSTRACT
Perishable products such as meat, fruit and dairy products are some of the major food products preferred by consumers due to their nutritional and organoleptic characteristics. The conservation of their properties through time is usually ensured by storing them in rooms with controlled air temperature and humidity. The refrigeration systems that accomplish these environmental conditions are the main responsible by the electrical energy consumption in food sector industries. With the aim to promote an improvement of its energy performance, a computational tool for the analysis and simulation of cold rooms performance was developed. It allows the analysis of the behaviour of relevant parameters, such as: raw material quantity, cold rooms volume, refrigeration systems power, among others. The preliminary results of the practical application of this tool show its usefulness on the decision making for energy efficiency measures to reduce the specific energy consumption in perishable products industry.
1. INTRODUCTION
The sustainability and food security are a major concern of consumers in recent years. There has been an increasing demand for foods as well as a change in consumption habits. To deal with this new trend, there is a greater availability and variety of food with longer shelf life. In this context, the food cooling plays an important role, not only for its ability to preserve the products with the maintenance of its physical, chemical, nutritional and organoleptic characteristics, but also because it is an indispensable tool for processing of perishable foods, with particular emphasis on meat products. Meat is one of the main food products in consumer preference due to its excellent organoleptic and nutritional characteristics. As one of the most important food products, it is estimated that in 2050 the world production reaches 470 million tons, a number that doubles the 229 million tons in 1999 (FAO, 2009).
In Portugal, the industry group of meat products had in 2009, like the previous year, the highest turnover rate within the food sector, reaching about 21.3% of M€ 8267 reached by this sector (INE, 2010). In general, the manufacturing process of meat products is carried out in artificial environments with strict control of air temperature, humidity and velocity, resulting in the use of systems which generate cold and heat, although the cooling systems is the main responsible by the energy consumption. In terms of energy, food industries are typified as non-energy intensive, but given the high number of these industries, the total energy consumption as a significant relative weight in the industry sector (Muller et al., 2007; Ramírez et al., 2006). Despite the reduction of energy consumption in the food sector in some countries, in Portugal there has been an increase due to growth and expansion of the sector. From 1995 to 2007, this group had a 7.3% increase of the total energy consumption, reaching a value of 24,584 TJ in 2007, while the increase in electricity consumption during the same period was 39%, registering on 2007 a value of 6573 TJ (INE, 2009).
Due to the growing political, economic and social concerns about energy consumption, in particular with the need to reduce greenhouse gas emissions and fossil fuel consumption, and given the sharp rise of energy costs in recent years, sustainability and competitiveness these industries depends, to some extent, on the ability to use energy rationally and efficiently. There are several studies on the energy consumption and energy efficiency measures for the meat processing industry, specifically in industrial slaughterhouses (Herbert et al., 1984; Gigiel and Collett, 1989; Gigiel and Hoder, 1992; Fritzson and Berntsson, 2006a; Fritzson and Berntsson, 2006b; AlQdah, 2010).
In Portugal, there were no studies on how these meat industries use energy, nor on the potential energy savings achievable without compromising productivity and product quality. Only Alpalhão (1997) describes the results of energy audits on such industries. Recently, Nunes et al. (2011) developed a study with the objective of analyzing the profile of the electricity consumption in the meat products industries, to determine specific energy consumption indicators of these industries, and to study the potential energy savings by identifying a set of appropriate measures to improve their energy efficiency. Analytical correlations were developed to represent the average behaviour, in an energetic perspective, of slaughterhouses existing in Portugal. This paper uses the correlations developed for slaughterhouses developed by the Nunes et al. (2011), includes the recently developed correlations for ham and sausages and considers the further improvement of the computational tool developed by Santos et al. (2012). This computational tool that allows positioning the energy behaviour of a particular company in relation to the national average. Thus, the aim of this tool is to assist the decision making in order to improve the meat industry performance. The computational tool was developed in Matlab software using the GUIDE (Graphical User Interface Design Environment). The front end of the computational tool allows navigating on several menu windows and windows that graphically illustrate the correlations results, enabling any user to access the current state of a company in terms of energy consumption and verify the suggestive comments to its reduction.
2. PERFORMANCE PARAMETERS OF AGRO-INDUSTRIAL COMPANIES
In Portugal, the annual energy consumption of an agro-industrial company dedicated to the production and conservation of raw food products focuses on electricity consumption. Therefore, the dimensions of cold rooms and therefore the required cooling power are important parameters to take into account. The following parameters were selected to represent the energy consumption associated with the production and conservation of foods: (1) Raw food products quantity; (2) Electricity consumption; (3) Cold room volume; and (4) Compressors' nominal electrical power. Note that the parameter (2) Electricity consumption considers all refrigeration equipments and related devices as well as the equipments involved in all stages of production process. Additionally, illumination and other electricity sinks are included in the evaluation of this parameter.
In order to implement energy efficiency measures, a study on several meat industries was carried out, specifically in slaughterhouses (red meat), ham and sausage processing industries, covering the entire inland Portugal. The data collected characterize each of these companies in relation to the production and conservation of food products. The study consisted of several steps to acquire the specific data of these industries: general characterization; raw materials quantity, production volume, energy consumption (electricity, etc.); energy costs; characteristics of cooling and freezing rooms; characteristics of refrigeration systems; environmental requirements and specificities of the production process. The data was collected during the year 2008. The procedure for data collection included visits to the industries, having been part of the analysis, the building, the equipment, the technical operations and the manufacturing processes. The data collected allow parameterization of the performance and energy efficiency of the entire set of slaughterhouses, ham and sausages companies in the Beira Interior region of Portugal. From these data were developed correlations that contribute to a better understanding of the performance of these industries (Nunes et al., 2011). These correlation were obtained in real operation enterprises and so they are complied to follow food safety standards (food products temperature, hygiene procedures, among others).
Only the results of the analysis to slaughterhouses (red meat) producing over 1000 tons were included in that correlation. The upper limit of production was set at 5000 tons since there is no record of a slaughterhouse with such output value. Moreover, based on the results of the analysis to the slaughterhouses set, it is defined that a slaughterhouse which produces 3000 tons annually will consume 475 MWh in that time period, so it must possess refrigeration compressors with approximately 105 kW to ensure proper cold conservation conditions for that amount of raw material and the cold rooms shall have a minimum volume of 1300 m3. It is important to highlight that the current slaughterhouse correlations are only for red meat processing. The poultry slaughterhouses have a different production process (slaughter, operation and refrigeration/freezing). The correlations for sausages and ham industries were included in the tool. Again, the values were limited by maximum and minimum values obtained from the experimental survey. These application limits of the correlation affect the predictions and the graphical analysis. Thus, Table 1 summarizes the limits for each type of industry and provides information to users about the range of values where the tool is accurate. If users set parameters within this range of values, they will obtain more reliable predictions and consequently the energy efficiency suggestions will be more precise.
Table 1:
Summary of the limits for each type of meat industry.Industry Raw material [ton.] Cold room volume [m3] Compressors electrical power [kW] Slaughterhouse 1000 - 5000 500-3000 25-300
Sausages 0-1100 10-1000 0-100 Ham 50-2500 1500-11000 80-350
3. INTERACTIVE COMPUTATIONAL TOOL
The current state of computational tool allows the user to enter annual values of the energy consumption, raw material/food product produced or processed as well as the cold room total volume and compressors nominal power, in order to analyze the actual state of the company, through six graphical options, so the user can make decisions to improve the energy performance of its company. This annual data will be analyzed to check the present state of the meat industries, such as, slaughterhouses (red meat), industries of sausages and ham. The general design of the computational tool is based in a chain structure, allowing users to select the type of industry most appropriate to their interests, although to the date this is restricted to meat products industries. The program starts showing the window shown in Figure 1, which presents the name of the tool, its objectives and includes information that remind users to the company parameters that can be analyzed. The availability of the previously mentioned parameters is important to obtain an useful graphical analysis.
Figure 1. Initial window of the simulation tool.
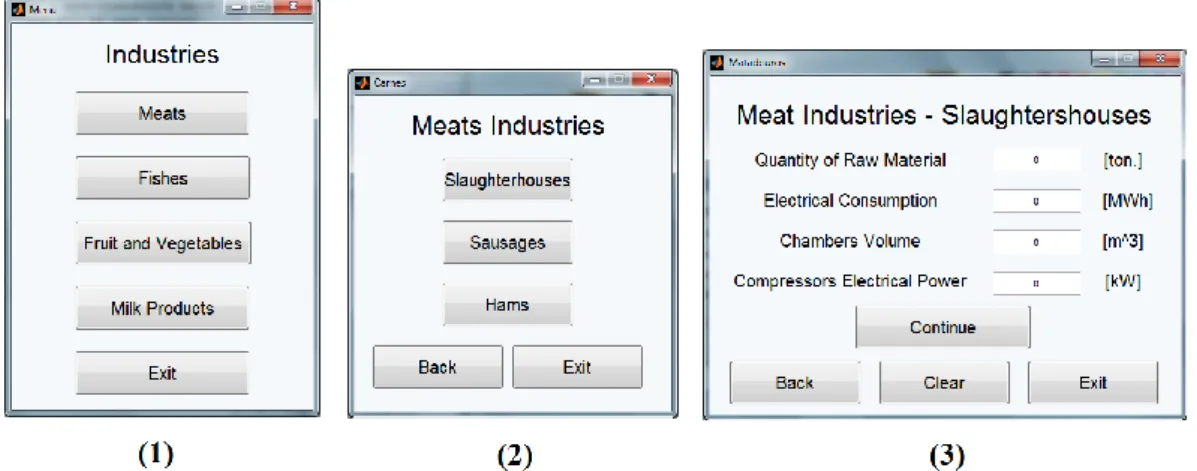
The user can choose the type of industry to analyze when presses "Continue" button (see Figure 1). For this particular case study, when the user presses the "Meat" button in the "Industries" window (see Figure 2-1), accesses another selection window with specific industries (see Figure 2-2). Pressing the "Slaughterhouse" button, the "Meat Industry" window closes and opens another window that allows the introduction of the most important parameters for the energy assessment of the slaughterhouse (see Figure 2-3). It can be verified, by Figures 3 and 4, that all windows arranged in chain, contain the buttons "Exit" and "Back" useful for navigation on the simulation program if the user wants to analyse another type of industry.
Figure 2. 1) Menu window for industry type selection; 2) Menu window for meat industry type selection; 3) Input parameters window for Slaughterhouses.
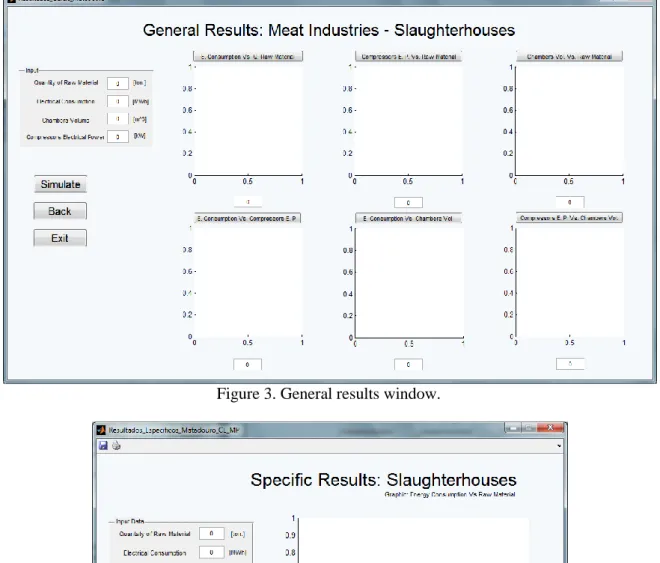
After entering the appropriate parameters in the "Slaughterhouses" window, respecting the units system, and pressing the button "Start Simulation", the user will access the general results that summarize the current energy state of the company. Thereafter, to access a general report, the user must press the button "Simulate" on the "Overall Results - Slaughterhouse" window (see Figure 3) in order to start the graphs generation. If, by chance, the user's interest is to analyse randomly a graph, he must press the button located on the graph to see it magnified. To display this same graph on a later time, the user must press again the button "Simulate" and the graph construction will start (see Figure 4).
Figure 3. General results window.
Figure 4. Specific results window (magnified graph).
4. CASE STUDY: SLAUGHTERHOUSE ENERGY ACCESSMENT
In order to provide a general demonstration of how the simulation program works and what conclusions can be drawn with the analysis of main graphs, it is shown the case studies for the energy assessment of a slaughterhouse (red meat), a sausage industry and a ham industry, whose parameters are shown in Table 2. The analysis is performed by comparison with the correlations trend obtained from the experimental studies developed in real operating enterprises.
Table 2. Test parameters: slaughterhouse, sausages industry and ham industry.
Parameter Unit Slaughterhouse Sausages industry Ham industry Raw material/food product produced ton 4610 400 1000 Electricity consumption MWh 1200 125 1500 Cold room total volume m3 2300 1600 6000 Compressors electrical power kW 220 45 225
4.1. Case study: Slaughterhouse industry
The values exposed in Table 2 are related to raw materials processed during one year (4610 tons) for an annual electricity consumption of 1200 MWh. The same slaughterhouse has cold rooms with a volume of 2,300 m3 and with a compressors nominal power of 220 kW.
Figure 5. Data input window.
When the user inputs the data shown in Table 2 in the data input window for slaughterhouses, as shown in Figure 5, and presses "Start Simulation", he has access to a set of graphs (see Figure 6). The resulting graphs illustrate the current situation of the slaughterhouse in an energy perspective (red circle) and also the reference situation that matches the national average performance (black circle) for that parameter.
The graphs obtained with the simulation (see Figure 6), allow to draw some conclusions for this particular company:
(1) In the first graph, which relates the annual electricity consumption with the raw material, is expected an excessive energy consumption for production, specifically, 33% higher than the national average value. (2) In the second graph, which shows the relationship between compressors nominal power and raw material processed, a warning is predicted, because the compressors power for the conservation of raw material is 14% higher than the national average value.
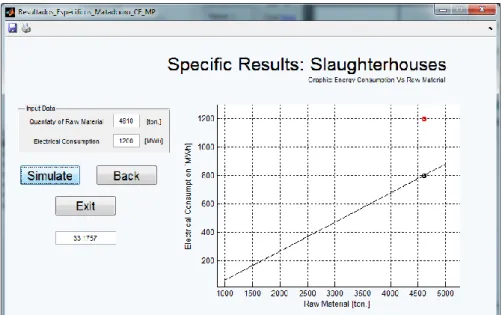
(3) In the graph comparing the volume of cold rooms and the raw material, an 9% volume excess is predicted, which shows that the cold rooms are more than enough to store that amount of raw material. (4) Regarding the relationship between the electricity consumption and compressors nominal power, it is predicted an electricity consumption above the national average value. However, the results of the last graph, where the compressors nominal power is compared with the cold rooms volume provides a consistent value: the compressor nominal power (220 kW) is enough to cool the air volume of cold rooms (2,300 m3). The difference of this behaviour may be related with other factors that contribute to energy consumption increase such as lighting, thermal losses in cold rooms, among others. A first suggestion to the maintenance department would consider checking the overall insulation conditions and the proper closure of doors of cold rooms (common situations observed during the development of the preliminary experimental studies). If the user wishes a particular graph analysis, as for example, the annual energy consumption as function of raw material processed (see Figure 7), simply press the button corresponding to the graph. This graph predicts a 33% deviation of the annual energy consumption between this particular slaughterhouse (red circle) and the national average value (black circle).
Figure 7. Case study: Slaughterhouse industry - Specific results: energy consumption vs. raw material. However, this is a particular example to illustrate the functionality of the software tool. Any other slaughterhouse with similar characteristics (production process) may be analyzed which is below the correlative line, predicting in this case a performance higher than the national average.
4.2. Case study: Sausages industry
In this case study of a sausage industry, the input parameters are shown in Table 2. Using the same procedure as previously for the slaughterhouse industry, the general results shown in Figure 8 characterize this particular sausages industry. The following conclusions can be outlined:
(1) For the raw material produced annually, the company has an annual electricity consumption similar to the national average value. It has a suitable cold rooms volume and slight compressors nominal power above the national average for the raw material produced and stored every year;
(2) The energy outlook of this particular industry puts it in an ideal position compared to the national average of another’s sausage industry. If this particular case, the Specific Energy Consumption (SEC) value must be quantified in order to provide further analysis. This parameter will be considered in future developments of the computational tool.
Figure 8. General results for the case study of a sausages industry.
4.3. Case study: ham industry
Similarly, introducing in the tool the values of the ham industry (see Table 2), the general results are shown in Figure 9. From the analysis of the general results, the following conclusions can be outlined:
(1) There is excessive energy consumption for the amount of raw material produced every year;
(2) The cold rooms volume needs to be increased to the amount of raw material produced. Probably, the compressors operate continuously to maintain the temperature suitable for the conservation of this ham quantity and consequently with higher electricity consumption;
(3) Furthermore, the nominal compressors power is appropriate for the cold rooms volume.
4. CONCLUSION
This paper presents an initial version of a computational tool for analyzing the behaviour of a set of relevant parameters in the agro-industry companies, which reflect their performance against the Portuguese national average. This computational tool was developed in MATLAB, using the GUIDE (Graphical User Interface Design Environment) in order to provide a simple and quick reference graphical user interface. In order to demonstrate the its applicability, case studies of a particular slaughterhouse, sausages and ham industry are shown. Conclusions can be drawn from the graphical analysis of prediction results. These results allow positioning the company performance in relation to the experimental correlations obtained by Nunes et al. [13] that reflect the Portuguese national average. However, the analysis does not discards the need for a more detailed study to determine the particular conditions that may be improved.
The current state of computational tool allows the user to enter data of annual energy consumption, raw material processed annually, cold rooms volume and compressors nominal power. With these performance predictions, the user can decide how to improve the energy performance of its business. The practical application of this tool demonstrates its usefulness in helping decision-making in the implementation of energy efficiency measures. In the future, this tool will include other agro-industry sectors such as: fish, dairy, fruit and vegetables, vineyard and wine, distribution, among others. Additionally, it will provide the analysis of parameters as the Specific Energy Consumption (SEC). It will generate some automated suggestions for energy performance improvement. Also, it will be converted to an executable program.
ACKNOWLEDGMENT
This study is framed in the anchor-project "InovEnergy - Energy Efficiency in Agro-Industrial Sector" activities encompassed within Action Programme of InovCluster: Association of Agro-Industrial Cluster of Center region. The study was funded by the National Strategic Reference Framework (QREN 2007-2013) - COMPETE/POFC (Operational Programme for Competitiveness Factors), SIAC - Support System for Collective Actions: 01/SIAC/2011, Ref: 18642).
REFERENCES
1. Yu, K., Ding, G., Chen, T. 2009, A correlation model of thermal entrainment factor for air curtain in a vertical open display cabinet, Applied Thermal Engineering 29(14-15), 2904–2913.
2. Food and Agriculture Organisation. 2009, The state of food and agriculture-Livestock in the balance, Food and Agriculture Organisation (FAO) of the United Nations, Italy.
3. Instituto Nacional de Estatística. 2010, Estatísticas da Produção Industrial 2009, Instituto Nacional de Estatística (INE), Portugal, Lisbon. (in portuguese)
4. Muller, D.C.A., Marechal, F.M.A., Wolewinski, T., Roux, P.J. 2007, An energy management method for the food industry, Applied Thermal Engineering 27(16): 2677-2686.
5. Ramírez, C.A., Patel, M., Blok, K. 2006, How much energy to process one pound of meat? A comparison of energy use and specific energy consumption in the meat industry of four European countries, Energy 31(12): 2047-2063. 6. Instituto Nacional de Estatística. 2009, Consumos de electricidade, INE, Portugal, Lisbon. (in portuguese)
7. Herbert, L.S., Anderson, J., Buhot, J.W., Larnach, W.K. 1984, Test of an electrical energy saving technique in an Australian abattoir, International Journal of Refrigeration 7(3): 190-193.
8. Gigiel, A., Collett, P. 1989, Energy consumption, rate of cooling and weight loss in beef chilling in UK slaughter houses, Journal of Food Engineering 10(4): 255-273.
9. Gigiel, A., Hoder, D. 1992, The energy consumption in meat plants with slaughterhouses, In: Food engineering in a
computer climate, Taylor & Francis/Hemisphere Bristol, PA, USA: 309 - 314.
10. Fritzson, A., Berntsson, T. 2006, Efficient energy use in a slaughter and meat processing plant-- opportunities for process integration, Journal of Food Engineering 76(4): 594-604.
11. Fritzson, A., Berntsson, T. 2006, Energy efficiency in the slaughter and meat processing industry-opportunities for improvements in future energy markets, Journal of Food Engineering 77(4): 792-802.
12. AlQdah, K. 2010, Potential opportunities for energy savings in a Jordanian poultry company, Energy Conversion
and Management 51(8): 1651-1655.
13. Alpalhão, F. 1997, Estudo Sectorial da Indústria de Alimentação e Bebidas, in: CCE, DGE (Eds.), Lisboa.
14. Nunes, J., Silva, P.D., Andrade, L.P. 2011, Energetic efficiency evaluation in refrigeration systems of meat industries, Proc. 23rd International Congress of Refrigeration - ICR 2011, August 21 - 26, Prague, Czech Republic. 15. Santos, R., Nunes, J., Silva, P.D., Gaspar, P.D., Andrade, L.P. 2012, Ferramenta computacional de análise e
simulação do desempenho de unidades de conservação de carne através de frio industrial, Proc. VI Congreso Ibérico
y IV Congreso Iberoamericano de Ciencias y Técnicas del Frío (CYTEF-2012), Madrid, Spain, February. (in