UNIVERSIDADE DA BEIRA INTERIOR
Engenharia
Airports’ Performance and Efficiency
Concerning Low-Cost Carriers Operation.
An MCDA and SPSS analysis
Tiago Miguel Raposo Rosa
Dissertação para obtenção do Grau de Mestre em
Engenharia Aeronáutica
(Ciclo de estudos integrado)
Orientador: Prof. Doutor Jorge Miguel dos Reis Silva
Airports’ Performance and Efficiency Concerning Low-Cost Carriers Operation. An MCDA and SPSS analysis
Dedicatory
To my family and friends, especially to my parents, sister and brother-in-law for their unconditional love and support throughout this entire degree. I couldn’t finish this without them.
“To most people, the sky is the limit.
To those who love aviation, the sky is home”
Airports’ Performance and Efficiency Concerning Low-Cost Carriers Operation. An MCDA and SPSS analysis
Airports’ Performance and Efficiency Concerning Low-Cost Carriers Operation. An MCDA and SPSS analysis
Acknowledgements
First and foremost, I need to thank my supervisor Prof. Jorge Miguel Reis Silva for all his guidance, knowledge and motivation. I’m not only grateful for his support in each step of this work but also for his friendship and kindness.
I would like to give my gratitude to Maria Emilia Balthazar, my unofficial co-supervisor, for the opportunity to work and contribute to her PhD research. For her friendship and motivation to always improve my work and me as a person. For all the after hours spent cracking our heads to make our objectives come true.
My written appreciation to Prof. Rosário Macário and PhD Vasco Reis for their trust and for allowing me the possibility to participate in different research projects.
My greatest acknowledgement to NIT - Núcleo de Investigacao em Transportes and all its past, present and future researchers for the help making this research group more than one team, a family. A place that some call “arrumos” but I call a second home.
I want to thank all my friends for their support and encouragement throughout my life. Special thanks to my big friends Miguel Miranda and Laura Martins with whom I shared my last 6 years very closely. To my parents, Helena e José Rosa, for their love and unconditional support even through difficult times. I’m grateful to my sister Carina, to my brother-in-law Daniel e to the rest of my family for their support and love.
Last but not least, to the people who I did not mention above but contributed for this work and for making me grow professionally and personally. Big thanks for the ones that always supported me and made my life better and happier. Also for the ones that always tried to throw me down for making me a stronger person.
Airports’ Performance and Efficiency Concerning Low-Cost Carriers Operation. An MCDA and SPSS analysis
Airports’ Performance and Efficiency Concerning Low-Cost Carriers Operation. An MCDA and SPSS analysis
List of Publications
Articles produced as a result of this dissertation research (annexe 5):
1. Airport Benchmarking Process and the Key Performance Area of Safety/Security Paulo Marchão, Maria E. Baltazar, Tiago Rosa, Jorge Silva (2015). AIRDEV II - 2nd International conference of the Airport Development Series, 4-6 November, Bangalore (India).
2. MCDA Modelling of Airport Impacts due to LCC’s Operation
Tiago Rosa, Maria E. Baltazar, Jorge Silva (2015). Proceedings of ICEUBI 2015
-International Conference on Engineering, 2-4 December, Covilhã (Portugal), ISBN: 978-989-654-260-3, pp.50-62.
3. Low-Cost Carriers Impacts on Airport Performance. An MCDA Model
Tiago Rosa, Maria E. Baltazar, Jorge Silva (2016). Working paper published in
ResearchGate, DOI: 10.13140/RG.2.2.31658.41927/1.
4. Airport Benchmarking Process and the Key Performance Area of Safety
Paulo Marchão, Maria E. Baltazar, Tiago Rosa, Jorge Silva (2017). Case Studies on Transport Policy - Special issue “Airport Development (AIRDEV-2015)”, (Manuscript submitted for publication).
5. Impact in Tourism Sector of Portuguese Airports Hinterland due to Low-Cost Carriers Operation
Tiago Rosa, Maria E. Baltazar, Jorge Silva (2017). Invtur 2017 - International
confer-ence - Co-creating the future of tourism, 17-19 May, (Manuscript accepted for presen-tation).
6. Impact in Tourism Sector of Portuguese Airports Hinterland due to Low-Cost Carriers Operation
Tiago Rosa, Maria E. Baltazar, Jorge Silva (2017). Journal of Tourism and Development
– Special issue, (Manuscript accepted for publication).
7. Low-Cost Carriers Socio-Economic Impact in Tourism Development: The Case of Faro’s Airport Hinterland
Tiago Rosa, Maria E. Baltazar, Jorge Silva (2017). Tourism Spectrum – Special issue: Low
Cost Carriers and Tourism Destinations, March, vol. 3, No. 1, Fifth Issue, pp.29-40. 8. Performance and Efficiency Support Analysis for Airports and Airlines Benchmarking
Maria E. Baltazar, Tiago Rosa, Jorge Silva (2017). Journal of Air Transport Manage-ment – Special issue: Multiple Criteria Decision Making in Air Transport Man-agement, (Manuscript submitted for publication).
Airports’ Performance and Efficiency Concerning Low-Cost Carriers Operation. An MCDA and SPSS analysis
Airports’ Performance and Efficiency Concerning Low-Cost Carriers Operation. An MCDA and SPSS analysis
Resumo
Na última década, o crescimento das companhias aéreas de baixo custo criou uma nova relação mais complexa entre a companhia aérea, o aeroporto e o passageiro. Os aeroportos dependem da decisão das companhias aéreas de operar nas suas infraestruturas. No entanto, as companhias aéreas de baixo custo têm exigências operacionais diferentes das companhias de aéreas de bandeira/tradicionais. O estudo do crescimento das companhias aéreas de baixo custo permite que aos gestores dos aeroportos identificar os seus impactos positivos e negativos nas áreas e indicadores de desempenho e consequentemente os impactos no desempenho e eficiência globais do aeroporto. Com essa informação, os gestores aeroportuários podem estruturar seus planos de ações de curto e longo prazo e iniciativas considerando os impactos da operação de companhias de aéreos de baixo custo.
Esta pesquisa concentra-se na avaliação do desempenho e eficiência do aeroporto devido à operação de companhias aéreas de baixo custo através de um “benchmarking1” interno. Para
isso, a metodologia de análise multicritério de apoio à decisão (MCDA) escolhida foi MACBETH (Measuring Attractiveness by a Categalized Based Evaluation Technique) usando o modelo PESA-AGB (Performance Efficiency Support Analysis – Airport Global Benchmarking). É ainda, realizada uma análise estatística, utilizando o tráfego das companhias aéreas de baixo-custo e os resultados do modelo PESA-AGB para identificar e quantificar as áreas de desempenho dos aeroportos e as pontuações globais dos aeroportos que têm maior correlação com a evolução da operação das companhias aéreas de baixo custo, por um período de onze anos (2003-2013), usando Microsoft Excel e SPSS (Statistical Package for the Social Sciences).
Os resultados obtidos permitem identificar um conjunto de áreas de desempenho que apresentam níveis significativos de correlação com o número de passageiros e movimentos das companhias aéreas de baixo custo. Foram determinados elevados coeficientes de correlação de Pearson quando estudadas as correlações entre a pontuação global de desempenho e eficiência dos aeroportos com o trafego das companhias aéreas de baixo custo.
Palavras-chave
Desempenho Aeroportuário; Eficiência Aeroportuária; Companhias de Baixo; MCDA; MACBETH; SPSS
1 “benchmarking” é um padrão econômico para medir o desempenho do negócio, comparando
a produtividade e eficiência, avaliando processos específicos, políticas e estratégias, e para determinar o desempenho geral do negócio.
Airports’ Performance and Efficiency Concerning Low-Cost Carriers Operation. An MCDA and SPSS analysis
Airports’ Performance and Efficiency Concerning Low-Cost Carriers Operation. An MCDA and SPSS analysis
Resumo Alargado
IntroduçãoEsta secção resume, em língua portuguesa, o trabalho de investigação desta dissertação. Inicialmente é descrito o enquadramento da dissertação, de seguida aborda os seus objetos e os objetivos, terminando com a apresentação das principais conclusões e indicação das perspetivas de investigação futura.
Enquadramento da Dissertação
Nas últimas décadas, a aviação mostrou um crescimento contínuo não só no número de movimentos de aeronaves, mas mais importante no número de passageiros transportados. Embora tenha havido algumas interrupções temporárias devido a eventos extremos, como terrorismo, crises e guerras, o crescimento global tem sido positivo e exponencial [1].
Uma das principais causas do rápido crescimento do tráfego aéreo foi a desregulamentação do transporte aéreo nos anos setenta, nos Estados Unidos da América. Isso levou à liberação progressiva do mercado aéreo, criando a oportunidade para um novo e revolucionário modelo de negócios aparecer, com o objetivo de minimizar os custos operacionais da companhia aérea. Como consequência do menor custo operacional, as companhias aéreas com este modelo de negócios começaram a diminuir o preço dos seus bilhetes, criando um novo mercado de clientes que anteriormente não podiam pagar os preços elevados dos bilhetes das companhias aéreas tradicionais. Devido a esta característica e a um conjunto de outras características operacionais, estas transportadoras são chamadas de companhias aéreas de baixo custo [2]. Nos anos 90, o processo de liberalização do sector do transporte aéreo na Europa começou por remover a regulamentação sobre tarifas e entrada de rotas, causando a revolução das companhias aéreas de baixo custo na Europa [2], liderada na Irlanda, pela Ryanair e no Reino Unido com a EasyJet.
Para alcançar baixos custos de operação, os aeroportos foram e continuam a ser pressionados a fazer várias mudanças operacionais e de custo para poder acomodar as exigências criadas por parte do modelo de negócios das companhias aéreas de baixo custo [1]. Essas alterações passam, por exemplo, pela aplicação de menores taxas de operação para as companhias aéreas de baixo custo, reduzindo o uso de jetways [4], ou por usar terminais de baixo custo. Outra mudança operativa comum nos aeroportos é aumentar a eficiência das operações em placa, permitindo que as companhias aéreas tenham a aeronave o menor tempo possível no chão, reduzindo assim as taxas de ocupação das portas de embarque/”stands” que as companhias
Airports’ Performance and Efficiency Concerning Low-Cost Carriers Operation. An MCDA and SPSS analysis
xiv
aéreas têm de pagar ao aeroporto [5]. Para enfrentar este problema operacional, os aeroportos necessitam de expandir sua capacidade e de melhorar a eficiência das suas infraestruturas e sistemas. Todos estes fatores criaram a necessidade de os aeroportos efetuarem “benchmarking” internos e de se comparar com os outros aeroportos, em “benchmarkings” externos [1].
Objetos e Objetivos
Os objetos desta dissertação são o desempenho e eficiência aeroportuária e o trafego das companhias aéreas de baixo custo.
O primeiro objetivo é compreender as relações aeroportos-companhias aéreas e como estas evoluíram ao longo dos anos. Para isto é também necessário conhecer os diferentes modelos de negócios utilizados pelas companhias aéreas e quais as suas implicações esperadas nesta relação.
O segundo objetivo é compreender a necessidade do “benchmarking” aeroportuário e identificar quais as diferentes metodologias de “benchmarking” aeroportuário, estudando as suas vantagens e desvantagens. De seguida é necessário caracterizar as infraestruturas aeroportuárias, determinado o melhor método para avalia o desempenho e eficiência aeroportuária englobando todas as suas áreas. Adicionalmente, é preciso estudar as metodologias utilizadas para determinar correlações entre variáveis.
O próximo objetivo é caracterizar a evolução e identificar as tendências do transporte aéreo, focando a análise nos três principais aeroportos de Portugal continental. Seguidamente, é necessário obter as pontuações de desempenho aeroportuário de modo a poder comparar a sua evolução com a evolução do trafego das companhias de baixo custo.
Concluída a análise de evolução das pontuações de desempenho e do trafego, é necessário analisar e verificar a existência de possíveis correlações entre estas variáveis, e se existem quantifica-las.
Por fim, o último objetivo é verificar se as correlações acontecem de igual forma em todos os aeroportos ou se cada aeroporto apresenta diferente tipos e níveis de correlações com o trafego de companhias de baixo custo.
Principais Conclusões
A liberalização do transporte aéreo provocou grandes mudanças no sector, fazendo surgir um modelo de negócios mais agressivo e focado em baixos custo e em elevada produtividade. Nas últimas décadas, as companhias de baixo custo mostrado um rápido crescido a um ritmo constante, excetuando na maioria dos casos o período de 2008-2009. Adicionalmente, as
Airports’ Performance and Efficiency Concerning Low-Cost Carriers Operation. An MCDA and SPSS analysis
características operacionais destas companhias aéreas centradas na redução de custos e na elevada produtividade alteraram a relação tradicional entre companhias aéreas e aeroportos, transformando-a numa relação entre as companhias aéreas, aeroportos e passageiros. Nesta nova relação, os aeroportos viram-se obrigado a alterar o seu processo operacional e económico, tendo criado novos focos para a criação de receitas, de modo a combater as reduções nos preços de taxas aeroportuárias. Mais ainda, as novas necessidades operacionais dos aeroportos, bem como o início das suas privatizações, levaram a que estes procurem cada vez mais determinar e avaliar o seu desempenho aeroportuário.
Apesar do conceito de “benchmarking” não ser novo, a sua aplicação nos aeroportos ainda é relativamente escassa em termos de variedade de metodologias utilizadas. A maioria dos estudos estão focados a determinação do desempenho e eficiência aeroportuária utilizando apenas certas áreas de desempenho chave. O MCDA permite que esta análise incorpore um número indeterminado de áreas e indicadores de desempenho, criando assim uma avaliação do desempenho global das infraestruturas e sistemas aeroportuários.
O modelo utilizado nesta dissertação não é isento de desvantagens. Apesar do modelo PESA-AGB possuir um grande número de áreas de desempenho, ainda é necessário incorporar algumas áreas na avaliação. Outra desvantagem do modelo está relacionada com a metodologia que este usa, o MACBETH. As bases matemáticas do MACBETH utilizam como um dos “inputs” as opiniões de um grupo de especialistas, que estão sujeitas às subjetividades de cada um deles. O questionário efetuado para a recolha destas opiniões foi enviado para 500 especialistas tendo sido recebidas 81 respostas. Contudo, este facto não afeta a qualidade das respostas, porem quanto maior o numero de respostas mais reduzida será a subjetividade do modelo.
Outra dificuldade encontrada nesta investigação foi a recolha de dados para os 42 indicadores de desempenho dos três aeroportos. Os relatórios públicos dos aeroportos apenas disponibilizam parte da informação necessária, tendo sido necessário recorrer, para alguns anos da análise, a aeroportos de semelhante dimensão e tipo de operação.
Em relação à análise do número de passageiros e movimentos das companhias aéreas de baixo custo a informação encontra-se mais acessível, facilitando a rápida caracterização das variáveis. Contudo os relatórios de informação de trafego para o aeroporto do Porto e Lisboa consideram o número de tráfego das companhias aéreas de baixo custo como irrelevante para o ano 2003 e para os anos anteriores. Ao utilizar zero como representação destas companhias no ano de 2003, pode-se incorrer em erros estatísticos aquando da análise de correlações. A fraqueza da análise de correlações nos três casos de estudos foi o facto de a amostra ser pequena. Apesar de não existir literatura que defina um número mínimo para efetuar este tipo de análise, uma amostra com o valor 11 pode não ser suficiente para a representação das companhias aéreas de baixo custo no desempenho aeroportuário.
Airports’ Performance and Efficiency Concerning Low-Cost Carriers Operation. An MCDA and SPSS analysis
xvi
Todavia este estudo permitiu identificar um grupo de áreas chave do desempenho aeroportuários que possuem altos coeficientes de correlação. A tabela abaixo demostras as correlações obtidas para cada uma das áreas de cada aeroporto.
Tabela 1 – Coeficientes de correlação de Pearson entre o trafego das companhias de baixo custo e as áreas de desempenho do aeroporto 1, 2 e 3.
Coeficientes de correlação de Pearson
Aeroporto 1 Aeroporto 2 Aeroporto 3
Passageiros
LCCs Movimentos LCCs Passageiros LCCs Movimentos LCCs Passageiros LCCs Movimentos LCCs Segurança 0,39 0,43 0,37 0,40 0,37 0,41 Core 0,93 0,90 0,97 0,98 0,91 0,86 Produtividade / Eficiência de Custos 0,64 0,71 0,79 0,82 0,65 0,65 Qualidade de Serviço 0,89 0,85 0,67 0,68 0,78 0,74 Financeiro / Comercial -0,67 -0,64 -0,39 -0,41 0,02 -0,02 Ambiental 0,87 0,82 0,97 0,96 0,78 0,70 Pontuação do Aeroporto 0,934 0,943 0,90 0,92 0,92 0,89 Fonte: baseada no anexo 4.
Os resultados obtidos mostram uma clara correlação entre as companhias de baixo custo e a pontuação de desempenho aeroportuário dos três aeroportos analisados, sendo que a área de “Core” é a que apresenta um resultado mais elevado e consistente em todos os aeroportos. O modelo PESA-AGB mostrou-se como uma ferramenta bastante útil para a análise de desempenho, com grande versatilidade, capaz de processar grandes quantidades de informação e de se adaptar a qualquer tipo de aeroporto, quer em tamanho quem em tipo de operação.
Perspetivas de Investigação Futuras
Como consequência do trabalho desenvolvido e do conhecimento adquirido, as perspetivas de investigação futuras são as seguintes:
I. Versões futuras do modelo PESA-AGB deveriam incluir novas áreas de desempenho aeroportuário, como o caso da área de influência do aeroporto;
II. O estudo de outras metodologias estatísticas no que diz respeito à determinação de correlações;
III. Analisar a influência das variações operacionais das companhias áreas de baixo custo no desempenho aeroportuários, mais propriamente no que diz respeito ao fenómeno de responsabilidade associados a estas companhias aéreas;
Airports’ Performance and Efficiency Concerning Low-Cost Carriers Operation. An MCDA and SPSS analysis
IV. Efetuar os casos de estudo analisando não só as áreas chave de desempenho, mas também todos os indicadores de desempenho;
V. Introduzir ao estudo de correlações variáveis socioeconómicas e de turismo, referentes à área de influência do aeroporto;
VI. Compreender como identificar e determinar os impactos diretos (positivos e negativos) da operação de companhias aéreas de baixo custo no desempenho aeroportuário; VII. Conhecendo os impactos diretos, construir modelos preditivos de modo a poder
determine os impactos esperados do aumento ou diminuição da operação de companhias aéreas de baixo custo.
Referencias
[1] V. P. Liebert, “Airport Benchmarking An Efficiency Analysis of European Airports from an Economic and Managerial Perspective,” 2011.
[2] T. Rosa, M. E. Baltazar, and J. Silva, “MCDA Modelling of Airport Impacts due to LCC’s Operation,” in International Conference on Engineering of University of Beira Interior - Engineering for Society, 2015.
[3] ACI, “ACI Statistics Manual: A practical guide addressing best practices,” 2011. [4] Ryanair, “Ryanair Annual Report 2014,” 2014.
[5] R. K. Akamavi, E. Mohamed, K. Pellmann, and Y. Xu, “Key determinants of passenger loyalty in the low-cost airline business,” Tour. Manag., vol. 46, pp. 528–545, 2015.
Airports’ Performance and Efficiency Concerning Low-Cost Carriers Operation. An MCDA and SPSS analysis
Airports’ Performance and Efficiency Concerning Low-Cost Carriers Operation. An MCDA and SPSS analysis
Abstract
In the last decade, LCCs (Low-cost Carriers) growth has created a more complex airline–airport– passenger relationship. Airports depend on airlines decision to operate in their infrastructures. However, LCCs have different service demands than legacy carriers. The study of LCCs’ growth enables airport’s decision makers to identify their positive and negative impacts on KPAs and on KPIs and therefore the impacts on airport’s global performance and efficiency. With this information, airports’ decision makers can structure their short and long-term actions plans and initiatives considering LCCs’ operation impacts.
This research focuses on assessing airport’s performance and efficiency due to LCCs’ operations through an internal benchmarking. For this purpose, MACBETH (Measuring Attractiveness by a Categorical Based Evaluation Technique) was the Multi-Criteria Decision Analyses (MCDA) methodology chosen using the PESA–AGB (Performance Efficiency Support Analysis – Airport Global Benchmarking) model. Moreover, a statistical analysis is carried out, using LCCs’ traffic and PESA–AGB model outputs, to identify and quantify the airports’ KPAs (key performance areas) and airports’ overall scores that have a greater correlation with LCCs’ operations evolution, during an eleven years’ period (2003-2013), using Microsoft Excel and SPSS (Statistical Package for the Social Sciences).
The final results depict a set of KPAs with a high level of correlation with the number of LCCs’ passengers and movements. Moreover, high Pearson correlation coefficients were determined when the correlation between the three airports’ overall performance and efficiency scores and LCCs’ traffic was studied.
Keywords
Airports’ Performance and Efficiency Concerning Low-Cost Carriers Operation. An MCDA and SPSS analysis
Airports’ Performance and Efficiency Concerning Low-Cost Carriers Operation. An MCDA and SPSS analysis
Table of Contents
Dedicatory ... v Acknowledgements ...vii List of Publications ... ix Resumo ... xiResumo Alargado ... xiii
Abstract ... xix
Table of Contents ... xxi
List of Figures ... xxv
List of Tables ... xxix
List of Acronyms ... xxxi
Chapter 1 ... 1
Introduction ... 1
1.1 Theme Description ... 3
1.2 Objects and Objectives ... 4
1.3 Dissertation Structure ... 6
Chapter 2 ... 7
Air Transport Sector ... 7
2.1 Introduction ... 9
2.2 Air Transport Structure ... 9
Airline Industry liberalisation ... 12
2.3 Low-Cost Carriers Growth ... 15
2.4 Low-Cost Carriers Business Model ... 16
2.5 Conclusion ... 19
Chapter 3 ... 21
Benchmarking and Airports Performance Analysis ... 21
3.1 Introduction ... 24
3.2 Airport Infrastructure ... 24
3.3 Airport Benchmarking ... 25
3.4 Airport Performance Analysis ... 26
Methodologies for Airport Benchmarking ... 27
Decision-Making in Airport Infrastructures ... 30
3.5 Conclusion ... 32
Chapter 4 ... 33
Airports Multi-Criteria Decision Analysis ... 33
4.1 Introduction ... 35
Airports’ Performance and Efficiency Concerning Low-Cost Carriers Operation. An MCDA and SPSS analysis
xxii
Measuring Attractiveness by a Categorical Based Evaluation Technique (MACBETH) ... 36 4.3 Performance and Efficiency Support Analysis for Airport Global Benchmarking (PESA – AGB) ... 45
Structuring ... 45 Survey and Meetings ... 49 Evaluation ... 52 Classification and Outputs ... 53 4.4 Linear Regression and Correlation Coefficient ... 55 4.5 Conclusion ... 56 Chapter 5 ... 57 Case Studies ... 57 5.1 Introduction ... 59 5.2 Airport 1 (Case 1) ... 60 LCCs’ Traffic Evolution ... 61 PESA-AGB Model Outputs ... 62 Airport’s 1 Performance Correlation with LCCs’ Traffic ... 63 5.3 Airport 2 (Case 2) ... 71 LCCs’ Traffic Evolution ... 72 PESA-AGB Model Outputs ... 73 Airport’s 2 Performance Correlation with LCCs’ Traffic ... 75 5.4 Airport 3 (Case 3) ... 82 LCCs’ Traffic Evolution ... 83 PESA-AGB Model Outputs ... 84 Airport’s 3 Performance Correlation with LCCs’ Traffic ... 86 5.5 Analysis of Airport 1, 2 and 3 Case Studies ... 93 5.6 Conclusion ... 99 Chapter 6 ...101 Conclusions ...101 6.2 Dissertation Summary ...103 6.3 Concluding Remarks...104 6.4 Prospects for Future Work ...106 References ...107 Annexe 1 ...115 PESA-AGB Model Flowchart ...115 Annexe 2 ...117 PESA-AGB: Scores Outputs ...117 Annexe 3 ...135 PESA-AGB: Step by step example on how to obtain airport final score ...135 Annexe 4 ...143
Airports’ Performance and Efficiency Concerning Low-Cost Carriers Operation. An MCDA and SPSS analysis
SPSS Analysis ... 143 Annexe 5 ... 165 Publication Abstracts ... 165
Airports’ Performance and Efficiency Concerning Low-Cost Carriers Operation. An MCDA and SPSS analysis
Airports’ Performance and Efficiency Concerning Low-Cost Carriers Operation. An MCDA and SPSS analysis
List of Figures
Figure 1.1 - IFR movements evolution from 2001 to 2013 and 2014 to 2021 forecast growth. .. 3 Figure 2.1 - Traditional airline-airport relationship. ... 11 Figure 2.2 – New commercial model of airline-airport-passenger relationship. ... 12 Figure 2.3 – European liberalisation process... 14 Figure 2.4 – Worldwide low-cost carrier capacity share of total seats: 2006–2016. ... 15 Figure 3.1 – Generic framework for operational performance analysis. ... 27 Figure 3.2 – Quantitative methodologies to assess productivity and efficiency. ... 28 Figure 3.3 - Collaborative Decision Making Process. ... 31 Figure 4.1 – Matrix of value judgments for local evaluation of actions. ... 40 Figure 4.2 – PESA-AGB Model building tasks. ... 45 Figure 4.3 - Structuring step of PESA-AGB model. ... 45 Figure 4.4 – Survey and meeting steps from PESA-AGB model. ... 50 Figure 4.5 – Example of criteria judgement matrix. ... 51 Figure 4.6 - Building process of a decision conference. ... 52 Figure 4.7 - Evaluation step from PESA-AGB model. ... 52 Figure 4.8 – Example of a criteria value function from PESA-AGB model. ... 53 Figure 4.9 – Example of a judgement matrix and respective weight ponderation. ... 53 Figure 4.10 - Classification step from PESA-AGB model. ... 54 Figure 5.1 – Case studies process... 59 Figure 5.2 – Bottom-up process used to conduct steps (iii) and (iv) analysis. ... 60 Figure 5.3 - Airport 1 passengers and movements evolution distributed by type of airline. ... 61 Figure 5.4 – Airport 1 KPAs scores and overall ranking by year. ... 62 Figure 5.5 – Airport 1 overall scores evolution. ... 63 Figure 5.6 – Airport’s 1 safety and security KPA scores vs number of LCCs’ passengers. ... 64 Figure 5.7 – Airport’s 1 safety and security KPA scores vs number of LCCs’ movements. ... 64 Figure 5.8 – Airport’s 1 core KPA scores vs number of LCCs’ passengers. ... 65 Figure 5.9 – Airport’s 1 core KPA scores vs number of LCCs’ movements. ... 65 Figure 5.10 – Airport’s 1 productivity/cost effectiveness KPA scores vs number of LCCs’ passengers. ... 66 Figure 5.11 – Airport’s 1 productivity/cost effectiveness KPA scores vs number of LCCs’ movements. ... 66 Figure 5.12 – Airport’s 1 service quality KPA scores vs number of LCCs’ passengers. ... 67 Figure 5.13 – Airport’s 1 service quality KPA scores vs number of LCCs’ movements. ... 67 Figure 5.14 – Airport’s 1 financial/commercial KPA scores vs number of LCCs’ passengers. ... 68 Figure 5.15 – Airport’s 1 financial/commercial KPA scores vs number of LCCs’ movements. .. 68 Figure 5.16 – Airport’s 1 environmental KPA scores vs number of LCCs’ passengers. ... 69
Airports’ Performance and Efficiency Concerning Low-Cost Carriers Operation. An MCDA and SPSS analysis
xxvi
Figure 5.17 – Airport’s 1 environmental KPA scores vs number of LCCs’ movements. ... 69 Figure 5.18 – Airport’s 1 overall scores vs number of LCCs’ passengers. ... 70 Figure 5.19 – Airport’s 1 overall scores vs number of LCCs’ movements. ... 70 Figure 5.20 –Airport 2 passengers and movements evolution distributed by type of airline. .. 73 Figure 5.21 – Airport 2 KPAs scores and overall ranking by year. ... 74 Figure 5.22 – Airport 2 overall scores evolution. ... 74 Figure 5.23 – Airport’s 2 safety and security KPA scores vs number of LCCs’ passengers. ... 75 Figure 5.24 – Airport’s 2 safety and security KPA scores vs number of LCCs’ movements. ... 75 Figure 5.25 – Airport’s 2 core KPA scores vs number of LCCs’ passengers. ... 76 Figure 5.26 – Airport’s 2 core KPA scores vs number of LCCs’ movements. ... 76 Figure 5.27 – Airport’s 2 productivity/cost effectiveness KPA scores vs number of LCCs’ passengers. ... 77 Figure 5.28 – Airport’s 2 productivity/cost effectiveness KPA scores vs number of LCCs’ movements. ... 77 Figure 5.29 – Airport’s 2 service quality KPA scores vs number of LCCs’ passengers. ... 78 Figure 5.30 – Airport’s 2 service quality KPA scores vs number of LCCs’ movements. ... 78 Figure 5.31 – Airport’s 2 financial/commercial KPA scores vs number of LCCs’ passengers. .. 79 Figure 5.32 – Airport’s 2 financial/commercial KPA scores vs number of LCCs’ movements. .. 79 Figure 5.33 – Airport’s 2 environmental KPA scores vs number of LCCs’ passengers. ... 80 Figure 5.34 – Airport’s 2 environmental KPA scores vs number of LCCs’ movements. ... 80 Figure 5.35 – Airport’s 2 overall scores vs number of LCCs’ passengers. ... 81 Figure 5.36 – Airport’s 2 overall scores vs number of LCCs’ Movements. ... 81 Figure 5.37 – Airport’s 3 passengers and movements evolution distributed by type of airline. 84 Figure 5.38 – Airport 3 KPAs scores and overall ranking by year. ... 85 Figure 5.39 – Airport 3 overall scores evolution. ... 85 Figure 5.40 – Airport’s 3 safety and security KPA scores vs number of LCCs’ passengers. ... 86 Figure 5.41 – Airport’s 3 safety and security KPA scores vs number of LCCs’ movements. ... 86 Figure 5.42 – Airport’s 3 core KPA scores vs number of LCCs’ passengers. ... 87 Figure 5.43 – Airport’s 3 core KPA scores vs number of LCCs’ movements. ... 87 Figure 5.44 – Airport’s 3 productivity/cost effectiveness KPA scores vs number of LCCs’ passengers. ... 88 Figure 5.45 – Airport’s 3 productivity/cost effectiveness KPA scores vs number of LCCs’ movements. ... 88 Figure 5.46 – Airport’s 3 service quality KPA scores vs number of LCCs’ passengers. ... 89 Figure 5.47 – Airport’s 3 service quality KPA scores vs number of LCCs’ movements. ... 89 Figure 5.48 – Airport’s 3 financial/commercial KPA scores vs number of LCCs’ passengers. .. 90 Figure 5.49 – Airport’s 3 financial/commercial KPA scores vs number of LCCs’ movements. .. 90 Figure 5.50 – Airport’s 3 environmental KPA scores vs number of LCCs’ passengers. ... 91 Figure 5.51 – Airport’s 3 environmental KPA scores vs number of LCCs’ movements. ... 91 Figure 5.52 – Airport’s 3 overall scores vs number of LCCs’ passengers. ... 92
Airports’ Performance and Efficiency Concerning Low-Cost Carriers Operation. An MCDA and SPSS analysis
Figure 5.53 – Airport’s 3 overall scores vs number of LCCs’ movements. ... 92 Figure 5.54 – Airport 1, 2 and 3 LCCs’ traffic evolution... 93 Figure 5.55 – Airport 1, 2 and 3 overall scores. ... 94
Airports’ Performance and Efficiency Concerning Low-Cost Carriers Operation. An MCDA and SPSS analysis
Airports’ Performance and Efficiency Concerning Low-Cost Carriers Operation. An MCDA and SPSS analysis
List of Tables
Table 2.1 - Control and cooperation between subsectors in the air transport Industry. ... 9 Table 2.2 – Air transportation trends. ... 13 Table 2.3 – Summary of LCCs and legacy carriers common characteristics. ... 19 Table 3.1 – Classification of airport activities. ... 25 Table 3.2 - Main methodologies used in airport performance assessment. ... 28 Table 4.1 - Scope of each key performance area (KPA) and key performance indicator (KPI) of PESA-AGB. ... 47 Table 4.2 – KPIs’ performance descriptor structure. ... 49 Table 4.3 – Example of KPA scores table. ... 54 Table 5.1 –Airport 1 number of passengers and movements from 2003 to 2013... 61 Table 5.2 – Airport 1 scores table. ... 62 Table 5.3 – Linear correlation between LCCs’ traffic and airport’s 1 KPAs and overall scores. 71 Table 5.4 – Airport 2 number of passengers and movements from 2003 to 2013. ... 72 Table 5.5 – Airport 2 scores table. ... 73 Table 5.6 –Linear correlation between LCCs’ traffic and airport’s 2 KPAs and overall scores. 82 Table 5.7 –Airport 3 number of passengers and movements from 2003 to 2013... 83 Table 5.8 – Airport 3 scores table. ... 84 Table 5.9 –Linear correlation between LCCs’ traffic and airport’s 3 KPAs and overall scores. 93 Table 5.10 – Coefficient of determination for linear regressions between LCCs’ traffic and airport 1, 2 and 3 KPAs and overall scores. ... 95 Table 5.11 – Adjusted coefficient of determination for linear regressions between LCCs’ traffic and airport 1, 2 and 3 KPAs and overall scores. ... 96 Table 5.12 – Standard error of the estimate for the linear regressions between LCCs’ traffic and airport 1, 2 and 3 KPAs and overall scores. ... 97 Table 5.13 – Pearson correlation coefficient for linear regressions between LCCs’ traffic and airport 1, 2 and 3 KPAs and overall scores. ... 98
Airports’ Performance and Efficiency Concerning Low-Cost Carriers Operation. An MCDA and SPSS analysis
Airports’ Performance and Efficiency Concerning Low-Cost Carriers Operation. An MCDA and SPSS analysis
List of Acronyms
A-CDM: Airport Collaborative Decision Making ACI: Airports Council International
AHP: Analytic Hierarchy Process ATC: Air Traffic Control
CDM: Collaborative Decision Making DEA: Data Envelopment Analysis EU: European Union
FAA: Federal Aviation Administration GDS: Global Distribution Systems
ICAO: International Civil Aviation Organization IFR: Instrument Flight Rules
KPIs: Key Performance Indicators LCCs: Low-Cost Carriers
LPPs: Linear Programming Problems
MACBETH: Measuring Attractiveness by a Categorical Based Evaluation Technique, Measuring Attractiveness by a Categorical Based Evaluation Technique
MCDA: Multi-Criteria Decision Analysis, Multi-Criteria Decision Analysis
PESA – AGB: Performance and Efficiency Support Analysis for Airport Global Benchmarking, Performance and Efficiency Support Analysis for Airport Global Benchmarking
PESA-GB: Performance and Efficiency Support Analysis for Global Benchmarking R : Adjusted Coefficient of Determination
R2: Coefficient of Determination
SFA: Stochastic Frontier Analysis
SPSS: Statistical Package for the Social Sciences, Statistical Package for the Social Sciences TFP: Total Factor Productivity
USA: United States of America WLU: Work Load Unit
Airports’ Performance and Efficiency Concerning Low-Cost Carriers Operation. An MCDA and SPSS analysis
Airports’ Performance and Efficiency Concerning Low-Cost Carriers Operation. An MCDA and SPSS analysis
Chapter 1
Introduction
1.1 Theme Description
1.2 Object and Objectives
1.3 Dissertation Structure
Airports’ Performance and Efficiency Concerning Low-Cost Carriers Operation. An MCDA and SPSS analysis
Chapter 1 | Introduction
1.1 Theme Description
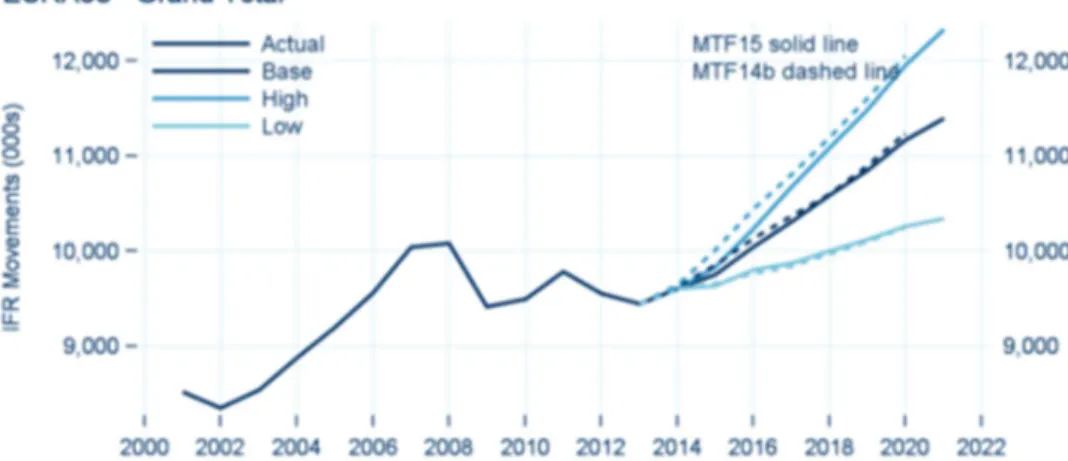
In the last decades, the aviation has shown and continuous growth in the number of aircraft movements, but more important in the number of passengers transported. Although there have been some temporary interruptions due to extreme events, like terrorism, crisis and war, the overall growth has been positive and exponential [1]. Figure 1.1 shows the Instrument Flight Rules (IFR) movements evolution from 2001 to 2013 and the forecast growth from 2014 to 2021 [2].
Figure 1.1 - IFR movements evolution from 2001 to 2013 and 2014 to 2021 forecast growth. Source: [2].
One of the major causes of the rapid growth in air traffic was the air transport deregulation in the seventies. This lead to the progressive liberation of the market, which opened the door to new revolutionary business model aiming to minimise the airline operational costs. As a consequence of the lower operational cost, airlines adopting this types of business models began decreasing its ticket prices, creating a new market of customers who previously could not afford the high rates of legacy carriers. Due to the characteristics of such operation, these carriers are called Low-Cost Carriers (LCCs) [3].
The European Union liberalisation package began removing regulation over fares and route entry in the nineties, causing the revolution of LCCs in Europe [4], which was led by Ireland, with Ryanair, and by the United Kingdom, with EasyJet.
To achieve low operation costs, airports started and still continue to be pressured to made several costs and operational changes to meet the objectives of LCCs’ business model [1]. This changes can be, for example, lower operating taxes for airlines by reducing the use of jetways [5], or by using low-cost terminals. Another common operational change in the airport is to
Airports’ Performance and Efficiency Concerning Low-Cost Carriers Operation. An MCDA and SPSS analysis
4
increase the turnaround efficiency allowing the airlines to have the aircraft less time on the ground, and therefore having lower stand/gate occupation taxes [6].
Consequently, all of this changes in the airport financial and operational activities created the need to assess airports efficiency and performance, and to compare it with other airports. Moreover, is necessary to identify these airport’s changes impacts due to the operation of different airline business models types.
1.2 Objects and Objectives
The objects of this work are airport’s performance and efficiency and LCCs’ traffic with the main objective of determining correlations between LCCs’ operation and airport’s efficiency. Therefore, specific objectives were defined based on seven scientific questions:
Question 1
What is an airport-airline relationship? How did it evolve throughout the years? And why?
The objective is foremost to comprehend airports-airlines relationship and how it evolved through the years. Due to the existence of airlines with different business models, it’s also necessary to assess how each business model approach this relation and its expected implications.
Question 2
Why it’s necessary to benchmark airports? Which methodologies are currently used and what’s their contribution?
The objective is to understand the need for airport benchmark and to identify the different benchmark techniques. This question also has the objective of characterising the methodologies currently used for airport benchmark, identifying their advantages and disadvantages and understanding how they can help a decision-making process.
Question 3
How to assess airports’ overall performance and efficiency using MCDA? What statistical analysis is used to determine correlations between variables?
The objective is to understand how to characterise an airport infrastructure and to determine the best way to obtain the airports’ overall performance and efficiency using MCDA. Thus, this questions goal is choosing the case studies methodologies. Firstly, is necessary to define a
Chapter 1 | Introduction
model structure to assess airports’ performance and efficiency. Moreover, finding the methodology commonly used to check the existence of correlations needs to be addressed.
Question 4
How airlines traffic evolved? In what way the LCCs’ market share changed? The objective is to identify the evolution and trends of air transport market in the world, focusing on the European aviation, more precisely in Portugal continental airports. Understanding and studying air transport evolution in these three airports can help understand how the number of movements and passengers changes airports’ performance and efficiency.
Question 5
How airports’ performance and efficiency progressed over the years? Does it follow the same trend of LCCs’ traffic evolution?
After analysing the air transport evolution, the objective of this question is to obtain the airports’ performance and efficiency scores in order to compare them with LCCs’ traffic. There is a need to check for possible similar trends to support a more extensive analysis, using another tool to complement this study.
Question 6
Is LCCs’ traffic evolution correlated with each airport performance and efficiency scores? In what degree?
The objective is to analyse the correlation between LCCs’ operation and airports’ overall performance and efficiency scores and to identify in which Key Performance Areas (KPAs) these possible correlations are valid. If valid, determine the degree of the variables correlation.
Question 7
Do the three case studies produced the same correlation results among the airports? Finally, the last objective is to determine if the existing correlations between LCCs’ operation and airports’ KPAs and overall performance and efficiency scores are replicated in other airports and if the results vary and how. The goal of this question is to comprehend if every airport experiences the same type of correlation with LCCs’ traffic or if each case is different.
Airports’ Performance and Efficiency Concerning Low-Cost Carriers Operation. An MCDA and SPSS analysis
6
1.3 Dissertation Structure
The subjects and organisation of the main chapters of this dissertation can be summarised as follows:
Chapter 1 consists of an introduction to the work through a theme description and presentation of the dissertation objects and objectives. This chapter also describes the dissertation structure.
Chapter 2 presents a state of the art review in air transportation relationships, describing the most common airline business model from LCCs and legacy carriers. A comparison showing the biggest differences between LCCs’ and legacy carriers’ business models is also provided in this chapter to help understand their influence in airport benchmarking.
Chapter 3 depicts a literature review on airport benchmarking and the most common tools to analyse airports performance and efficiency. This chapter also describes the usual decision-making processes in complex infrastructures like airports.
Chapter 4 introduces a brief description of MCDA to the methodology used in the study, Measuring Attractiveness by a Categorical Based Evaluation Technique (MACBETH). This chapter continues by explains the tool used to analyse the case studies, which is called Performance and Efficiency Support Analysis for Airport Global Benchmarking (PESA – AGB). To describe the tool, all the steps to conclude the evaluation process are presented. A brief review of linear regression and correlation coefficients is done to allow the identification of the correlations between airports’ performance and efficiency scores and LCCs’ traffic evolution.
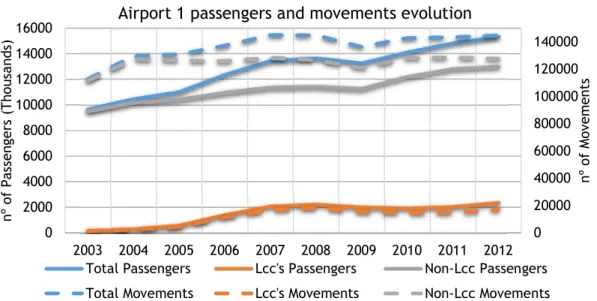
Chapter 5 contains the case studies. This chapter comprises three case studies, each one analysing different airports. In each case study is done an airport traffic analysis, differentiating the airline type, and assessing the airport performance and efficiency scores using PESA-AGB model presented in chapter 4. Moreover, a correlation analysis of these two parameters is performed to identify possible correlations.
Chapter 6 presents the work conclusions, with a brief dissertation summary and concluding remarks. Some areas of future research work are also presented at the end of this chapter.
Airports’ Performance and Efficiency Concerning Low-Cost Carriers Operation. An MCDA and SPSS analysis
Chapter 2
Air Transport Sector
2.1 Introduction
2.2 Air Transport Structure
2.2.1 Airline Industry liberalisation
2.3 Low-Cost Carriers Growth
2.4 Low-Cost Carriers Business Models
2.5 Conclusion
Airports’ Performance and Efficiency Concerning Low-Cost Carriers Operation. An MCDA and SPSS analysis
Chapter 2 | Air Transport Sector
2.1 Introduction
Contrary to commonly considered, the air transport business is a highly heterogeneous sector with a considerable group of actors. What makes this a heterogeneous group of actors is the fact that while some remain subject to state control, other are fully privatised or even under a mixed regime. The privatised actors focus their business in profit maximisation, while the state-controlled ones have the objectives such as maximisation of employment and/or value added, in general, the maximisation of socioeconomic surplus [7].
Economic prosperity can increase the demand for mobility and sequentially increase the use of air transport. Many studies conclude that wealthier person tends to travel further and more often, paying for more goods and services from third parties. This tendency is amplified in air transport, due to technological advances, low energy costs, improved operational cost efficiencies and strengthened competition within the industry [8].
2.2 Air Transport Structure
Nowadays, air transport has an increasing impact in world’s economy. The growth of air travelling, whether for tourism or business purposes, caused a development in airport capacities, supporting millions of jobs. The increasing affordability of air travelling created a new destination and market opportunities. LCCs are a good example of the mass customization of the air travel services, opening air transportation to customer segments that couldn’t fly regularly before [8].
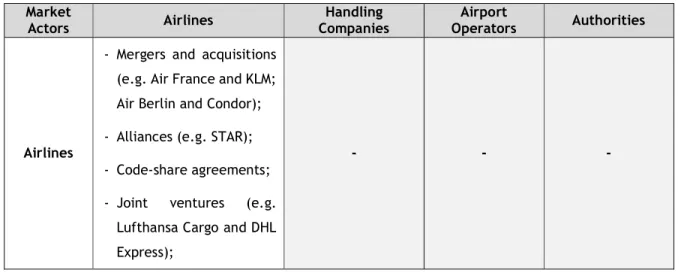
In order to understand the evolution of the air transport sector, it is necessary to understand the relationships between all actors. Table 2.1 identifies the common cooperation between the different actors in the air transport industry.
Table 2.1 - Control and cooperation between subsectors in the air transport Industry. Market
Actors Airlines Companies Handling Operators Airport Authorities
Airlines
- Mergers and acquisitions (e.g. Air France and KLM; Air Berlin and Condor); - Alliances (e.g. STAR); - Code-share agreements; - Joint ventures (e.g.
Lufthansa Cargo and DHL Express);
Airports’ Performance and Efficiency Concerning Low-Cost Carriers Operation. An MCDA and SPSS analysis
10
Market Actors Airlines Handling Companies Airport Operators Authorities - Participations (e.g.Thomas Cook in Air Berlin).
Handling Companies
- Previously sometimes integrated into airline (cfr. monopoly risk by dominant national carrier), nowadays often outsourced.
- Specific contracts (e.g. in 2007 Martinair with Aviapartner, for 9 German airports, for 3 years). - Concentration by take-overs (e.g. Aviapartner, Menzies,…). - - Airport Operators - Participations (e.g. Lufthansa in Munich); - Co-operation between
airports and airlines (e.g. Charleroi and Ryanair).
- Assignment, concessions; - Integration (e.g. Aeropuertos Argentina 2000). - Mergers / acquisitions (e.g. Brussels Airport by Macquarie). - Authorities - Participation government in Flag Carriers (e.g. Olympic, TAP,…). - Monopoly by airport authority or its sole concessionaire; - Concession assignment control. - Participation government in airports, including (partial) privatisation. - Participation governments in airlines (e.g. French and Italian State in Alitalia). Source: Adapted from [7].
There are various links between the different air transport actors, both within a particular subsector, like the airline industry, and beyond, between airlines and ground-handling companies. Different types of agreements are made between each company operating in the air transport business with different actors [7].
Each merger or acquisition can have an impact on the relations with other actors. After a thorough analysis of the strategic behaviour of several carriers, Voorde and Macário [8] (pp.11) concluded that although “(…) each airline tends to position its own product in a specific way,
Chapter 2 | Air Transport Sector
the available tools are invariably the same”. Therefore, the approach used by the airlines mostly combines control over the unit cost and optimisation of the seat occupancy or loading factor with the attempt to maximise the yield (passengers and freight) [8].
For the goal of this thesis, the focused key link between actors is the airline-airport relationship, in order to understand how this relationship started and how it has evolved. Airports depend on the decision of airlines wanting to operate in their infrastructures, and so without airlines, airports have no market. For this reason, airports normally viewed airlines as their primary customers [9]. Figure 2.1 represent how airline-airport relationship was traditionally viewed.
Figure 2.1 - Traditional airline-airport relationship. Source: [9].
When operating in an airport, airlines pay several fees, such as landing fees, passenger or tonne of freight handled fees, aircraft parking fees and other aeronautical charges like air traffic control and air-bridges. These fees represent what is normally designated as airport aeronautical revenues. Aeronautical revenues used to be the biggest source of income for European airports. However, the perception of passengers as airlines business change since the 90’s, when the traditional public utility model of airport management change to a more commercial business model. With this new business model, airports around the world started viewing passengers as important customers for airports, shifting their focus from the aeronautical revenues to the non-aeronautical revenues [9]. To raise the non-aeronautical revenues, the airports started developing new business areas, such as rents, concessions, car parking, consultancy and property development. The increased focus of airports management on passenger spending in the terminals and car parks has led to the creation of a more complex airline–airport–passenger relationship as represented in Figure 2.2.
Airports’ Performance and Efficiency Concerning Low-Cost Carriers Operation. An MCDA and SPSS analysis
12
Figure 2.2 – New commercial model of airline-airport-passenger relationship. Source: [9].
In the last decades, airlines promote a rigid cost control due to their competitive and deregulated market. The Increase of oil prices and limited capacity for an increasing demand require airlines to seek cost reductions at their primary supplier. This forced airport to increase their efficiency [10].
Airlines have a strong influence in airport managers’ decisions because they can choose to move their operations to other airports unless the airport offers a reduction of fees or commercial incentives [9]. This adds to pressure on airport management to sell off marginal capacity cheaply forcing airports to reconsider their strategy with respect to their relationship with airlines [11].
Airport managers, attempting to improve their financial performance, have seen LCCs as a way to increase passenger numbers. However, LCCs have different service demands as legacy carriers. For example, they don’t require business lounges, high-level check-in services, or the use of air-bridges, and baggage transfer services. All of these are space consuming facilities. LCCs objective is to be an efficient user of the airport's facilities, with rapid turnaround times and not demanding high levels of service within the terminal [9]. Nonetheless, LCCs also look for the reduction in airport charges because, although airport costs represent on average 4% of legacy carriers’ operating costs, it goes up to 17% of LCCs’ operating costs, representing the third most important cost for LCCs after fuel and aircraft leasing costs [11].
Therefore, LCCs have to change the airline-airport relationship. Airports have positively responded to LCCs’ growth and its opportunities. This new airline-airport-passenger relationship has led airports to significantly reduce their aeronautical revenues while seeking to increase their non-aeronautical revenues through increased passenger numbers [10].
Airline Industry liberalisation
The evolution of air transportation has shown several trends, identified in Table 2.2, mainly caused by social, technological, economic and political drivers [8].
Chapter 2 | Air Transport Sector
Table 2.2 – Air transportation trends. Contextual
Drivers
Internal
Trends and Drivers Trends Social - Networks and growing impacts of networking.
- Changes in air transportation market structure;
- Changes in airlines, airline- airport and airports relationships; - Declining Yields. Technological - Technological evolution.
Economic
- Evolution towards a mass-market sector; - Increasing safety concerns;
- Emerging new forms of modal competition; - Irregular space and time distribution of the
sector.
Political - Liberalisation and deregulation of the market. Source: adapted from [8].
The political driver has been the most significant driver marking the pace of the competitive market waving in the air transport sector [8].
Due to the increasing number of flight between different countries, in 1994 was sign the Convention on International Civil Aviation, also known as Chicago Convention. This convention set a number of measures regulation aviation, allowing the development and evolution of air transport “in a safe and orderly manner and that international air transport services may be established on the basis of equality of opportunity and operated soundly and economically” [12] (pp.1). However, the United States of America (USA) were in favour of an “open sky” reg-ulation, so in the late seventies, they started the deregulation of their air transport sector. The “open sky” politic, allowed the introduction of new concepts like code-sharing, free fares and a greater freedom in establishing routes and frequencies [13].
Liberalisation of the air transport market in Europe started only in 1987, and would only be complete in 1997, almost two decades after USA deregulation process. One of the reasons for this prolonged process, was the fact of Europe being a group of different countries each one with its own legacy carrier supported by the state. Before the liberalisation, Europe air transport market was heavily regulated, with low completion between legacy carriers since the states had bilateral agreements imposing fares, frequencies of flight and operations in certain routes and airports. This meant that market entry for different carriers was practically impossible [13].
The liberalisation process was divided into three measure packages, approved in three different dates. Figure 2.3 outlines the European air transport liberalisation process, referring the main measures adopted in each package.
Airports’ Performance and Efficiency Concerning Low-Cost Carriers Operation. An MCDA and SPSS analysis
14
Figure 2.3 – European liberalisation process. Source: Adapted from [13].
The three liberalisation packages main regulation outcomes can be summarised as [14]: - Licensing of air carriers: This states that members shall permit any European Union
(EU) carrier holding an operating license granted pursuant to the regulation to exercise traffic rights within the EU;
- Market access: This states that there aren’t access restrictions to routes between member states. In other words, any carrier holding a valid air operators’ certificate in the EU cannot be stopped from operating any other route within the EU, including unrestricted access to cabotage2 routes;
2 Cabotage is the transport of goods or passengers between two places in the same country by
Chapter 2 | Air Transport Sector
- Fares and rates for all air services: The basic effect of this regulation is freedom for EU carriers to set fares for scheduled, chartered and cargo services.
The approval of the third and last liberalisation package led to the end of bilateral agreements between states and created a free European air transport market. Since 1997, air carriers have a greater freedom to establish their fares, capacity and to operate in new routes, which allowed bigger market competition and diversity of fares, resulting in the arising of new air carriers, including the low-cost carriers [13].
2.3 Low-Cost Carriers Growth
North America experienced a first wave of LCCs start-ups following US airline deregulation. Following European air transport liberalisation, Europe experienced a “second-wave” of LCCs resulting in a key growth area for air traffic [15].
LCCs have created a new competitive environment within liberalised markets and have been experiencing substantial growth. Currently, LCCs can be found in almost every market in the world and it is expected that they continue to increase their market share especially in the Asia-Pacific region with as much as a 60 percent market share expected by 2030. As shown in Figure 2.4 these carriers have been successful at acquiring market share and it is expected that LCCs will increase their global market from 25.5 percent to 34 percent by 2030 [15], [16].
Figure 2.4 – Worldwide low-cost carrier capacity share of total seats: 2006–2016. Source: CAPA - Centre For Aviation With Data Provided by OAG [16].
Numerous authors have concluded that deregulation has been the underlying reason for Europe’s LCCs growth and expansion [17]–[22].
By 2000, LCCs had still a low market share in Europe, where the top six out of fourteen legacy carriers represented 64% of air traffic [23]. Nevertheless, LCCs in Europe were gathering strength and beginning to expand rapidly. A study conducted by the UK Civil Aviation Authority emphasised that this led to a major shift in the industry, creating not only travel opportunities to new types of customers, but also threatening the high cost operating structures of legacy
Airports’ Performance and Efficiency Concerning Low-Cost Carriers Operation. An MCDA and SPSS analysis
16
carriers. The European market produced a greater opportunity for LCCs than that in North America [14]:
- Larger number of short/medium routes in Europe; - Very expensive flight and train fares within Europe;
- Closer High-density cities in Europe than they are in North America; - Successful replicability of Southwest model in Europe.
United Kingdom, Spain, Germany and Italy represent the biggest LCC market in Europe representing more than two-thirds of the total number of transport passengers and exceeding half of the destinations offered by LCCs in Europe [24].
However, while there are many successful cases of LCCs, the list of failed ones is long calling into question why this business model didn’t work for so many carriers. O’Connell (2007) explain this problem as many major carriers attempted to reproduce LCCs’ business model but never absolutely adopting it. In other words, some carriers try to adopt an LCCs’ commercial image without changing their cost structure, which ultimately led to their failure [14].
O’Connell [14] (pp.77) adds that “There has been a paradigm shift in the airline business since the start of the new millennium, as low cost carriers have won the favour of in-vestors and have altered the strategic thinking of airline directors worldwide” .
Although every carrier is unique, there are common characteristics in all LCCs’ business models enabling them to succeed where others have failed. Next section 2.4, depicts the general characteristics that allowed the successful of LCC’s model structure.
2.4 Low-Cost Carriers Business Model
LCCs’ business model is not a new one. In 1971, a new American airline, Southwest, was founded with a revolutionary business model in the sector, which combined high productivity with low cost. In Europe, Ryanair was founded in 1985 with the goal of offering low-cost flights between Ireland and the United Kingdom. Despite Ryanair initial growth, as many new LCCs, it faced big financial losses. However, in 1995, Ryanair adopts a new business model similar to Southwest Airlines, become one of the oldest and most successful LCC [15].
Although all LCCs operate in different environments, they present similar basic characteristics which differentiate them from legacy carriers. These characteristics include a simple fare structure, one aircraft type, direct ticket sales, flying to cheaper and less congested airports, no frequent flier programs, no free food and beverages, and fast aircraft turnaround times [15].
Chapter 2 | Air Transport Sector
(i) Lower labour costs and higher labour productivity
One of the airline’s biggest costs is labour costs, so LCCs’ business model tries to increase productivity while keeping the cost under control. This can be done by paying lower wages than the industry average, like many LCCs do, or by maintaining competitive wages, but having a higher employee productivity resulting in low labour costs per hour of productivity [15].
(ii) Lower ticket distribution costs
Another airline industry cost comes from ticket distribution. The first step LCCs’ business model took to reduce these costs was to remove travel agent commissions. Later, with the internet growth, started selling electronic tickets through their online websites [15]. The majority of legacy airlines rely on Global Distribution Systems (GDS) to distribute their tickets worldwide, such as Amadeus, Galileo, Sabre, Apollo and Worldspan. Using a GDS imply an average 13 dollars booking fee as opposed to a minor few dollars through internet electronic ticketing [25]. One successful approach used by LCCs is to initially use multiple GDS and, as their brand becomes stronger, slowly end their GDS agreements which enable a wide distribution network initially, and then lower its costs by pushing ticket sales toward the carrier website [15].
(iii) No-frills service
No-frills service is one of the most pinpointed characteristics by the consumers to differentiate LCCs and legacy airline. In legacy carriers, passengers received a complimentary hot meal with an extensive beverage service whereas in Europe LCCs everything is on a buy-on-board basis, including beverages. No-frills service is not only related to in-flight services. Many LCCs, in another attempt to reduce costs, don’t offer the amenities of frequent flier programs or expensive business lounges. Normally, LCCs have luggage allowances restriction, particularly in Europe, where there are strict rules concerning luggage allowance weights per passenger. This generates extra marginal revenue by conserving fuel [15].
As Vasigh et al. [15] (pp.380) said “The underlying premise behind the LCCs’ no-frills service strategy is ultimately a “pay as you go” approach, where the ticket price entitles you to just a seat on the aircraft”.
(iv) Common fleet type
It is usual for successful LCCs to use a common fleet type. This offers several benefits for the carrier like spare parts inventories reductions, lower flight crew training expenses, and improved operational flexibility. Economies of scale is the most important element in this cost reduction strategy. By bulk purchasing, LCCs can benefit with discounts from suppliers. For
Airports’ Performance and Efficiency Concerning Low-Cost Carriers Operation. An MCDA and SPSS analysis
18
example, all the specialised equipment that might be needed for a specific aircraft type only needs to be purchased once [15].
Regardless of aircraft type, LCCs’ aircraft are arranged in a high-density all-economy configuration, as every flight have a fixed cost, the more passengers on board, the more revenue the airline can obtain [15].
(v) Point-to-point service
Since market liberalisation, the legacy carriers have adopted a new route structure concept of Hub & Spoke, being Hub a major airport in a country or region and Spoke airports of smaller size. Operating in a Hub & Spoke system, means that the carrier offers flights between Hub airports and between them and Spoke airports [13]. This means that all Spoke flights come into one Hub airport and from there passengers have a connecting feed for the Spoke flights that depart shortly thereafter [15].
In spite of Hub & Spoke offering a large number of city connections, a Hub is also an extremely expensive operation. Besides having a revenue advantage of many city pair choices, the peak flight scheduling necessary for passenger convenience also means that economies of scale are not always achieved. Moreover, once the numbers of flights reach a critical level, any additional flight will increase costs resulting in diseconomies of scale. This is one of the major reasons why LCCs usually operate in a point-to-point or origin and destination (O&D) route structure. Under this route structure, airlines will still operate bases where economies of scale are realised, but will not have any peak level of flights [15].
In Europe, LCCs usually operate in a Base & Spoke system. The carrier bases aircraft at one airport (Base) and then flies to various destinations from there, enabling the carrier to create some economies of scale benefits. This increased utilisation of airport assets allows to operate more flights with fewer facilities and personnel, and this ultimately reduces costs [15].
(vi) Use of secondary airports
LCCs want to avoid congested primary airports, usually because it implies bigger turnaround times and higher airport fees. As an alternative, secondary airports are usually underutilised and although they are further from a city centre they offer lower landing fees, less congestion, and quicker turnarounds, resulting in a more cost-efficient operation [15].
(vii) Higher aircraft utilisation
Higher aircraft utilisation is another successful characteristic from LCCs’ business models. In LCCs point of view, while the aircraft is sitting on the ground it is not earning money. Therefore, having a higher daily aircraft utilisation is beneficial for the carrier. One way to increase the
Chapter 2 | Air Transport Sector
aircraft utilisation is by having a quicker turnaround time3. Offering free seating, passengers
tend to enplane and deplane faster, and operating in a Base & Spoke system, handling operations are less complex. These efficiencies enable LCCs to operate more flights, therefore generating more revenue [15].
All of the characteristics differentiating LCCs and legacy carriers have been summarised in Table 2.3.
Table 2.3 – Summary of LCCs and legacy carriers common characteristics.
Product Features Low-Cost Carrier Legacy Carrier Brand One Brand: low fare Brand Extensions: Fare + service Fares Simplified Complex
Distribution Online and Direct Booking Online, Direct and Travel Agent Check-in Ticketless Ticketless, IATA Ticket Contract Airports Secondary Mostly Primary
Connections Point to Point Code Share, Global Alliances Class segmentation One Class Two Classes
Inflight Pay for Amenities Complimentary Extras Aircraft utilisation Very High Medium to High Turnaround Time 25 minutes Low Turnaround
Product One Product: Low Fare Multiple Integrated Products Ancillary Revenue Advertising, Onboard Sales Focus on the Primary Product Aircraft Single Type Multiple Types
Seating Small Pitch Generous Pitch Customer Service Generally, Under Performs Full Service Operational Activities Focus on Core Extensions
Source: Adapted from [26].
2.5 Conclusion
Air transport business is a highly heterogeneous sector with a considerable group of actors. The growth of air travelling has an increasing impact in the sector.
The easing of civil aviation constraints has been gradually introduced since the late 1980s involving both domestic and international markets. This resulted in a fundamental shift in airline economics and have subsequently provided the necessary environment for the growth of low-cost carriers from the mid-1990s to current times.
LCCs have developed various strategies in their business models to gain competitive advantages over legacy carriers. The characteristics of LCCs’ business models are centred in cost reductions and higher productivity enabling them to increase their market margins and therefore offer
3 Turnaround Time – can be defined as the time took between arriving and departing from the
gate. It represents the time require to unload an airplane and finish preparing it for the next departure.