Title: Adaptation of a 3-factor model for the Pittsburgh Sleep Quality Index in Portuguese older adults
Nathália Brandolim Beckera, b* ; Saul de Neves Jesusb.
aPhD student in Psychology, University of Algarve, Portugal
bResearch Center for Spatial and Organizational Dynamics, University of Algarve, Portugal
*Corresponding author: Nathália Brandolim Becker – Universidade do Algarve, Campus Gambelas, edifício 9, Centro de Investigação sobre o Espaço e as Organizações, 8005-139 Faro – Portugal. Phone: 289 800 900 (ext.7161) Email: [email protected].
Abstract
The present study examined the factor structure of the Pittsburgh Sleep Quality Index (PSQI) in a sample of older Portuguese adults using a cross-validation approach. Design is a cross-sectional. A convenience sample of 204 community-dwelling older adults (M=70.05, SD=7.15) were included. The global sleep quality (GSQ) score ranged from 0 to 18 with a mean of 5.98 (SD ±3.45). The distribution showed that gender and perception of oneself as healthy influences GSQ in this sample. Cronbach’s α was 0.69, but increased to 0.70 if the “use of sleep medication” component was deleted. Exploratory factor analysis (EFA) demonstrated two factor model is better than one factor, and a model fit with good indices (chi-square=8.649, df=8, p=0.373). Confirmatory factor analysis (CFA) was performed on the single factor, two factor, and three factor models, with and without the “use of sleep medications” component. The best model was the 3-factor model without the “use of sleep medications” component (chi-square=1.214, df=6, GFI=0.997, AGFI=0.918, CFI=0.986, RMSEA=0.046). The adaptation of the model is similar to the original model, with the only change being the exclusion of the "use of medications to sleep" component. We suggest using that component as a complementary qualitative assessment of health.
1. Introduction
Currently, sleep problems constitute a global epidemic that threatens the health and quality of life of approximately 45% of the world’s population (Wade et al., 2008; WASM, 2016). Sleep deprivation and poor sleep quality have a high negative impact on health in the short and long term. Poor sleep quality has a negative impact on attention, memory and learning (WASM, 2016). It has also been associated with several serious health problems such as obesity, diabetes, and some cancers (Gottlieb et al., 2005; Gümüştekín et al., 2004; Taheri et al., 2004; WASM, 2016). In addition, many psychological disorders such as depression, anxiety and psychosis are also associated with sleep difficulties (Beusterien et al., 1999; WASM, 2016; Zammit et al., 1999).
Although the majority of sleep disorders are easily prevented or treated, fewer than one-third of those affected seeks professional assistance (WASM, 2016). However, sleep is a basic need of all people, just like eating and drinking, being crucial to ensure good health and quality of life (WASM, 2016). In a comprehensive epidemiological studies, it was found that more than 50% of older adults have insomnia complaints (Foley et al., 1995; Neikrug and Ancoli-Israel, 2010), and sleep improvement was associated with health improvement (Foley et al., 1999; Neikrug and Ancoli-Israel, 2010). However, other studies have also shown that the rates of sleep disorders are lower in healthy older adults (Neikrug and Ancoli-Israel, 2010; Vitiello et al., 2002). So, what changes over the lifespan is not an intrinsic ability to sleep well, but comorbidities related to aging, and not necessarily caused by aging itself (Neikrug and Ancoli-Israel, 2010).
Thus, the ability to identify any difficulties in sleep as soon as possible is essential for the screening of other important comorbidities to act in maintaining good quality of life and well-being of older people. The sleep assessment instrument most commonly used in clinical and research environments is the Pittsburg Sleep Quality Index - PSQI (Mollayeva et al., 2016). It is a self-assessment questionnaire with 19 items that measures sleep disorders through seven components that together make up a Sleep Quality score (Buysse et al., 1989). Several studies have examined the one-dimensionality of the PSQI and raised concerns about the factorial structure of the instrument (Mollayeva et al., 2016). Through a systematic review and meta-analysis it was found that eight out of eleven studies that factor analyzed the PSQI reported that a single factor model poorly fit the resulting data, and the PSQI is best represented by a model with two or three factors (Mollayeva et al., 2016).
Relatedly, analysis of the instrument using a Portuguese sample (João et al., 2017) found poor reliability (Cronbach's alpha). As demonstrated by Mollayeva et al. (2016), most studies using factor analysis achieved better results with a model with two or three factors. We understand that it is necessary to adapt a three factor model for the PSQI as, previously, reported by Cole et al. (2006), which will give an upgrade in our sample.
2. Methods
2.1 Research tools
2.1.1. Pitsburgh Sleep Quality Index
The PSQI assesses sleep quality over a one-month period. The questionnaire consists of 19 self-rated questions and five (5) questions that are to be answered by bedmates or roommates. These last five questions are used only for clinical information and, therefore, they are not tabulated in the scoring or reported in this article. The 19 self-rated questions are grouped into seven (7) components, with each one scored on a scale that ranges from 0 to 3 (see more detail in the original study,Buysse et al., 1989). The PSQI components are the following: 1) subjective sleep quality, 2) sleep latency, 3) sleep duration, 4) habitual sleep efficiency, 5) sleep disturbances, 6) use of sleeping medication, and 7) daytime dysfunction. The sum of these components yields one global score, which ranges from 0 to 21, where the highest score indicates the worst sleep quality. A global PSQI score greater than 5 indicates major difficulties in at least two (2) components or moderate difficulties in more than three (3) components (Buysse et al., 1989). The Portuguese version of the PSQI (João et al., 2017) was used in this study to evaluate its psychometric properties and the degree of fit of the three factor model in Portuguese older adults.
2.2 Sample
This study used a cross-sectional design. A convenience sample of 204 community-dwelling (152 females and 52 males) older adults (aged M=70.05, SD=7.15) were included. They were recruited in senior universities in Portugal. The inclusion criteria were: (a) more than 60 years old; (b) ability to understand, read and write in Portuguese; (c) does not live in nursing home; and, (d) does not require permanent medical care in a specific location. Those who lacked mental clarity about the scales or could not read the questions were excluded. All people who participated in this research gave their informed consent to answer the questionnaire.
2.3 Statistical analysis
A total of 204 questionnaires were completed and checked for data entry errors, missing data, or the presence of major outliers. Data analyses were performed with SPSS software version 21 and AMOS version-29. Given the nature of the variant and nonlinear transformations from item responses into component scores, statistical analysis was conducted on the component scores. The PSQI item responses were combined into seven different components (Buysse et al., 1989), which had small amounts of missing data, with no more than 5% missing data for any composite. A single-point multiple imputation procedure for missing data replacement (Schafer and Graham, 2002) was conducted for the missing points.
Descriptive statistics were computed for each sociodemographic and PSQI (global and components scores) variable, and their psychometric proprieties were examined (i.e., Cronbach’s Alpha [α] was computed). Descriptive statistics were calculated as frequencies (%) for categorical variables, whereas means and standard deviations were computed for continuous variables. KMO and Bartlett tests were performed to determine the suitability of this sample for factor analysis. Subsequently, the sample was split randomly into two independent groups to perform EFA (exploratory factor analysis) and CFA (confirmatory factor analysis) through software command (SPSS 21).
EFA was performed on the first random sample (n=102) using maximum likelihood estimate extraction and direct oblimin rotation to examine the factor structure of the PSQI-PT in older adults. CFA was conducted using the AMOS-21 (AMOS development Corporation, Spring House, PA, USA) in the second random sample (n=102). In this analysis we tested the model identified through the EFA, the single factor structure of the PSQI, and the three factor model suggested by Cole et al. (2006). The adjustment of the model was assessed using several statistical indices including a chi-square test (non-significant values indicate good model fit), the root mean chi-square error of approximation (RMSEA; values ≤0.08 indicate close approximate fit), and the comparative fit (CFI), goodness of fit (GFI), and adjusted goodness of fit (AGFI) indices (values >0.97 indicate good model of fit) (Hair Jr. et al., 2010).
This research was performed in accordance with European research guidelines. All participants in this research freely consented to answer the questionnaire and signed an informed consent form before inclusion in the study.
3. Results
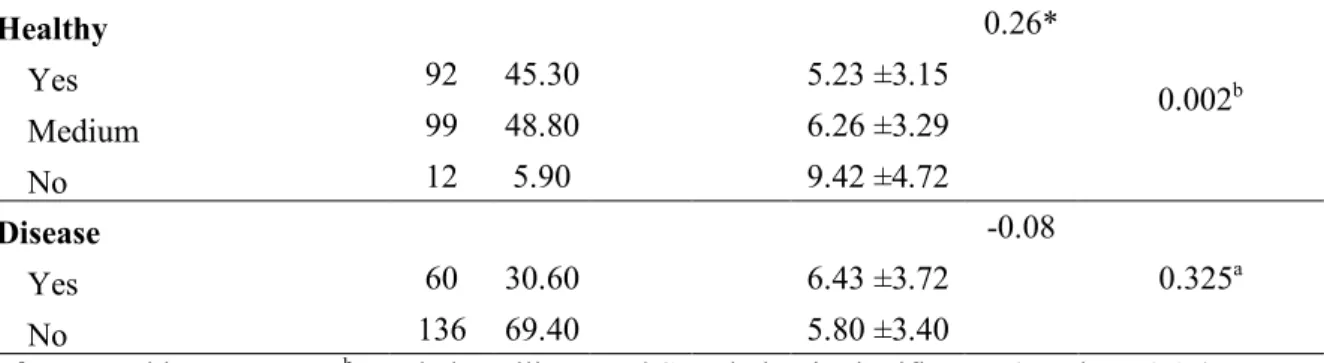
The PSQI-PT global score ranged from 0 to 18 with a mean of 5.98 (SD ±3.45). The sociodemographic characteristics are in Table 1. The distribution of the global sleep quality (GSQ) scores is the same for the categories of sociodemographic variables (Table 1), except for gender and self-assessed healthiness (“Do you consider yourself a healthy person?”). The regression analysis showed that gender (β = 0.195, t = 2.72, p = 0.004) and self-assessed healthiness (β = 0.257, t = 3.85, p < 0.001) significantly predict together a GSQ (r² =0.108, F =12.07, p <0.001). Specifically, males (M = 4.76) had significantly better average sleep quality than females (M = 6.39), and individuals who said they considered themselves healthy had significantly better sleep quality than those who did not.
Table 1. Demographic and sociodemographic characteristics and global sleep quality distribution. N % Mean SD GSQ (M ±SD) ra Distribution GSQ (P-value) Age (years) 70.05 7.15 5.98 ±3.45 -0.06 - Sex 0.20* Female 152 74.90 6.39 ±3.60 0.004a Male 52 25.10 4.76 ±2.67 Literacy -0.04 Basic scholarship 112 56.60 6.07 ±3.40 0.765b Bachelor’s degree 68 34.30 5.74 ±3.52
Master’s and PhD degrees 18 9.10 5.78 ±3.42
Household -0.07 0.172a Live alone 66 32.50 6.36 ±3.39 Live together 137 67.50 5.80 ±3.48 Religion 0.03 0.631a Yes 116 58.60 5.87 ±3.33 No 82 41.4 6.13 ±3.56 Sport -0.02 0.641a Yes 141 70.90 6.05 ±3.42 No 58 29.10 5.83 ±3.47
Healthy 0.26* 0.002b Yes 92 45.30 5.23 ±3.15 Medium 99 48.80 6.26 ±3.29 No 12 5.90 9.42 ±4.72 Disease -0.08 0.325a Yes 60 30.60 6.43 ±3.72 No 136 69.40 5.80 ±3.40
aMann-Whitney U Test; bKruskal-Wallis Test; *Correlation is significance (p-value <0.05)
The PSQI-PT component descriptive statistics and the correlations between components are shown in Table 2. Each of the scores ranged from 0 to 3. The lowest inter-component correlation was between “use of sleep medications” and “habitual sleep efficiency” (r = 0.12) and the highest correlation was between “habitual sleep efficiency” and “sleep duration” (r = 0.52).
Using a recommended cut-off score of 5 (Buysse et al., 1989), 48.5% of participants were categorized as having a good sleep quality. Component-total correlations for all components ranged from 0.32-0.55, except for “use of sleeping medication,” which was 0.24. The Cronbach’s α for global sleep quality was 0.69, but increased to 0.70 if the “use of sleep medication” component was deleted from the reliability analysis; this indicates an adequate level of internal consistency (Schmitt, 1996).
Table 2. Pittsburgh Sleep Quality Index Component Correlations and Descriptive Statistics
1 2 3 4 5 6 7
1. Subjective sleep quality -
2. Sleep latency 0.45 -
3. Sleep duration 0.35 0.32 -
4. Habitual sleep efficiency 0.28 0.42 0.52 -
5. Sleep disturbances 0.22 0.32 0.13 0.12 -
6. Use of sleep medication 0.20 0.14 0.17 0.12 0.17 -
7. Daytime dysfunction 0.19 0.27 0.15 0.14 0.35 0.17 - Mean 0.91 1.11 0.82 0.61 1.24 0.35 0.95
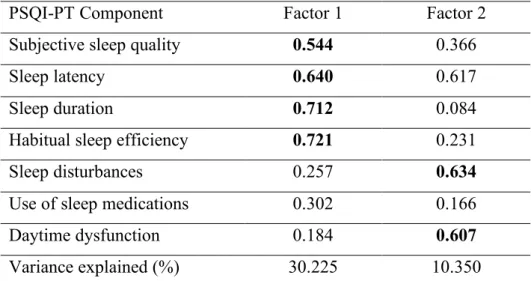
KMO (0.731) and Bartlett (chi-square=142.922; df=21; p<0.001) tests were performed and the results verified that factor analysis is suitable (Maroco, 2003) for this sample. Exploratory factor analysis (EFA) revealed (see Table 3) two components that loaded highly on factor 2 (but not on factor 1, i.e. “sleep disturbances” and “daytime dysfunction”), a result that was not consistent with Cole et al. (2006). The model properties verified good indices (chi-square=8.649; df=8; p=0.373), and there was a medium-sized effect (Cohen, 1988) for the correlation between the two factors (r=0.36). The use of sleep medication component did not load highly on either factor (0.302).
Table 3. Exploratory factor analysis* for PSQI-PT
PSQI-PT Component Factor 1 Factor 2
Subjective sleep quality 0.544 0.366
Sleep latency 0.640 0.617
Sleep duration 0.712 0.084
Habitual sleep efficiency 0.721 0.231
Sleep disturbances 0.257 0.634
Use of sleep medications 0.302 0.166
Daytime dysfunction 0.184 0.607
Variance explained (%) 30.225 10.350
*Maximum likelihood estimate extraction method and direct oblimin rotation. Bold values indicate that the component has adequate factor loadings on the respective factor. Interfactor correlation = 0.360
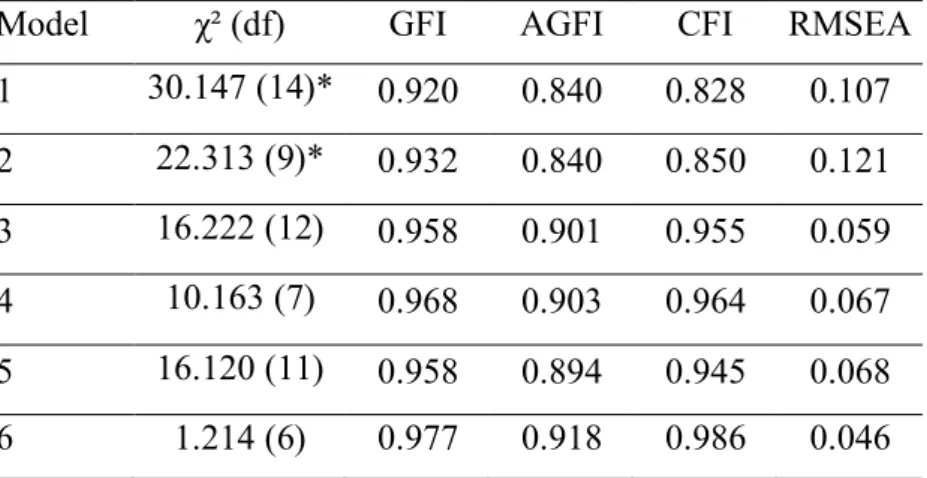
Confirmatory factor analysis (CFA) was performed on the single factor, two factor, and three factor models. The model fit statistics for each model are presented in Table 4.CFA was first performed to test the single factor scoring model suggested by Buysse et al. (Buysse et al., 1989). As shown in Table 4, the chi-square statistic was significant and the RMSEA value was high (0.107), which indicated a poor model fit. The standardized path coefficients for some components showed adequate loadings (0.51 to 0.67), except for sleep disturbances (0.33), the use of sleep medication (0.21), and daytime dysfunction (0.39), which had a lower coefficients. Next, the single factor model was tested again with the use of sleep medication component removed to examine whether this improved the model fit (model 2). As shown in Table 3, this had little effect, as the χ² statistic and RMSEA value still indicated a poor fitting model.
Table 4. Goodness of fit indices for each model
Model χ² (df) GFI AGFI CFI RMSEA
1 30.147 (14)* 0.920 0.840 0.828 0.107 2 22.313 (9)* 0.932 0.840 0.850 0.121 3 16.222 (12) 0.958 0.901 0.955 0.059 4 10.163 (7) 0.968 0.903 0.964 0.067 5 16.120 (11) 0.958 0.894 0.945 0.068 6 1.214 (6) 0.977 0.918 0.986 0.046
*p<0.05. Model 1, the single factor model (Buysse et al., 1989);
model 2, the single factor model without the use of sleep
medication component; model 3, the two factor model from the EFA; model 4, the two factor model from the EFA without the use of sleep medication component; model 5, the three factor model (Cole et al., 2006); model 6, the three factor model (Cole et al., 2006) without the use of sleep medication component.
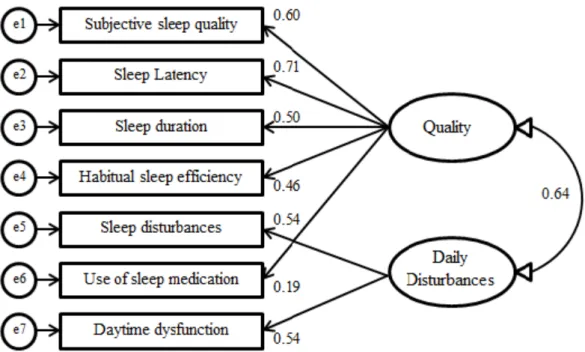
The two factor model identified through the EFA (model 3) was then tested. As shown in Table 4, the GFI, AGFI and CFI values were slightly lower than expected (≥0.97), which indicated a moderate adjustment (i.e. the other indices were good). The standardized path coefficients were all appropriate (0.46 to 0.71), with the exception of the use of sleep medication component which was much lower (0.19) (See Figure 1). The two factor model was tested again without the use of sleep medication component (model 4), but that did not lead an improvement in the model fit indices (See Table 4).
Figure 1. Factor loadings for the two factor model from the EFA (model 3).
The three factor model proposed by Cole et al. (2006) was then tested (model 5). The GFI, AGFI and CFI values were slightly lower than expected (≥0.97), which indicated a model moderate adjustment (i.e. the other indices were good). The standardized path coefficients were all appropriate (0.53 to 0.77), with the exception of the use of sleep medication component which was much lower (0.18) (See Figure 2). The three factor model was tested again without the use of sleep medication component (model 6), and all of the model fit indices were appropriate, indicating a good fitting model (See Table 4). The standardized path coefficients were all appropriate (0.52 to 0.76) (See Figure 3).
Figure 2. Factor loadings for the three factor model (model 5).
Figure 3. Factor loadings for three factor model without the use of sleep medication component (model 6).
4. Discussion
The present study examined the factor structure of the PSQI in a sample of older Portuguese adults using a cross-validation approach. Consistent with findings reported by Mollayeva et al. (2016), the current study found that the single-factor model is not the optimal factor structure for the PSQI. However, one must understand that the original scale author chooses to use the global PSQI score because it demonstrated acceptable
internal consistency in diverse populations and clinical settings, and correlations sufficiently representing each area of sleep quality. Thus, Buysse et al. (Buysse et al., 1989) were able to generalize the measure of sleep quality for different contexts. However, this does not occur homogeneously if was considered structural models with more than one factor.
The average global PSQI score is lower than that found in other investigations in non-clinical samples [6.65, 6.6] (Beaudreau et al., 2012; Bush et al., 2012), including in an older non-clinical sample [3.92, 5.1w - 4.4m] (Buysse et al., 1991; Grandner et al., 2006). The average global sleep quality score obtained in the present research is roughly equivalent to that in other non-clinical and older non-clinical samples. However, the score found in this study is closer to the general values of non-clinical samples than that found in the older non-clinical sample mentioned above; i.e., the GSQ in this research is low in relation to measurements of similar samples. But despite the overall value being higher than that found by Buysse et al. (1991) and Grandner et al. (2006), there is a similar GSQ difference between groups of men and women.
The sex differences in the GSQ values were observed in other studies (Buysse et al., 2008, 1991; Carpenter and Andrykowski, 1998; Knutson et al., 2006; Mondal et al., 2013). According to Mollayeva et. al (2016), if one considers the extensive evidence regarding biological differences between men and women in circadian clock genes, respiratory control, stress responses and the action of sex hormones on sleep mechanisms, sleep quality is likely to be influenced by sex. Therefore, it is important to characterize the existing sex differences in the GSQ in Portuguese older adults.
Another important variable to consider is "Healthy", i.e. the answers to the question: "Do you consider yourself a healthy person?". This issue is about the self-assessed healthiness. The answers to this question were significantly related to GSQ. Specifically, the worse their health perception is, the worse the perception of sleep quality.
The internal consistency (Cronbach's α) for the PSQI was 0.69, similar to values found in other studies with non-clinical samples (Babson et al., 2012; Magee et al., 2008; Spira et al., 2012) and clinical samples (Mariman et al., 2012; Rener-Sitar et al., 2014). Although the Cronbach's α we found was less than 0.70, the minimum value considered reliable for a scale (Schmitt, 1996), other studies have shown that when the “use of sleep medications” component was excluded, Cronbach's α was improved (Babson et al., 2012; Magee et al., 2008; Nicassio et al., 2014; Rener-Sitar et al., 2014; Skouteris et al., 2009;
Spira et al., 2012). When we deleted the “use of sleep medication” component, we achieved an adequate Cronbach’s α of 0.70. As a consequence, we tested each model again with the use of sleep medication component removed, and this improved the model fit statistics.
The heterogeneity of models is expected between and within the different sample groups considered in each study (Mollayeva et al., 2016). The two-factor model found in the present study using EFA identified two distinct factors in sleep quality within the PSQI-PT, which were labeled “Quality” and “Daily disturbances”. As expected, this model does not correspond to the results of previous investigations. The reason is that the prevalence of sleep dysfunction and its main attributes varies between and within clinical and nonclinical samples, and what constitutes a good cut score is not a stable value (Mollayeva et al., 2016), causing the model to change for different sample groups.
The finding indicated that the best choose adapted model for this population is six, without "use of sleep medication" component. It should be noted that only 9.8% of our sample reported regular use of sleep medications (scores 2 and 3 in this question), which is not consistent with other studies with older adults. Therefore, the findings also indicated that the use of sleep medication component had consistently low factor loadings in both the EFA and the CFA.
Nevertheless, these findings potentially indicate that this component is not a meaningful measure of sleep quality in Portuguese older adults, where the use of sleep medication is low. However, this may be a false non-use of medication. Data from Saúde (2016) demonstrate that the Portuguese population has shown high consumption of tranquilizers and antidepressants; the latter has also shown an increase since 2011. Also, a recent epidemiological study confirmed the high consumption of psychotropic drugs in the Portuguese population, in which almost a quarter of women and one-tenth of men report use of anxiolytic drugs last year (Almeida et al., 2013). This suggests the possibility that the use of medications typically employed to improve the ability to sleep may be camouflaged by the use of other medications that do not necessarily have direct application for sleep complaints, but for others such as stress and anxiety. Thus, the patient may complain about other symptoms that do not involve sleep, and use medications to control these symptoms that have effect on sleep. Having a good perception of sleep quality about psychotropic drugs effect.
Therefore, because there is no information regarding the use of psychotropic drugs for these participants, we are limited to explain of the low score for "use of sleep
medications”. However, one cannot ignore the current data on the use of psychotropic drugs by the Portuguese (this includes the older adults), and the information obtained by the component "use of sleep medications". Given that reliability was best with that component excluded, and best model fit for the GSQ was also with this component excluded, we suggest that the information obtained about use of sleep medications is best used as a supplement to understanding the health status of the participants. The model shown in Figure 3 (Model 6), the three factor model with the use of sleep medications component excluded, is the best-fitting one, and a three factor model is also the most consistent with what other studies of older adults have found.
Importantly, this study presents a major limitation in that we did not obtain specific data on health, or the use of psychotropic or other medications. We suggest, therefore, that those who use this model to evaluate sleep quality in older Portugese adults take care to obtain this information. With this information you can have the most real possible scenario to reality, to join the information "drug use" for a reliable qualitative and comprehensive analysis of this model.
5. Conclusion
This research it is proposed the adaptation of 3-factor model for the PSQI in Portuguese older adults. The Cronbach’s α was improved without “use of sleep medications” component. Therefore, the adaptation of the model is similar to the original model proposed by Cole et al. (2006), with the only change being to use the component "use of medications to sleep" as a complementary qualitative assessment of health rather than including it in the model. This will allow a more specific evaluation of the quality of older adults’ sleep in Portuguese scientific research.
Acknowledgements
This study was supported by the Foundation for Science and Technology – Portugal (CIEO – Research Centre for Spatial and Organizational Dynamics, University of Algarve, Portugal). N. B. Becker received a doctoral fellowship from the Coordenação de Aperfeiçoamento de Pessoal de Nível Superior (CAPES). Process BEX 1990/15-2.
References
Gago, J., Talina, M., Silva, J., 2013. Estudo Epidemiológico Nacional de Saúde Mental - 1.o Relatório.
Babson, K.A., Blonigen, D.M., Boden, M.T., Drescher, K.D., Bonn-Miller, M.O., 2012. Sleep Quality Among U.S. Military Veterans With PTSD: A Factor Analysis and Structural Model of Symptoms. J. trauma. stress 25, 665–674.
doi:10.1002/jts.21757
Beaudreau, S.A., Spira, A.P., Stewart, A., Kezirian, E.J., Lui, L.-Y., Ensrud, K.,
Redline, S., Ancoli-Israel, S., Stone, K.L., 2012. Validation of the Pittsburgh Sleep Quality Index and the Epworth Sleepiness Scale in older black and white women. Sleep Med. 13, 36–42. doi:10.1016/j.sleep.2011.04.005
Beusterien, K.M., Rogers, A.E., Walsleben, J.A., Emsellem, H.A., Reblando, J.A., Wang, L., Goswami, M., Steinwald, B., 1999. Health-related quality of life effects of modafinil for treatment of narcolepsy. Sleep 22, 757–65.
Bush, A.L., Armento, M.E.A., Weiss, B.J., Rhoades, H.M., Novy, D.M., Wilson, N.L., Kunik, M.E., Stanley, M.A., 2012. The Pittsburgh Sleep Quality Index in older primary care patients with generalized anxiety disorder: psychometrics and outcomes following cognitive behavioral therapy. Psychiatry Res. 199, 24–30. doi:10.1016/j.psychres.2012.03.045
Buysse, D.J., Hall, M.L., Strollo, P.J., Kamarck, T.W., Owens, J., Lee, L., Reis, S.E., Matthews, K.A., 2008. Relationships between the Pittsburgh Sleep Quality Index (PSQI), Epworth Sleepiness Scale (ESS), and clinical/polysomnographic measures in a community sample. J. Clin. Sleep Med. 4, 563–571.
Buysse, D.J., Reynolds, C.F., Monk, T.H., Hoch, C.C., Yeager, A.L., Kupfer, D.J., 1991. Quantification of subjective sleep quality in healthy elderly men and women using the Pittsburgh Sleep Quality Index (PSQI). Sleep 14, 331–8.
Buysse, D.J., Reynolds, C.F., Monk, T.H., Berman, S.R., Kupfer, D.J., 1989. The Pittsburgh Sleep Quality Index: a new instrument for psychiatric pratice research. Psychiatry Res. 28, 193–213. doi:10.1016/0165-1781(89)90047-4
Carpenter, J.S., Andrykowski, M.A., 1998. Psychometric evaluation of the Pittsburgh Sleep Quality Index. J. Psychosom. Res. 45, 5–13.
Cohen, J., 1988. Statistical power analysis for the behavioral sciences, 2nd ed. Lawrence Erlbaum, NJ.
Cole, J.C., Motivala, S.J., Buysse, D.J., Oxman, M.N., Levin, M.J., Irwin, M.R., 2006. Validation of a 3-factor scoring model for the Pittsburgh sleep quality index in
older adults. Sleep 29, 112–116.
Foley, D.J., Monjan, A.A., Brown, S.L., Simonsick, E.M., Wallace, R.B., Blazer, D.G., 1995. Sleep complaints among elderly persons: an epidemiologic study of three communities. Sleep 18, 425–32.
Foley, D.J., Monjan, A., Simonsick, E.M., Wallace, R.B., Blazer, D.G., 1999. Incidence and remission of insomnia among elderly adults: an epidemiologic study of 6,800 persons over three years. Sleep 22 Suppl 2, S366-72.
Gottlieb, D.J., Punjabi, N.M., Newman, A.B., Resnick, H.E., Redline, S., Baldwin, C.M., Nieto, F.J., 2005. Association of sleep time with diabetes mellitus and impaired glucose tolerance. Arch. Intern. Med. 165, 863–7.
doi:10.1001/archinte.165.8.863
Grandner, M.A., Kripke, D.F., Yoon, I.-Y., Youngstedt, S.D., 2006. Criterion validity of the Pittsburgh Sleep Quality Index: Investigation in a non-clinical sample. Sleep Biol. Rhythms 4, 129–139. doi:10.1111/j.1479-8425.2006.00207.x
Gümüştekín, K., Seven, B., Karabulut, N., Aktaş, O., Gürsan, N., Aslan, S., Keleş, M., Varoglu, E., Dane, S., 2004. Effects of sleep deprivation, nicotine, and selenium on wound healing in rats. Int. J. Neurosci. 114, 1433–42.
Hair Jr., J.F., Black, W.C., Babin, B.J., Anderson, R.E., 2010. Multivariate Data
Analysis: A Global Perspective, 7th ed. Pearson Prentice Hall, Upper Saddle River, NJ.
João, K.A.D.R., Becker, N.B., Jesus, S.N., Martins, R.I.S., 2017. Validation of the Portugal version of the Pittsburgh Sleep Quality Index. Psychiatry Res. 247, 225– 229.
Knutson, K.L., Rathouz, P.J., Yan, L.L., Liu, K., Lauderdale, D.S., 2006. Stability of the Pittsburgh Sleep Quality Index and the Epworth Sleepiness Questionnaires over 1 year in early middle-aged adults: the CARDIA study. Sleep 29, 1503–6. Magee, C.A., Caputi, P., Iverson, D.C., Huang, X.-F., 2008. An investigation of the
dimensionality of the Pittsburgh Sleep Quality Index in Australian adults. Sleep Biol. Rhythms 6, 222–227. doi:10.1111/j.1479-8425.2008.00371.x
Mariman, A., Vogelaers, D., Hanoulle, I., Delesie, L., Tobback, E., Pevernagie, D., 2012. Validation of the three-factor model of the PSQI in a large sample of chronic fatigue syndrome (CFS) patients. J. Psychosom. Res. 72, 111–3.
doi:10.1016/j.jpsychores.2011.11.004
Lisboa.
Mollayeva, T., Thurairajah, P., Burton, K., Mollayeva, S., Shapiro, C.M., Colantonio, A., 2016. The Pittsburgh sleep quality index as a screening tool for sleep
dysfunction in clinical and non-clinical samples: A systematic review and meta-analysis. Sleep Med. Rev. 25, 52–73. doi:10.1016/j.smrv.2015.01.009
Mondal, P., Gjevre, J.A., Taylor-Gjevre, R.M., Lim, H.J., 2013. Relationship between the Pittsburgh Sleep Quality Index and the Epworth Sleepiness Scale in a sleep laboratory referral population. Nat. Sci. Sleep 5, 15–21. doi:10.2147/NSS.S40608 Neikrug, A.B., Ancoli-Israel, S., 2010. Sleep disorders in the older adult - A
mini-review. Gerontology 56, 181–189. doi:10.1159/000236900
Nicassio, P.M., Ormseth, S.R., Custodio, M.K., Olmstead, R., Weisman, M.H., Irwin, M.R., 2014. Confirmatory factor analysis of the Pittsburgh Sleep Quality Index in rheumatoid arthritis patients. Behav. Sleep Med. 12, 1–12.
doi:10.1080/15402002.2012.720315
Rener-Sitar, K., John, M.T., Bandyopadhyay, D., Howell, M.J., Schiffman, E.L., 2014. Exploration of dimensionality and psychometric properties of the Pittsburgh Sleep Quality Index in cases with temporomandibular disorders. Health Qual. Life Outcomes 12, 10. doi:10.1186/1477-7525-12-10
SAÚDE, D.G. DE, 2016. Saúde Mental em Números -2015. Direção Geral da Saúde. Schafer, J.L., Graham, J.W., 2002. Missing data: our view of the state of the art.
Psychol. Methods 7, 147–77.
Schmitt, N., 1996. Uses and abuses of coefficient alpha. Psychol. Assess. 8, 350–353. doi:10.1037/1040-3590.8.4.350
Skouteris, H., Wertheim, E.H., Germano, C., Paxton, S.J., Milgrom, J., 2009. Assessing sleep during pregnancy: a study across two time points examining the Pittsburgh Sleep Quality Index and associations with depressive symptoms. Womens. Health Issues 19, 45–51. doi:10.1016/j.whi.2008.10.004
Spira, A.P., Beaudreau, S.A., Stone, K.L., Kezirian, E.J., Lui, L.-Y., Redline, S., Ancoli-Israel, S., Ensrud, K., Stewart, A., 2012. Reliability and validity of the Pittsburgh Sleep Quality Index and the Epworth Sleepiness Scale in older men. J. Gerontol. A. Biol. Sci. Med. Sci. 67, 433–9. doi:10.1093/gerona/glr172
Taheri, S., Lin, L., Austin, D., Young, T., Mignot, E., 2004. Short sleep duration is associated with reduced leptin, elevated ghrelin, and increased body mass index. PLoS Med. 1, e62. doi:10.1371/journal.pmed.0010062
Vitiello, M. V, Moe, K.E., Prinz, P.N., 2002. Sleep complaints cosegregate with illness in older adults: clinical research informed by and informing epidemiological studies of sleep. J. Psychosom. Res. 53, 555–9.
Wade, A., Zisapel, N., Lemoine, P., 2008. Prolonged-release melatonin for the treatment of insomnia: targeting quality of sleep and morning alertness. [Miscellaneous Article]. Aging health 4, 11–21. doi:10.2217/1745509X.4.1.11 WASM, 2016. World Association of Sleep Medicine [WWW Document]. Press release.
URL http://worldsleepday.org/press-releases
Zammit, G.K., Weiner, J., Damato, N., Sillup, G.P., McMillan, C.A., 1999. Quality of life in people with insomnia. Sleep 22 Suppl 2, S379-85.