Márcio Filipe Caetano Mateus
Licenciado em Ciências da Engenharia Electrotécnica e de Computadores
Measuring Data Transfer in Heterogeneous IoT
Environments
Dissertação para obtenção do Grau de Mestre em Engenharia Electrotécnica e de Computadores
Orientadores : Adolfo Sanchez Steiger Garção, Professor Catedrático, FCT-UNL
Pedro Miguel Negrão Maló, Professor Assistente, FCT-UNL
Júri:
Presidente: Doutor Rodolfo Alexandre Duarte Oliveira - FCT/UNL
Arguente: Doutor Manuel Martins Barata - ISEL/IPL
Vogais: Doutor Adolfo Sanchez Steiger Garção - FCT/UNL
Mestre Pedro Miguel Negrão Maló - FCT/UNL
iii
Measuring Data Transfer in Heterogeneous IoT Environments
Copyright cMárcio Filipe Caetano Mateus, Faculdade de Ciências e Tecnologia, Universidade Nova de Lisboa
A Faculdade de Ciências e Tecnologia e a Universidade Nova de Lisboa têm o direito, perpétuo e sem limites geográficos, de arquivar e publicar esta dissertação através de exemplares impressos
reproduzidos em papel ou de forma digital, ou por qualquer outro meio conhecido ou que venha
a ser inventado, e de a divulgar através de repositórios científicos e de admitir a sua cópia e distribução com objectivos educacionais ou de investigação, não comerciais, desde que seja dado
Acknowledgements
Diversas pessoas contribuíram e suportaram o desenvolvimento da dissertação. De entre estas
pessoas destacam-se:
O mestre Pedro Maló, pela oportunidade e suporte dados, bem como pelos conhecimentos partil-hados.
O mestre Bruno Almeida, pelo tempo dedicado, pelas sugestões oferecidas e pelo rigor requerido,
contribuindo para uma melhoria da qualidade do trabalho. O Tiago Teixeira pelo companheirismo, pelas sugestões que contribuíram para o desenvolvimento das ideias apresentadas, pelos momentos
de descompressão.
Todo o pessoal do Gris, nomeadamente o Henrique Baeta, Jorge Casanova, e Hugo Pereira, Raquel Melo e Edgar Silva pelo apoio e conselhos.
Todos os amigos da FCT pelos momentos de diversão que facilitaram nos momentos mais difíceis.
Os meus pais e irmã pelo suporte e apoio condicional, e à minha sobrinha pelos momentos de distracção que me ajudaram a descontrair.
Abstract
Internet of Things (IoT) is characterised by the heterogeneity of the used devices, which leads to
information exchange problems. To address these problems, the Plug’n’Interoperate approach is
used, where the steps needed to perform the information exchange between devices are described by interoperability specifications (IS) and are operated by the devices. However, more than one
IS can exist to describe the information exchange between each pair of devices, so to choose the
suitable IS, there is the need to measure the information exchange described by each one. To do this, there already exist some methods. But, they rely on a deep understanding of the IS and
the data formats involved. To overcome this, an advanced measurement method is presented.
This method advances by measuring the data transfer provided by an IS, without the need of specific knowledge about it. This measurement does that, by relying only on an abstract view of
the data transfer and providing results that allows the benchmarking of the entire interoperability
performance of the IoT environment. Thus allowing the comparison of different IS without the need of being specialized on them.
Keywords: Internet of Things, Interoperability, Measurement.
Resumo
AInternet of Things(IoT) é caracterizada pela heterogeneidade dos dispositivos utilizados, o que
pode originar a ocorrência de problemas na troca de informação. A abordagemPlug’n’Interoperate
é utilizada para lidar com estes problemas através da descrição dos passos necessários para realizar a troca de informação entre cada par de dispositivos. Estas descrições são chamadas
Interopera-bility Specifications (IS) e são manipuladas pelos dispositivos. Mais de uma IS pode existir para
descrever a troca de informação entre cada par de dispositivos. Assim, de modo a escolher a IS mais apropriada para ser utilizada, existe a necessidade de medir a troca de informação descrita
por cada IS. Existem algumas abordagens que permitem analisar IS, contudo estas precisam de um
conhecimento profundo sobre a IS e formatos de dados utilizados. Para superar estas limitações, é apresentado um método que difere por permitir a medição da troca de transferência de dados
descrita num IS sem a necessidade de a conhecer. Esta medição baseia-se numa abstracção da
transferência de dados onde são analisados os resultados da aplicação de IS, permitindo a análise da performance da interoperabilidade num ambiente IoT. Esta abordagem permite a comparação
de diferentes IS sem a necessidade as interpretar.
Palavras-chave: Internet of Things, Interoperabilidade, Medição
Acronyms
AMR Abstract Model Representation
ASF Algebraic Specific Formalism
AST Abstract Syntax Tree
ATL Atlas Transformation Language
DIT Depth of an Inheritance Tree
DTr Data Transfer ratio
GRIS Group for Research in Interoperability of Systems
ICT Information and Communication Technologies
IEEE Institute of Electrical and Electronics Engineers
ISO International Organization for Standardization
IoT Internet of Things
ITU-T International Telecommunication Union Telecommunication Standardisation Sector
NOC Number Of Children
OCL Object Constraint Language
OSI Open System Interconnection
PhD Doctor of Philosophy
PnI Plug and Interoperate
SDC Source Data Count
SDF Syntax Definition Formalism
xiv
SMC Source Model Count
TDC Target Data Count
TMC Target Model Count
TTCN Tree and Tabular Combined Notation
Contents
1 Introduction 1
1.1 Motivating Scenario: Plug and Play Interoperability . . . 1
1.2 Problem: Measure Data Exchange . . . 4
1.3 Work Methodology . . . 5
1.4 Dissertation Outline . . . 7
2 State of the Art 9 2.1 State of the Art Review . . . 9
2.1.1 Individual Analysis of Measurement Approaches . . . 10
2.1.2 Synthesis . . . 15
2.2 Advancement . . . 18
3 Data Transfer Measurement 19 3.1 Concept . . . 19
3.2 Method . . . 20
3.3 Specification . . . 25
3.3.1 Model Walker . . . 26
3.3.2 Transformation Analyser . . . 27
3.3.3 Table Counter . . . 31
3.3.4 Evaluator . . . 33
xvi CONTENTS
4 Testing and Validation 35
4.1 Testing Methodology . . . 35
4.2 Test Definition . . . 37
4.3 Test Execution . . . 38
4.3.1 Set 1: Different interoperability specifications for a pair of models . . . . 38
4.3.2 Set 2: Variation of a source or target model . . . 40
4.3.3 Set 3: Different pairs of models . . . 42
4.4 Verdict . . . 43
5 Conclusions and Future Work 45
5.1 Future Work . . . 48
5.2 Publications . . . 48
List of Figures
1.1 An example of an Internet of Things environment . . . 2
1.2 Data exchange between two systems provided by an interoperability specification 3 1.3 Research methodology used in this thesis . . . 6
2.1 Generic model approach . . . 9
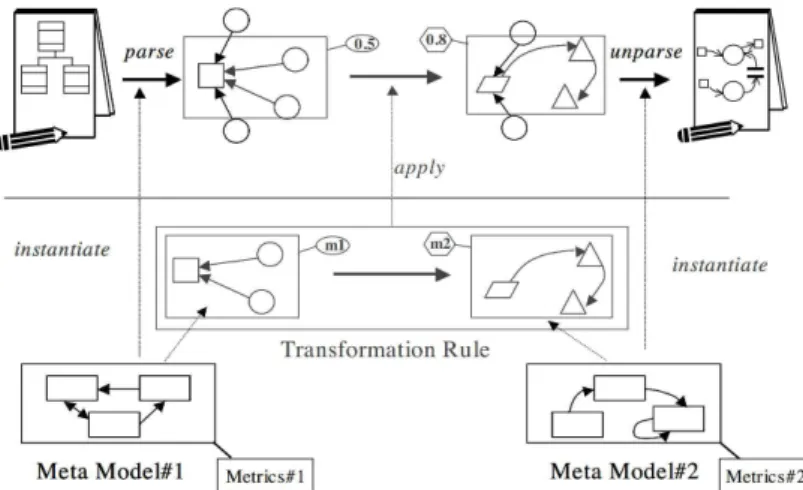
2.2 Example of a Model Transformation mapping . . . 10
2.3 Diagram of a model transformation execution . . . 10
2.4 Metrics extraction process . . . 11
2.5 Model Transformation Process . . . 13
2.6 Execution of a model transformation using the Alloy Analyzer . . . 15
3.1 Concept of the Measurement Approach . . . 20
3.2 Representation of the Measurement Method . . . 20
3.3 Measurement ruler . . . 21
3.4 Element mapping of the example . . . 24
3.5 Representation of the measurement method . . . 26
3.6 Representation of the structure of a referenced element . . . 27
3.7 Flowchart of the process of construction of an Abstract Model Representation . . 28
3.8 Diagram of the Transformation Analyser component . . . 29
3.9 Flowchart of the process of generation adata . . . 30
xviii LIST OF FIGURES
3.10 Representation of the Transformation Executor . . . 31
3.11 Flowchart of the process of counting the Source Data Count . . . 32
3.12 Flowchart of the process of counting the Target Data Count . . . 33
3.13 Complete diagram of the Measurement Method . . . 34
4.1 Testing process . . . 36
4.2 Variation of the Source and Target Data Counts . . . 39
4.3 Variation of the Target Model Count and Target Data Count . . . 41
4.4 Variation of the Source Model Count and Source Data Count . . . 41
4.5 Variation of the Source Model Count and Target Model Count with with optimal source and target coverages . . . 42
List of Tables
2.1 Approaches synthesis . . . 17
3.1 Control table . . . 24
3.2 An example of control table . . . 25
4.1 Simplified example of a TTCN-2 based table test . . . 37
4.2 Test Case example . . . 37
4.3 Abstract test case definition for testing the Data Transfer ratio calculus . . . 38
4.4 Test execution of variation of interoperability specifications between a pair of models 39 4.5 Data Transfer ratio calculus for different source or target models . . . 40
4.6 Data Transfer ratio calculus for different pairs of models . . . 42
1
Introduction
1.1
Motivating Scenario: Plug and Play Interoperability
Internet of Things(IoT) consists in a network of objects, which can be connected to the Inter-net (CERP-IoT, 2010). The use of such interconnected objects can lead to improved situational
awareness and enhanced control in target environments via comprehensive sensing and actuation.
For instance, let us consider a food storage scenario. Food is an essential resource to all the living beings however, perishable food easily spoils if it is not stored under the appropriated conditions.
If spoiled food is ingested then it can harm the living beings health.
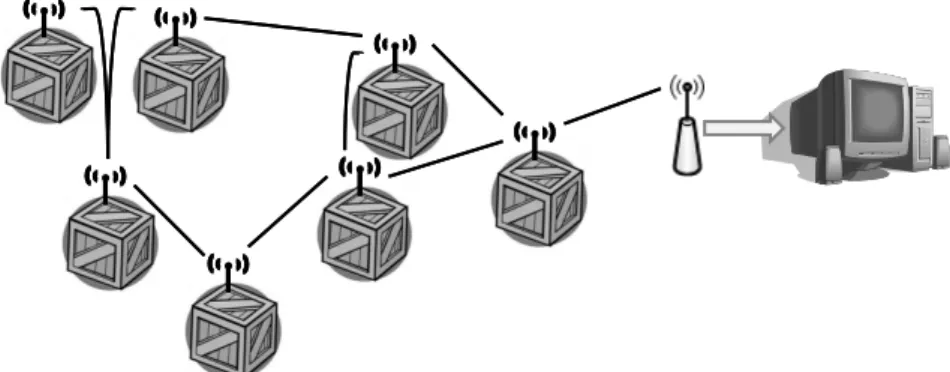
A monitoring system is needed to identify spoiled food based on the record of the conditions to which the food was subject. For that, let us consider a food scenario composed by a warehouse
and several boxes designed food storage, where each box is equipped with a sensor containing a
thermometer and a hygrometer to measure the temperature and the humidity inside the box. Each sensor senses the conditions inside its box and sends it to the warehouse’s monitoring system.
This scenario can be implemented using wireless sensor networks being each sensor a wireless
sensor, not only capable of sensing the information, but also able to inject it in the wireless sensor network, where it will hop from one wireless sensor to another until it reaches the warehouse’s
monitoring system. This scenario is illustrated in Figure 1.1. The implementation of this scenario
using wireless sensors provides some advantages as: the mobility of boxes since they need not to be connected to a fixed structure and easy configuration since only is needed the configuration of
the new box to connect it into the network because then the network will configure itself. These
advantages justify the increase of interest in wireless sensors development.
1. INTRODUCTION 1.1. Motivating Scenario: Plug and Play Interoperability
Figure 1.1:An example of an Internet of Things environment
This interest in wireless sensors development led to the production of many types of devices,
implementing several communication protocols, and designed for different application scenarios (Atzori, Iera, & Morabito, 2010). The communication between these devices can occur at several
levels such as: a)physical level which concerns with the physical connection between the
de-vices, both by cable and by air; b)data level concerned with the exchange of data between the devices. This diversity of devices can raise communication issues at all levels if no standards are
adopted. Regarding to the physical level, standards as the IEEE 802.15.4 standard were defined
and accepted (Callaway et al., 2002). However, with respect to the data level, there is still missing a standard accepted by the community which leads to the occurrence of interoperability problems.
Interoperability is defined by the IEEE as: “the ability of two (or more) systems or components to
exchange information and to use the information that has been exchanged” (IEEE, 1990). This definition implies that interoperability between systems consists in the composition of two process,
which in the data level scope have the following interpretation: 1)the exchange of information
between systems consists in the agreement of the data format used to represent the information; and 2)the use of the information exchange consists in the correct interpretation of the information
exchanged.
The definition of interoperability can be better understood through an example, for this purpose, let us return to the example shown in Figure 1.1. The first interoperability process refers the data
format chosen to support the exchange of information. Considering the information acquired by
the thermometer, the data format can be used to specify the data type used to represent the tem-perature value (e.g. integer, float or string). Without this specification a a sensor could represent
the temperature as a integer and the monitoring system could read as a string, obtaining a value
different from the value sensed. The second process corresponds to the interpretation of the infor-mation correctly exchanged. For instance, one sensor reads the temperature in Fahrenheit degrees
and the monitoring system interprets the it as a value in Celsius degrees. In this case the data value is corrected but the information interpreted is incorrect as it corresponds to a temperature value
different from the sensed.
In order to address the interoperability problems that occur in the data level, the concept of Plug’n’Interoperate (PnI) has been defined in Uninova - GRIS, research group where this work
1. INTRODUCTION 1.1. Motivating Scenario: Plug and Play Interoperability
was developed. The PnI is based on the principle that the devices used in IoT are heterogeneous.
Heterogeneous devices are devices that implements different standards and are designed for
dif-ferent purposes, which usually results in the use of difdif-ferent data formats. In order to allow the exchange of data in the system without the need to re-manufacture the devices, the manufacturers
need to provide some specification that indicates how can the data be converted from the data format used by the device to another data format. The PnI aims to the management and execution
of these specifications.
The scenario illustrated by Figure 1.1 can be used as an example of PnI. Consider that a new box enters in the warehouse that uses a specific data format. If this data format is unknown
to the data exchange system, the data of this new box cannot used by nodes in the network of
boxes or by the monitoring system. However, the existence of a specification that tells the system how to convert the data format of the new box into a data format known to the data exchange
system, allows the use of the data. Therefore this specification assumes a special relevance in the
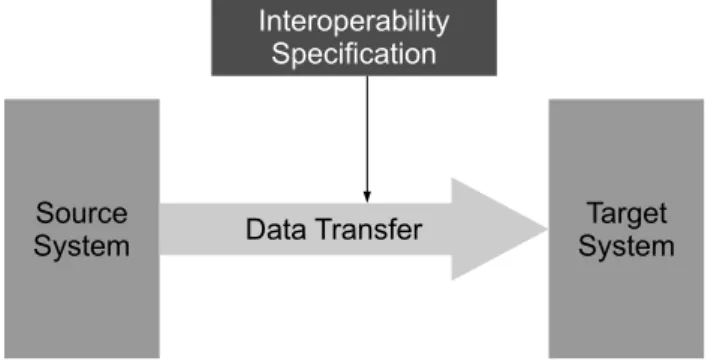
concept of PnI and are called interoperability specification. Figure 1.2 illustrates the definition of interoperability specification. In this figure is represented an data transfer between two systems.
The system that wants to send data is seen as the source system and the data receiver system is
seen as the target system. The data transfer function is defined by a interoperability specification. Interoperability specifications can also be heterogeneous as they can be defined using different
technologies/languages.
Source
System SystemTarget
Interoperability Specification
Data Transfer
Figure 1.2:Data exchange between two systems provided by an interoperability specification
The addition of new devices to a system potentially implies the increase of the number of inter-operability specifications that the system needs to manage. This fact can lead to the existence of
several interoperability specifications for the same pair of data formats, where some may provide
a better data exchange than the others. This diversity of interoperability specifications can be used to improve the interoperability potential.
The improvement of the interoperability potential within the environment can be achieved through
the maximisation of the data exchange. The improvement of interoperability potential achieves its maximum when there are, within the environment, interoperability specifications between all
known data formats, and each one of these interoperability specifications maximises the data
ex-change between the source and target data formats.
1. INTRODUCTION 1.2. Problem: Measure Data Exchange
Several options exist to improve the interoperability potential of a system, as for example: a)the
selection of the best interoperability specification, i.e. the interoperability specification that
pro-vides the best data exchange, between each pair of data formats; b)the comparison of all the interoperability specifications known by the system, regardless to the pair of data formats that
they correspond, in order to improve the most suitable interoperability specifications.
Lord Kelvin once stated that: “if one can not measure it, one can not improve it”. This conclusion can also be achieved through the analysis of the previously listed options where there is a common
need: the need to determine/measure the actual data exchange provided by an interoperability specification.
1.2
Problem: Measure Data Exchange
In IoT, or more specifically in PnI scenarios, the measurement of the data exchange requires the
establishment of relations between the concepts used by each device involved in the data ex-change, in order to identify the correspondence between concepts. However, the lack of globally
accepted standards for the definition of these concepts can hinder this approach. The
measure-ment also needs to know the steps required to perform the data exchange, which are described in an interoperability specification. However, the heterogeneity characteristic of interoperability
specifications can become an hurdle. In order to allow the improvement of data exchange within
the environment, the best interoperability specifications must be selected to be used and the more suitable to be improved must be identified. This need implies that the measurement result must be
comparable. These facts leads to the following research question:
How to measure the data exchange provided by an interoperability specifi-cation in an Internet of Things scenario?
The goal of this work is the answer to this question. To accomplish that, the characteristics of the
measurement problem in an IoT environment, namely in a PnI scenario, need to be clearly
identi-fied and studied. The characteristics are: a)the lack of semantic definitions, b)the heterogeneity of the interoperability specifications, and c)the need of generation of comparable results.
Lack of Semantic Definitions
According to the experience of the research group in relation with the devices used in IoT environ-ments, usually the manufactures of this kind of devices only provide the data formats used by the
devices, and do not specify the semantic classifications between the concepts related to sensors.
This lack of semantic definitions is mainly due to the fact that does not exist a globally accepted standard for the definition of the semantic concepts used in IoT applications(Katasonov, Kaykova,
Khriyenko, Nikitin, & Terziyan, 2008). This characteristic makes difficult the measurement of the
data exchange based on semantic relations, being preferential the use of another approach.
1. INTRODUCTION 1.3. Work Methodology
Heterogeneity of Interoperability Specifications
In order to measure the data exchange, the steps needed to perform this exchange must be assessed,
being this information described in interoperability specifications. However, as interoperability
specifications artefacts can be implemented using different technologies, which hinders the devel-opment of a general assessment of these steps using these artefacts. Therefore, a measurement
approach must be defined that overcomes the obstacle imposed by this characteristic.
Comparison between Different Pairs of Data Formats
The measurement process must produce an output able to be comparable in order to allow the draw of conclusions about the data exchange provided by several interoperability specifications. This
comparison must, not only, be performed between interoperability specifications for the same pair
of data formats, but specially between interoperability specification defined to different pairs of data formats. If no relation can be identified or established between the results of the measurement
process for different interoperability specifications, then no conclusion can be reached and
there-fore, no improvement can be performed. While the first comparison does not poses a big problem since the data formats used are the same, the second kind of comparison corresponds to a harder
task since the data formats are different, changing the measurement context. The measurement
output must allow the sorting of interoperability specifications based on the data exchange per-formed by each one. This requirement results in the need of establishing relations “higher than”,
“lower than”, and “equals to” between the outputs of the measurement approach, forcing the result
of the measurement approach to be comparable.
1.3
Work Methodology
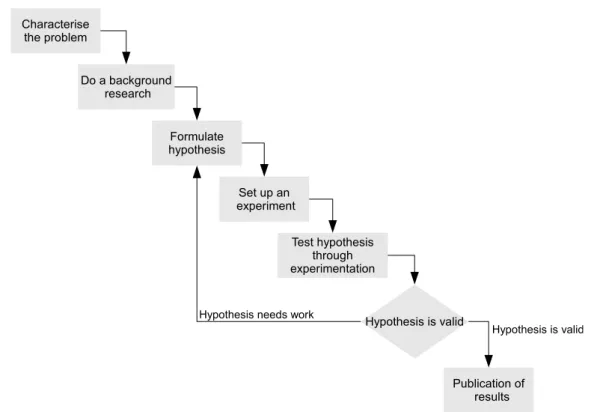
The work methodology followed by this thesis is based on the basic principles of scientific method described in (Schafersman, 1997). The used methodology is illustrated in Figure 1.3, and is
com-posed by the following seven steps:
1. Characterise the problem;
2. Do a background research;
3. Formulate hypothesis;
4. Set up an experiment;
5. Test hypothesis through experimentation;
6. Draw conclusions;
7. Publication of results.
1. INTRODUCTION 1.3. Work Methodology
Figure 1.3:Research methodology used in this thesis
1. Characterise the problem
In this step the problem is identified and characterised, through the study of the established
charac-teristics. In this step is also formulated the research question that will be the basis of the research
work. The identified problem in this work is to measure the data exchange provided by an inter-operability specification in an IoT scenario.
2. Do a Background Research
In this step is performed the study of prior work , that is related with the research question formu-lated in the first step. In this study the characteristics of the problem are taken into consideration in
order to perform the analysis of the prior work. Using this analysis is identified the contribution of
prior work for the solution of the research question as well as the advancement that this work aims to introduce. In this work is performed the study of approaches designed to measure the quality
of model transformations, since model transformations can be used to represent interoperability specifications.
3. Formulate Hypothesis
Based on the background research, it follows for a conceptual achievement that serves as the
re-search hypothesis. The hypothesis should enable a conceptual approach and define a specification in order to allow the elaboration of an experiment. In this work the hypothesis consists in a
mea-surement method the uses the number of data elements in the source and target data models, related by a mathematical expression , to perform the measurement.
1. INTRODUCTION 1.4. Dissertation Outline
4. Set up an Experiment
This step consists in the technological realisation of the hypothesis through the implementation of
the specifications defined in it. This implementation is designed to be used as a proof-of-concept, built only to test the validity of the hypothesis.
5. Test Hypothesis through Experimentation
In this step are defined the tests which the implementation of the hypothesis will be submitted to. These tests are designed in order to gather results that allow the evaluation facing the
char-acteristics of the problem. The tests are performed using the implementation. All the tests must
be executed in a controlled environment in order to control all the results of the experiment and ensures that these testing can be reproduced.
6. Draw of Conclusions
To assess the proposed solution, the results of the tests performed in the previous step are checked confirming if the hypothesis complies with the characteristics identified in the problem. If the tests
fail, back to step 3, where the hypotheses is subject to work, until there is a new hypothesis that
successfully answers the research question.
7. Publication of Results
The last step consists in the publication of the results and experience obtained in the research work.
This publication can assume the form of a final report and / or published in a scientific publication. The publication of this thesis document is included in this step.
1.4
Dissertation Outline
This dissertation is composed of five chapters, where the first is the present one:
Chapter 2 presents the background research conducted in this work. This research focuses in
the identification of approaches designed to evaluate the performance of model transformations.
Four approaches are identified and analysed, being elicited the contribution of prior research back-ground to the development of the hypothesis.
In Chapter 3 is presented the measurement method proposed to solve the problem identified in
the Introduction. In this chapter is defined the theoretical concepts associated to the measurement method and all the steps of the measurement method are specified and presented as components.
In Chapter 4, which corresponds to the Testing and Validation, is described the adopted testing
methodology and notations. Using these approaches, an abstract test is defined and tests are exe-cuted having in mind the validation of the hypothesis against the characteristics of the problematic
identified in the Introduction. After the execution of each test, the results obtained are analysed
and a verdict is drawn.
1. INTRODUCTION 1.4. Dissertation Outline
Chapter 5 corresponds to Conclusions and Future Work. In this chapter is summarised the content
of each one of the previous chapters, in order to support the drawn of conclusions about the
developed work. In this chapter the publications carried out during the thesis time are listed and future developments proposed and exposed.
2
State of the Art
2.1
State of the Art Review
An extensive research was made in order to identify technologies which use the concept of
inter-operability specification, and for each technology, approaches to measure it. In this research work four approaches were identified and all of them use model driven concepts. This fact creates the
need to perform a brief study of these concepts before the starting with the study of each one of the
identified approaches. Therefore, the concepts of metamodels, models, and model transformations are addressed, being also referred the concept of element mapping.
A model describes the characteristics of a system, in a concrete viewpoint, using a well-defined
language called modelling language which have well-defined syntax and semantics (Singh & Sood, 2009). This modelling language is in its turn defined by a higher level model called
meta-model which consists in a specification meta-model for a class of the system, making statements about
what can be expressed in the valid models of a certain modelling language (Seidewitz, 2003). A metamodel is described by a specialized language called metalanguage. This generic modelling
approach is shown in Figure 2.1.
Describes Describes
Metalanguage
Metamodel
Modelling Language
Modelling Artefact Model
Describes Describes
Figure 2.1:Generic model approach
2. STATE OF THEART 2.1. State of the Art Review
In the domain of model driven approaches model transformations are used to exchange information
between models (Sendall & Kozaczynski, 2003). Models transformations are composed by a set
of transformation rules that allows the mapping between the elements of the source models and the elements of the target models. These rules are well-defined by a model transformation language
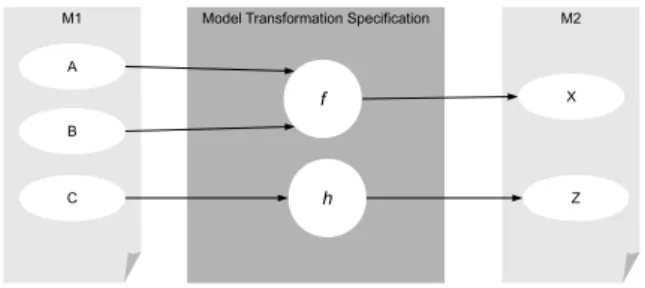
(Jouault & Kurtev, 2006; Czarnecki & Helsen, 2006). In Figure 2.2 is shown a mapping example of a model transformation where elements A and B of the source model will be represented in
element X of the target model through the execution of the transformation rule f and the data in
element C will be represented in element Z through the execution of the transformation ruleh.
Figure 2.2:Example of a Model Transformation mapping
The execution of a model transformation is performed at the data elements level, transforming
the data values in accordance to the element mapping defined. Therefore, to perform a model transformation some specific model artefacts are needed: one or more source data containing the
information to be transferred, a source model for each source data to identify the elements in
each source model, one or more target data to receive the information transferred, a target model for each target data identify the elements in each target model, a model transformation artefact
to describe the element mapping and a model transformation execution engine to execute the
information transfer function in accordance to the model transformation artefact. The organisation of these artefacts is represented in Figure 2.3.
Model Transformation Target Model
Transformation Engine Source Model
Source Data Target Data
Conforms to Conforms to
Figure 2.3:Diagram of a model transformation execution
2.1.1 Individual Analysis of Measurement Approaches
Approach 1: Measurement of Metrics of the Model Transformation
Marinus van Amstel proposes in his PhD Thesis (Amstel, 2011) an approach to assess and improve
the quality of model transformations in order to support the development and maintenance of
2. STATE OF THEART 2.1. State of the Art Review
model transformations. To achieve this objective Amstel defines seven quality attributes that can
characterise a model transformation artefact. These quality attributes are:
• Understandability refers to the effort needed to understand the purpose of a given model transformation;
• Modifiability represents the difficulty of modifying a model transformation in order to pro-vide different or additional functionality;
• Reusability expresses the ability of parts of a model transformation being reused by others model transformations
• Modularity reflects the extend in which a model transformation is systematically separated and structured, e.g. grouping rules in modules;
• Completeness expresses the degree in which a model transformation correctly transforms models conforming to its source metamodel to models conforming to its target metamodel;
• Consistency represents the uniformity used in the implementation of a model transforma-tion, namely in the programming language used;
• Conciseness refers to the quantity of superfluous element defined in a model transformation, e.g. declaration of unused variables.
In order to assess each quality attribute, quality metrics are defined. These quality metrics can vary with the technology used to implement the model transformation, however Amstel states that
conceptual similar metrics can be defined for different model transformation languages. Amstel,
in his work defines the metrics for ASF+SDF and ATL model transformations and build tools to measure these metrics.
With the objective of establish a relation between the quality metrics and the quality attributes,
sur-veys are made to experts about a set of model transformations where were classified each quality attribute for each model transformation. In this classification a number between 1 and 7 is assigned
to each quality attribute, where a higher number corresponds to a greater quality. The results
ob-tains are then compared with the quality metrics of the corresponding model transformation in order to understand which quality metrics have influence in each quality attribute.
The process of extraction of the metrics is depicted in Figure 2.4. In this process, the metrics
are obtained from the model transformation artefact through the use of a metrics extractor which produces a model that contains the metrics data. The data in this model is then presented as a
report. This report is generated by a metric processor that can perform operations over the metrics in order to present the data in a specific form.
Figure 2.4:Metrics extraction process
2. STATE OF THEART 2.1. State of the Art Review
ANALYSIS
This approach produces quality metrics and attributes. Quality metrics are dependent from the
transformation language which means that they can only be used to compare model transforma-tions described in the same transformation language and with the same purpose. On the other hand,
quality attributes can be used to compare any model transformation as quality attributes are
inde-pendent of the transformation language used are expressed as a number between a well-defined range of numbers (1-7).
Despite the fact that this approach is designed to assess and improve the quality of model
trans-formations, it presents the quality attribute Completeness that can be associated with the data exchange. However, as this approach performs the measurement using only parameters of the
model transformation artefact, there is no guarantee that all the data within the models is handled by the model transformation.
Another issue arises by the use of parameters of the model transformation artefact to perform
the measurement is that this operation requires a deep understanding of the technology in which the model transformation is described. As model transformations can be described using different
transformation languages, with this approach, there is the need to choose the more suitable metrics
and to produce a metrics extractor for each transformation language since the metrics supported can differ from transformation language to transformation language.
Approach 2: Measurement of Metrics of the Models
Motoshi Saeki and Haruhiki Kaya propose in (Saeki & Kaiya, 2007) an approach to identify
the model transformations that can improve the quality of models. To achieve this objective the authors resort to quality metrics. They state that if the values of the metrics increase with the
execution of the transformation, then that transformation improves the model quality. As result,
the authors propose the introduction of model-specific metrics in the models since the metrics of a model transformation can be defined from the metrics of the models used in the transformation.
The model-specific metrics are introduced in the model through the extension of the metamodel.
In this extension metrics, as WMC (Weighted Methods per Class), DIT (Depth of an Inheritance Tree) and NOC (Number of Children) are defined as classes, and their calculations methods can
be defined as a constraint written in OCL, being both embedded into the metamodel.
In relation to the model transformation, it can also be modified in order to use the metrics of the source model. These metrics can be used, as example, in conditions that unable the
transforma-tion if the values of the metrics are lower than a minimum value, allowing the executransforma-tion of the
transformation only when the model has a quality higher than a certain standard. After the exe-cution of the transformation, the constraints defined in the target metamodel will be responsible
for the calculation of the values of the metrics in the target model. Comparing the metrics in the
source model with the ones in the target model is possible to calculate how much the quality was
2. STATE OF THEART 2.1. State of the Art Review
improved, or degraded. This process is illustrated in Figure 2.5.
Figure 2.5:Model Transformation Process (Saeki & Kaiya, 2007)
ANALYSIS
This approach proposes the introduction of model-centric metrics in the source, target, and model
transformation metamodels. This methodology requires the modification of the metamodels, op-tion that is not always available.
The measurement is performed through the comparison between the metrics in the source model
and the target model which makes the measurement methodology independent of the transforma-tion language used.
Regarding to the result of the measurement, this approach does not propose any specific result and
therefore does not allow the draw of a conclusion about the comparability of the results.
Approach 3: Model Transformations Verification using Assertions
In (Asztalos, Lengyel, & Levendovszky, 2010) is proposed an approach focused in the verification of model transformations, which consists in proving some functional and non-functional properties
of model transformations, as well as properties of the models used in the transformation. The
goal of the authors is to provide an automated verification framework to formally analyse model transformations.
The approach proposed is strongly based in the use of assertions. An assertion consists in a formal
expression that can be used to state properties of the models used in the transformation, properties of the transformation rules, or the modifications produced by the transformation rules. Assertions
can be classified as True or False depending if the properties respect the logic expressed in the formal expression.
Assertions are based on the first-order logic which allows to automatically generate new assertions
through the use of a reasoning system by applying several deduction rules to an initial assertion
set. The assertions are applied at several points of the control flow allowing to verify different
2. STATE OF THEART 2.1. State of the Art Review
properties of models and model transformations at different stages of the transformation and to
verify the modifications performed by the transformation rules at runtime.
ANALYSIS
This approach proposes a framework to perform the verification of properties of the artefacts used
in the transformation process, as well as the assessment of all transformation steps in execution
time. This verification is performed through the use of assertions. Assertions provide a platform independent tool to perform the verification, allowing the implementation of the framework in any
model transformation framework.
This approach resorts to a reasoning system to produce new assertions from an initial set of as-sertions and allow the manual introduction of asas-sertions in order to have a contribution from the
knowledge of experts. This feature gives flexibility to the system, however the reasoning system
has efficiency problems as it may take much time to perform the deduction of new assertions when there are many assertions and deduction rules in it.
Regarding to the results produced by this approach they are represented by boolean values since
the results depend on the proprieties verified by assertions.
Approach 4: Model Transformation Analysis using Alloy
In (Anastasakis, Bordbar, & Küster, 2007) is proposed an approach that resorts to Alloy (Jackson,
2006) to perform the formal analysis of model transformations. Alloy consists in a textual and
declarative modelling language based on first-order relational logic. Alloy uses a tool called Alloy Analyzer1which supports the automated analysis of the models defined in Alloy.
The Alloy Analyzer provides two functionalities: simulation and checking using assertions. The
simulation functionality produces a random instance conform to a model. The successful gen-eration of the instance guarantees the consistency of the model. The use of assertions enables to
define constraints about the properties of a model and are the basis to the model and transformation
verification.
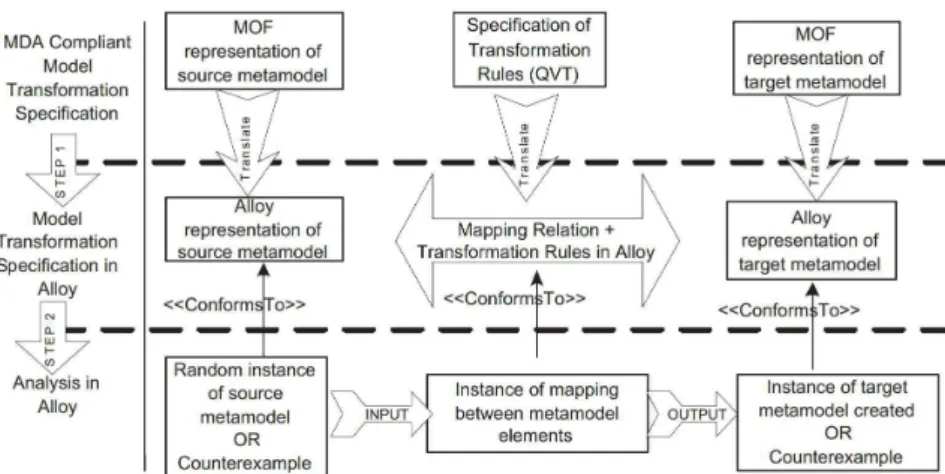
The approach proposed is composed by two steps, as depicted in Figure 2.6. The first step consists
in the representation of model-driven artefacts, both model and model transformations, using the
Alloy language, allowing to the Alloy Analyzer to use these artefacts which consists in the second step. In this step the Alloy Analyzer can be used to simulate the transformation. To perform this,
the Alloy Analyzer generates an instance of the source that conforms to the source metamodel and
an instance of the mapping between elements. The execution of the transformation generates a target model conform to the target metamodel. During the simulation process the assertions can
be used to check the properties of the source and target models.
1Available athttp://alloy.mit.edu/alloy/
2. STATE OF THEART 2.1. State of the Art Review
Figure 2.6: Execution of a model transformation using the Alloy Analyzer (Jackson, 2006)
ANALYSIS
In order to allow the measurement of the source and target metamodels need to be defined using
Alloy as the Alloy Analyzer can only interpret this language. For the same reason the transfor-mation rules of the model transfortransfor-mation must also de described using Alloy. This requirement
can become a complex task since it is necessary of perform mapping between all the modelling
languages and transformation languages the will be used to Alloy.
To perform the measurement, this approach generates the source model and the model
transfor-mation to be used in a simulation. With this methodology it is possible to verify the consistency
of the metamodels and transformations rules described in Alloy. As the instances generated are random the measurement is not associated to a specific source model.
The measurement results produced by this approach are related with the consistence of the
meta-models described in Alloy. This approach also supports the use of assertions to verify properties of the models, which produces boolean results.
2.1.2 Synthesis
Presented all the identified measurement approaches is now the time to highlight how these
ap-proaches address each one of the characteristics of the problem: Lack of Semantic Definitions,
Heterogeneity of Interoperability Specifications, Comparison between Different Pairs of Data For-mats.
Regarding to the first characteristic, Approaches 1 and 2 define metrics to be used as basis for
the measurement. Approach 1 defines specific quality attributes related with the development and maintenance of model transformations which focus in the measurement to assess structural
features of the model transformation artefact. Among these attributes there is the completeness attribute which can be used to define relations between data elements of the source and target
2. STATE OF THEART 2.1. State of the Art Review
models. Approach 2 proposes the introduction of metrics in the source, target, and model
trans-formation metamodels without specifying an application scenario, which results in the lack of
specification of the measurement level.
Approaches 3 and 4 focus in the verification of properties of the model used in the transformation,
including properties of the model transformation artefact, and in the verification of the
modifica-tions performed by each transformation rule. In both approaches, is not made a specification of which properties or modifications should be measured, and therefore the measurement level is not
defined.
In relation to the second characteristic, Approach 1 assesses the quality metrics through the ex-traction of specific parameters from the model transformation artefact, which corresponds to a
direct study of the interoperability specification. Approach 2 executes the model transformation to generate the metrics in the target model, proceeding then to the comparison between the metrics
of the source and target models. This procedure allows to measure the model transformation
with-out the need of study the model transformation artefact as the measurement can be performed by comparing the metrics before and after the transformation, which correspond to a indirect study of
the interoperability specification.
Approaches 3 and 4 can verify the properties of the models and model transformations, as well as the actions performed by the transformations rules through the use of assertions, before, after, and
during the execution of the model transformation. Approach 4 differs from Approach 3 by building
instances of the source model and the model transformation to be used in the transformation. By generating these instances, this approach verifies the consistence of the metamodels, however to
perform this verification the metamodels need to be expressed using the Alloy language which can
prove to be a complex task due to the possible heterogeneity of the metamodels. The verification of the model transformation is performed, rule by rule, in execution time, which implies the direct
manipulation and a deep understanding of the interoperability specification.
With respect to the third characteristic, Approach 1 produces quality metrics and attributes which are usually numbers. While quality metrics can only be used to compare model transformations
implemented in the same technology and for the same purpose, quality attributes can be used to
compare any model transformation since they are not technology dependent and assume values in a well-defined range of values (1-7). On the other hand, Approach 2 presents the comparison
between the metrics of the source and the target models. This approach does not specifies how
this comparison is expressed so no conclusion related with the comparability of the results can be made.
Approaches 3 and 4 produce boolean values as measurement results since assertions can only
perform verifications, returning True or False values depending if the verification is valid of not. Using these results, the only conclusion that can be achieved is if the model transformation passed
a certain verification or not. This conclusion can only be used to used to compare the number of
verifications passed by each model transformation.
2. STATE OF THEART 2.1. State of the Art Review
The most relevant conclusions of this analysis are summarised in Table 2.1.
Table 2.1:Approaches synthesis
Semantic Relations Heterogeneity of Interoperability Specifications
Comparison between Different Pairs of Data Formats
Approach 1
Defines the quality attribute completeness which can represent a relation between the data elements of the source
and target model
Uses the model transformation artefact to determine the
quality metrics
Using the quality attributes as they can only assume values in
a well-defined range of values and are independent of the technology used to define the
model transformation
Approach 2
Does not define the metrics to be used, the measurement level depends on the metrics selected
by the analyst
Performs the comparison between the metrics in the source and target models to
perform the measurement
Does not define how the results of the comparison are
expressed
Approach 3
Does not define the properties or the modifications performed
by the transformation rules to be verified
Performs the verification of each transformation rule in execution time, directly manipulating the model
transformatio
The analysis of the verifications passed by each model transformation can be used as a mean of comparison
Approach 4
Does not define the properties or the modifications to be
verified by the assertions
Requires the mapping of the transformation rules to Alloy
Uses the results of the assertions to perform
comparisons
2. STATE OF THEART 2.2. Advancement
2.2
Advancement
According to the scientific method, the construction of a solution to a question should use the knowledge from past experiences and experiments as support (Schafersman, 1997). This approach
allows the evolution of science and of the technology through the transmission of the previously acquired knowledge. Therefore, the analysis of the four measurement approaches can be used to
bring experiences and ideas that will reflect in characteristics and/or behaviours of the solution
proposed in this work. In order to determine how can each measurement approach contribute to the solution, the analysis of each approach against the characteristics of the problem, summarised
in Table 2.1, is taken into consideration resulting in the following conclusions.
Regarding to the Lack of Semantic Definitions only Approach 1 defines an attribute that can be used instead of semantic relations: the Completeness. The other approaches do not define any
metric or property to be used as support for the measurement, therefore none metric or property is
define to measure the information exchange. Thus, the concept of Completeness, namely the rela-tion between data elements will be addressed by the hypothesis, focusing the measurement in the
data exchange. However, this attribute cannot be directly assessed from the model transformation
artefact as performed by Approach 1 since it is limited by the heterogeneity of these artefacts.
Approach 2 performs the measurement through the comparison of the metrics of the source model
with the metrics of the target model, being the only one that performs the measurement without
looking onto the transformation rules defined in the model transformation. However, this approach requires the modification of the the source and target models, which is not possible in a PnI
sce-nario. Approaches 3 and 4 propose the assessment of properties of the source and target models,
but do not specify any property to be measured. However, for doing that they resort to the use of assertions whose logic can vary from model to model, being dependent from the source and target
models used, and thus not recommended. Therefore, the hypothesis will measure the data
ex-change without looking to the model transformation, nor changing the source or target models. To achieve this, the hypothesis will compare properties the source data with the target data produced
by the execution of the model transformation.
In relation to the measurement results, Approach 1 produces quality attributes, technological in-dependent, that are represented by a number within a well-defined range of values. Therefore, the
hypothesis will produce as result number within a well-defined range of values, in order to allow
to comparison of data exchanges between the same pair of models and between data exchange defined between any models.
Approach 4 presents an interesting feature as it is capable of generate an instance of the source
model to perform the simulation of the model transformation. This feature enables the execution of a generic measurement as it does not depends of a specific instance of the source model.
3
Data Transfer Measurement
3.1
Concept
The usage scenario of the measurement approach is composed by data formats and interoperability specifications, where a data format represents the data of a device and interoperability
specifica-tions provide the information on how to transfer data between the data formats. This scenario is
depicted in Figure 3.1. In this scenario there is a measurement method that uses a set of data for-mats called Source Data Forfor-mats, a set of interoperability specifications, and a set of data forfor-mats
called Target Data Formats. This measurement method performs the evaluation of each
interoper-ability specification.
The Source Data Formats corresponds to the set of data formats where, for each data format,
exists at least one interoperability specification that knows how to transfer data between that data
format and another one. On the other hand, the Target Data Formats is the set composed by all the data formats where, for each data format, there is at least one interoperability specification that
knows how to transfer the data of other data format to that data format. Notice that these two sets
can have data formats in common as well as disparate data formats. The set of interoperability specifications is composed by all the interoperability specifications with information of how to
transfer data from the data formats in the Source Data Formats set to data formats in the Target Data Formats set.
The hypothesis proposed in this work is a measurement method which aims to the classification
of each interoperability specification according to the data transfer that it provides. This
clas-sification supports the comparison between interoperability specifications. This comparison of
3. DATATRANSFERMEASUREMENT 3.2. Method
Model A
Source Data Formats Target Data Formats
Measurement Approach Interoperability Specification Specification 1 Specification 2 Specification j
Rank Interoperability Specification #1 Specification 2
#2 Specification 1 #3 Specification j
Format B Format C Format N Format A Format M Format A Format D
Figure 3.1:Concept of the Measurement Approach
classifications can be either for interoperability specifications designed for the same pair of data
formats or for all interoperability specifications in the set, disregarding the pair of data formats involved. The first comparison can be used, for example, to infer which interoperability
speci-fication provides the best data transfer between a certain pair of data formats while the second comparison can be used to determine the interoperability specification that provides the best, or
the worst, data transfer in the environment.
3.2
Method
The Measurement Method proposed in this work is illustrated in Figure 3.2. As inputs, the mea-surement method has a Source Model and a Target Model. The meamea-surement method uses the data
transfer to evaluate the mapping of elements. The data transfer is assessed by relating the coverage
of source elements with the coverage of target elements.
Source Model
Target Model
Measurement Method
Transformation Script Data Transferratio
Figure 3.2:Representation of the Measurement Method
The coverage term is understood as the relation between the number of elements defined in the
model and the number of elements used in the element mapping to produce a data, where the
termmodelcorresponds to the artefact that provides the description of the data elements and the
relations between them. A model does not represents data as it only defines the structures that
will support and represent it, i.e. corresponds the data format. The termdatacorresponds to the
3. DATATRANSFERMEASUREMENT 3.2. Method
artefact that represents data using the elements described in amodel. Therefore adatamust always
be conform to amodel.
0 1 A A B DTr
Figure 3.3:Measurement ruler
This approach leads to the need to perform the data transfer, i.e. to execute the element mapping in order to perform the measurement,
since it is required to determine the used elements. Therefore a
Trans-formation Script is needed to provide the measurement method with a reference to an executable mapping of elements to be evaluated.
The output of the measurement method must discern each element
mapping and enable the comparison based on the data transfer de-scribed in the element mapping. These requirements make Data
Transfer ratio as a suitable name for this output, as it evaluates the data transfer based on the ratio of data elements used by the element
mapping. There could be some cases where, due to semantic
de-tails, the data transfer of a mapping of elements cannot be improved even if the Data Transfer ratio has not achieve the maximum value.
Cases like this can occur because the measurement method is only
concerned with the study of the data elements, disregarding the se-mantics related to these elements.
The calculus of the Data Transfer ratio is performed in order to
clas-sify the data transfer performed by a transformation according to a ruler. This scale must allow the comparison between several Data
Transfer ratios, each one produced by different transformation scripts
with or without relations among them. The ruler defined for this pur-pose assumes values in a range between 0 and 1, as depicted in
Fig-ure 3.3.
The measurement method is based on the data elements defined in a data format, i.e. the elements defined to store data values. The
calcu-lus of the Data Transfer ratio resorts to the number of data elements
defined in the source and targetmodels, and to the number of data
elements used by the element mapping to define the data transfer. These elements are represented
in the source and targetdata. To this number of elements is assigned the termCount. Thus, the
measurement method resorts to four parameters to compute the Data Transfer ratio:
1. Source Model Count (SMC) - represents the number of data elements defined in the source
model;
2. Source Data Count (SDC) - represents the number of data elements in the sourcedatathat
are used by the element mapping;
3. Target Model Count (TMC) - represents the number of data elements defined in the target
model;
3. DATATRANSFERMEASUREMENT 3.2. Method
4. Target Data Count (TDC) - represents the number of data elements in the targetdata that
are produced by the execution of the element mapping.
As depicted in Figure 3.3, the reasoning to calculate the Data Transfer ratio (DTr) uses the concepts
of the distances represented in the to defined the Data Transfer ratio. The first distance to be defined is represented by the letter "A". This distance corresponds to how much the Data Transfer
ratio improves with the generation of one more data element in the target data. This distance
defines the step of the main scale of the ruler, corresponding to the contribution of the target data elements.
It is imposed that the contribution of the utilisation of source data elements to the Data Transfer
ratio can only be, at most, equal to the contribution resultant of the addition of one more data element to the targetdata. This imposition is made due to the consideration that the number of
data elements produced by a transformations script is more important then the number of source
elements used, based on the fact that the first ones are used by the receiver system to use the data exchanged. Therefore, the number of steps that compose the main scale of the ruler is determined
by the number of elements defined in the target model plus one that represents the maximum contribution from the usage of the source data elements. Thus distance "A" is determined through
the use of Equation 3.1.
A= 1
T MC+1 (3.1)
Other distance that needs to be defined is represented by the letter "B" in Figure 3.3. This distance
determines the improvement of the Data Transfer ratio, caused by the utilisation of the one more source element by the transformation script. This distance defines the step of the secondary scale,
corresponding to the contribution of the source data elements. This scale consists in a subdivision
of the main scale allowing an increase of the measurement resolution. Using these considerations, this distance is determined through the use of Equation 3.2.
B=A× 1
SMC (3.2)
The contribution of the number of data elements generated in the target data is represented in
Figure 3.3 by the expression "n·A". Empirically, this contribution is calculated by the multipli-cation of A by this number of elements, which is represented by the Target Data Count. Thus,
Equation 3.3 is used to calculate this contribution.
n·A=A×T DC (3.3)
The contribution of the number of elements from sourcedata, used by the transformation script ,
which is represented in Figure 3.3 by the expression "m·B", is calculated by multiplyingBby the
3. DATATRANSFERMEASUREMENT 3.2. Method
number of source elements used, i.e. using the Source Data Count. This contribution is calculated
using Equation 3.4.
m·B=SDC×B (3.4)
The output of the measurement method, the Data Transfer ratio,DTr, must be able to differentiate several transformation scripts in accordance to the data transfer performed by each one of them.
To do so, the contribution of the target data elements produced and the source data elements used
must be used, being added to each other. This reasoning leads to Equation 3.5.
DTr=n·A+m·B
=A×T DC+SDC×B , replacingB
=A×T DC+SDC×A× 1
SMC
=A×
T DC+SDC
SMC
, replacingA
= 1
T MC+1×
T DC+SDC
SMC
(3.5)
Regarding to the assessment of these parameters, the Source Model Count and the Target Model
Count have similar approaches to determine its values. While the Source Model Count is deter-mined by counting the number of the data elements defined in the sourcemodel, the Target Model
Count is determined by counting the number of the data elements defined in the targetmodel. The
Target Data Count, in its turn, is determined by counting the number of data elements present in the targetdata, generated by the execution of the transformation script. The determination of the
Source Data Count can be determined by the analysis of the artefact that describes the element
mapping. However, this approach is not an option since this artefact can be defined using different technologies, each one with different syntax and characteristics.
The approach proposed in this work to determine the Source Data Count resorts to the execution
of the transformation script multiple times in order to determine which data elements of the source dataproduce changes in the targetdatawhen changed. To execute this procedure, there is the need
to use a structure to control the execution of this loop and define the inputs used in each iteration.
To perform this control, Table 3.1 is proposed. This table is divided in two sub-tables: one to represent all the data elements of the source model (Sub-table 3.1a), and one to represent all
the data elements in the targetmodel(Sub-table 3.1b). The columns of sub-table 3.1a (I1 . . .In)
correspond to all the data elements defined in the sourcemodel. Similarly, the columns of Sub-table 3.1b (O1. . .Om) represent the data elements of the targetdata.
In Sub-table 3.1a is performed the control of the inputs, where are assigned data values to each
3. DATATRANSFERMEASUREMENT 3.2. Method
Table 3.1:Control table
(a)Source elements sub-table I1 I2 . . . In
(b)Target elements sub-table O1 O2 . . . Om
one of them. These values will be used in the generation of the multiple source datathat will
support the calculation of how many inputs are used by the transformation script to produce the targetdata. Each row corresponds to a test, i.e. to the execution of one transformation. In this
sub-table must be represented the reference test and the tests used to represent the changes in each
one of the inputs. Therefore in a table withnsource data elements there will ben+1 rows.
In Sub-table 3.1b are represented the results of each test, where the row number of the result
correspond to the test in the same row number in Sub-table 3.1a. The target data elements that are
defined in the targetmodelbut are not present in the targetdataproduced in the testing are filled with a specific character that represents this absence. The other target data elements are filled with
the data values obtained.
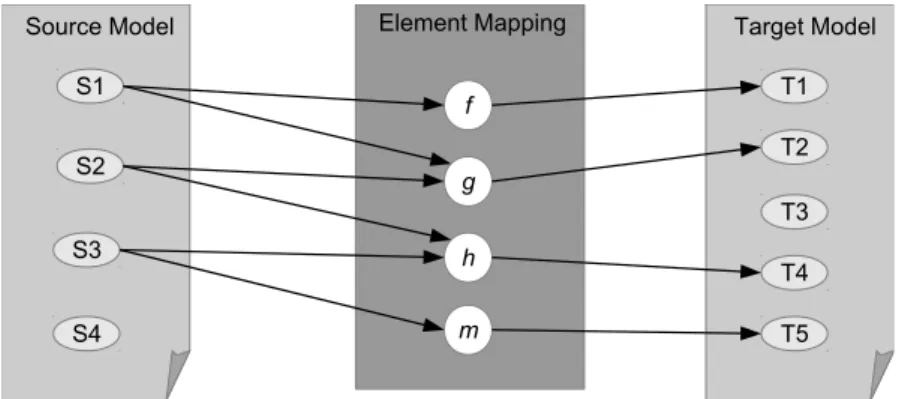
Consider the example depicted in Figure 3.4 corresponding to an element mapping. In this exam-ple, the sourcemodelhas four data elements (S1,S2,S3, andS4) and the targetmodelhas five data
elements (T1,T2,T3,T4, andT5). These data elements are mapped by transformations rules f,g,h
andm. S1 S2 S3 S4 Source Model T1 T2 T3 T5 Target Model T4 Element Mapping f g h m
Figure 3.4:Element mapping of the example
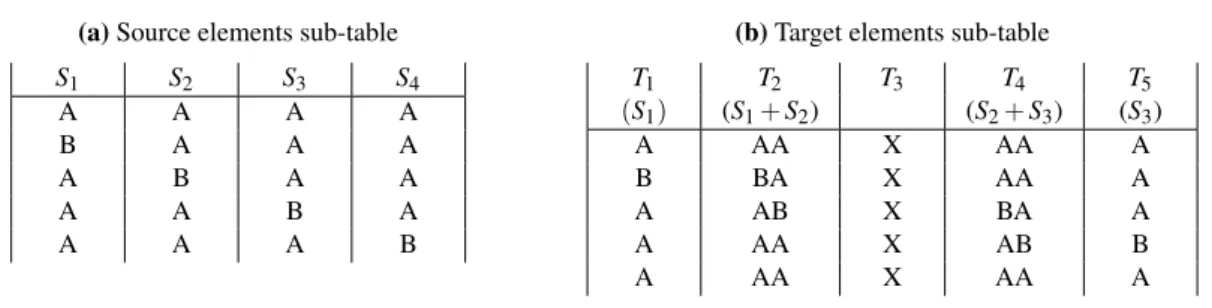
In Table 3.2 is represented the example represented in Figure 3.4. In order to simplify the example
it is considered that all the elements are strings. It is also considered that the symbol that represents
the absence of a data element in the targetdatais "X".
As the source model has four data elements, Table 3.2 has five rows. In the first row of
Sub-table 3.2a is presented the input for the reference test where, in this case, all the elements will
assume the value "A". The four next rows correspond to the testing of each one of the source elements where, for each row, is replaced the default value "A" by the value "B" in the element to
be tested. As the targetmodelhas five data elements, Sub-table 3.2b has five columns, however for
one column, corresponding to the target elementT3, never is generated a data value as it is filled
3. DATATRANSFERMEASUREMENT 3.3. Specification
Table 3.2:An example of control table
(a)Source elements sub-table S1 S2 S3 S4
A A A A
B A A A
A B A A
A A B A
A A A B
(b)Target elements sub-table
T1 T2 T3 T4 T5
(S1) (S1+S2) (S2+S3) (S3)
A AA X AA A
B BA X AA A
A AB X BA A
A AA X AB B
A AA X AA A
with the symbol "X" in all the performed tests.
Comparing both sub-tables one can verify that changes in the element S1 produce changes in
elementsT1andT2, changes inS2cause changes inT2andT4, and changes inS3produce changes
inT4andT5. Changes in elementS4do not produce any change in the targetdatawhich results in the appearance of a result equal to the result corresponding to the reference test.
The Source Model Count is determined by the number of columns in Sub-table 3.2a, therefore
SMC=4. Analogous reasoning is applied to determine the Target Model Count, which corre-sponds to the number of columns in Sub-table 3.2b, resulting inT MC=5. The Source Data
Count corresponds to the number of rows in Sub-table 3.2b different of the row corresponding to the reference test row. Thus, for this example,SDC=3. At last, the Target Data Count is
deter-mined by the number of columns in Sub-table 3.2b where, in at least one test, there was obtained
a result, soT DC=4. Applying these values in Equation 3.5 results in:
DTr= 1
5+1×
4+3
4
=0.79
3.3
Specification
The goal of the measurement method is to assign a Data Transfer ratio to the element mapping
executed by transformation script. To produce this Data Transfer ratio four parameters (the Source Model Count, the Source Data Count, the Target Model Count, and the Target Data Count) need
to be determined. These parameters are determined through the analysis of the control table. And
to produce a control table, the measurement method must know the structure of the source and the targetmodels, as well as, be able to execute the transformation script. This reasoning results in a
measurement method that consists in the composition of the following components:
Model Walker walks themodelreceived as input, identifying the elements defined in it and their hierarchy, producing a data structure that represents themodel.
Transformation Analyser performs the execution of the transformation script in order to produce the control table.
Table Counter analyses the control table produced by the Transformation Analyser component
3. DATATRANSFERMEASUREMENT 3.3. Specification
in order to determine the Source Model and Data Counts as well as the Target Model and
Data Counts.
Evaluator is responsible for the computation of the data transfer evaluation. To perform this eval-uation the Evaluator component resorts to an algorithm to produce a quantified output. The
output of this component is also the output of the measurement method (the Data Transfer ratio).
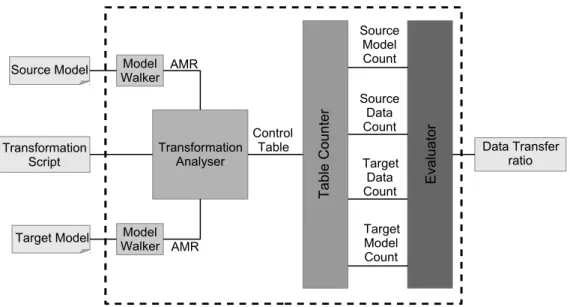
These components and the interconnection between them are depicted in Figure 3.5. Notice that
this figure can be seen as a more detailed representation of Figure 3.2.
E val ua to r Source Model Target Model Transformation Script Target Data Count Target Model Count Data Transfer ratio Source Data Count Source Model Count Model Walker Model Walker Transformation Analyser AMR AMR Ta bl e Co un te r Control Table
Figure 3.5:Representation of the measurement method
3.3.1 Model Walker
The purpose of the Model Walker component is to walk through themodelin order to identify the type and constraints associated to each element as well as the relations defined among them. To
achieve this goal the Model Walker uses an algorithm to build a data structure that represents the structure of themodel.
The data structure chosen for this task is an Abstract Syntax Tree (AST). The AST is chosen
due to its capacity to represent, in an abstract form, the structure of themodel, standing out as a flexible tool capable of representing the elements defined in a model. Nevertheless, a AST does
not provide means to handle situations of repetition of nodes which is a need that must be attended.
The algorithm to build the AST starts with the identification of each element defined in the model. For each element, the type and constraints associated with it are also identified. After the
identifi-cation of an element it is introduced into the AST.
In order to address the problem of the handling of repetitions of elements, a data structure is
defined to be used along with the AST. This structure consists in a hash table where each entry has