PROGNOSIS OF THE DIAMETER DISTRIBUTION AND CARBON STOCK IN A
SECONDARY ATLANTIC FOREST BY MARKOV CHAIN
1Paulo Henrique Villanova2*, Carlos Moreira Miquelino Eleto Torres3, Laércio Antônio Gonçalves Jacovine3, Carlos Pedro Boechat Soares3, Liniker Fernandes da Silva4, Bruno Leão Said Schettini2 and
Samuel José Silva Soares da Rocha2
1 Received on 19.09.2017 accepted for publication on 27.03.2018.
2 Universidade Federal de Viçosa, Programa de Pós-Graduação em Ciências Florestais, Viçosa, MG-Brasil. E-mail:
<paulo.villanova@ufv.br>, <bruno.schettini@ufv.br> and <samuel.rocha@ufv.br>.
3 Universidade Federal de Viçosa, Departamento de Engenharia Florestal, Viçosa, MG-Brasil. E-mail: <carlos.eleto@ufv.br>,
<jacovine@ufv.br> and <csoares@ufv.br>.
4 Universidade Federal do Rocôncavo da Bahia, Departamento de Engenharia Florestal, Cruz das Almas, BA-Brasil. E-mail:
<liniker@ufrb.edu.br>. *Corresponding author.
ABSTRACT – Growth and yield modeling at the diameter distribution level is an important tool to understand forest dynamics and to predict whether a forest will act as a CO2 emissions source or sink. Therefore, the objective of the present study was to determine the diameter distribution and carbon stock of a forest fragment using the Markov chain to evaluate the impact of growth dynamics on forest carbon capture. Twenty plots of 10x50m were inventoried, between 2010 and 2015, counting the stems with dbh > 5 cm. Diameter distribution was projected for 2015 and 2020, considering the whole fragment and the ecological groups (pioneer and non-pioneer tree species). The volume was determined using allometric equation while biomass and carbon was determined by multiplying the volume by the basic wood density and the carbon content, respectively. The diameter distribution estimated for the fragment and ecological groups did not differ statistically from the values observed using the Kolmogorov-Smirnov test (p-value < 0.05). The number of stems ha-1 estimated
in the fragment was from 1,692 in 2015 to 1,841 in 2020. For the pioneer and non-pioneer species, the number of stems ha-1 was from 476 and 1,203 in 2015 to 472 and 1,362 in 2020, respectively. The carbon
stock increased 5.69 MgC ha-1, with the greater contribution coming from the non-pioneer species. Therefore,
it was concluded that the diameter distribution would remain “J-inverted” and the forest fragment would continue to act as a carbon sink over the coming years.
Keywords: Forest dynamic; Greenhouse gases; Forest management.
PROGNOSE DA DISTRIBUIÇÃO DIAMÉTRICA E DO ESTOQUE DE
CARBONO POR CADEIA DE MARKOV EM UMA FLORESTA SECUNDÁRIA DA
MATA ATLÂNTICA
do fragmento passou de 1692, em 2015, para 1841, em 2020. Já para as espécies pioneiras e não-pioneiras,
o número de fustes ha-1 passou de 476 e 1203, em 2015, para 472 e 1362, em 2020, respectivamente. O
estoque de carbono aumentou 5,69 MgC ha-1, sendo a maior contribuição das espécies não-pioneiras. Assim, conclui-se que a distribuição diamétrica continuará como “J-invertido” e o fragmento florestal seguirá atuando como sumidouro de carbono nos próximos anos.
Palavras-Chave:Dinâmica florestal; Gases de efeito estufa; Manejo florestal.
1.INTRODUCTION
Tropical forests play a fundamental role, providing ecosystem services and maintaining plant biodiversity (Silva et al., 2016). However, these environmental functions have been severely affected in recent decades due to intense fragmentation of these areas (Scarano and Ceotto, 2015). One of the tropical forests most affected by this fragmentation was the Atlantic Forest. Currently, there is only 12.5% of its original coverage spread across forest fragments smaller than 100 ha (Fundação SOS Mata Atlântica and INPE, 2015).
Given this scenario, studies focusing on growth and yield modeling are extremely important for the biodiversity and ecosystem service maintenance of these forest fragments (Lima and Leão, 2013). Independent of its structural complexity, the aim of modelling is to allow the projection of production into the future based on current conditions (Chassot et al., 2011), with diameter distribution models, in particular the transition matrix, being the most common for tropical forests (Teixeira et al., 2007; Vasconcelos et al., 2009; Batista et al., 2016).
Markov chain is a stochastic process, which is based on the concept of state (Souza and Soares, 2013). Therefore, it is presumed that a tree located in a determined diameter class at time t has a certain probability of remaining in this class or of migrating to another at time t+ as a function of its current state (Dalla Lana et al., 2015).
Despite the transition matrix being easily applicable, it presents some limitations such as the realization of projections only in years multiple to the monitoring period and the exclusion of possible changes to the forest structure over time (Schneider and Finger, 2000). However, this tool presents good accuracy in the diameter distribution projection in tropical forests over the short term (Stepka et al., 2010; Ebling et al., 2012).
Using the projection of diameter distribution associated with the probability of transition to other
states, it is possible to identify the organizational processes that occur in forest ecosystems such as mortality, recruitment, growth and succession (Shen et al., 2013). Additionally, the projections made with the Markov chain can be useful as a tool to indicate if the forest will present as a sink or as a source of carbon dioxide for the environment in the future (Teixeira et al., 2007; Souza et al., 2014a).
Therefore, the objective of the present study is to determine the diameter distribution and carbon stock of a forest fragment using the Markov chain to evaluate the impacts of the growth dynamics on the carbon capture of the forest.
2.MATERIALS AND METHODS 2.1. Description of the study area
The forest fragment has 44.11 hectares and is located in the Technology Park, Viçosa – MG with geographic coordinates 42° 51’ W and 20° 42’ S and an average altitude of 721 m (Souza et al., 2014b). The vegetation is located in a region classified as Semideciduous Seasonal Mountainous Forest (IBGE, 2012). According to the resolution CONAMA 392, the fragment is at a medium stage of regeneration presenting tree species with an average dbh of between 10 and 20 cm, as well as a height between 5 and 12 m (Brasil, 2007).
The local climate type is Cwa, according to the Köppen classification. The average temperature, humidity and annual precipitation for the period from 1968 to 2015 was 21.9°C, 79% and 1,274 mm, respectively (UFV, 2016). The region of Viçosa has pedogeomorphological gradients in which the tops of the hills are occupied by dystrophic Latosols rich in aluminum, the colluvial ramps by thinner, cambic Latosols and the bottom of the valleys present mainly nutrient rich epieutrophic Cambisols (Ferreira Júnior et al., 2012).
(Torres et al., 2013). Regeneration of the native vegetation in the area has been underway however, for approximately 25 years.
2.2. Data collection and analysis
Twenty 10x50 m plots were inventoried in which all the stems with dbh > 5 cmcm were measured and identified botanically in 2010 and 2015. The species were classified into ecological groups according to the division proposed by Gandolfi et al. (1995) and used in other studies such as Callegaro et al. (2015), Figueiredo et al. (2013) and Figueiredo et al. (2015), in which they were presented as pioneer (P), early secondary (Si), late secondary (St) and species without classification (Sc).
In 2015, mortality, which corresponds to those stems alive on the first occasion but dead on the following occasion, and the recruitment, which correspond to those stems that reached the minimum diameter for inclusion (dbh > 5 cm) in the last measurement were determined.
To project forest growth, the transition matrix model was used, which is based on the concept of the state of the arboreal individual. The movements between states were calculated using the probability of transition:
pij = nij / ni, in which pij is the probability of transition;
nij is the number of stems in the diameter class j, at time t+; and niis the total number of stems in the diameter class i, at time t (Souza and Soares, 2013). The transition matrix was constructed based on the determination of probability of transition with diameter amplitude of 5 cm, in which the stems could assume one of the four possible states: migrate to a larger diameter class due to growth in diameter, remain in the same class in which they were found, enter into the first diameter classes or die (Vasconcelos et al., 2009).
To estimate the number of trees at time t+ for each diameter class, the chapman-Kolmogorov matrix equation: Yt+= (G*Yit) + C1, was used, in which Yt+
is the vector column for the number of trees by diameter class, at time t; and C1 is the vector column for the stems that entered during the monitoring period (Parzen, 1962).
To estimate the number of stems that entered into the first diameter class, the adjustment of the equation referent to the model: It+= e0+1*Bt + , in which It+
is the tree recruitment per hectare in time t+; 0
and 1 are the parameters of the equation to be estimated;
Bt is the base area in m2 ha-1 in tempo t; is the random error, was evaluated (Souza and Soares, 2013). The evaluation criteria for the adjustment were the coefficient of correlation between the observed and estimated values (ryy) and the significance of the parameters. These
procedures were necessary due to the limitation of the Markov chain in not projecting the stems that entered into the system.
Based on the observed data, diameter distribution projections were realized for 2015 and 2020 considering all the stems of the fragment as well as by ecological group (pioneer and non-pioneer species). In the projection by ecological group, those species without ecological classification were excluded. To test the statistical significance between the projected and observed diameter distributions, the Kolmogorov-Smirnov adherence test (K-S) was used, at a significance of 5% (Reis, 2017).
Tree volume in the 2015 and 2020 projections was
determined by the equation:
VFcc=0,000070*CC2,204301*HL0,563181*SD, in which VFcc
is the volume of stems with bark, in m3; CC is the center of the diameter class, in cm; HL is Lorey’s height in m; SD is the stems density, in stems ha-1 (Amaro, 2010). Biomass and the carbon stock were determined using the average basic wood density and the carbon content of the species, respectively. For this, three trees from each species were selected as well as by diameter class for the partial analysis of the trunk, which corresponds to the removal of a wood sample at a height of 1.30 m, with the help of increment borers (Torres et al., 2017). The material was then taken to the laboratory where part of it was used to determine the basic wood density for each species, according to the methodology described by Vital (1984) and NBR 11941 (ABNT, 2003), and the other part submitted to complete calcination in an muffle furnace to determine the carbon content, according to the methodology described by Torres et al. (2013).
3.RESULTS
The parameter 1 of the equations adjusted to estimate the number of stems that entered at a level of 5% significance was not significant for the forest fragment or for the ecological groups (Table 1). Therefore, the observed averages for recruitment was used for the monitoring period, equal to 355, 255 and 77 stems ha-1 for the forest fragment, and non-pioneer and pioneer species, respectively.
The number of stems per hectare observed in 2010 and 2015, and estimated by the Markov chain in 2015 and 2020, were determined both for the forest fragment and the ecological groups (Table 2).
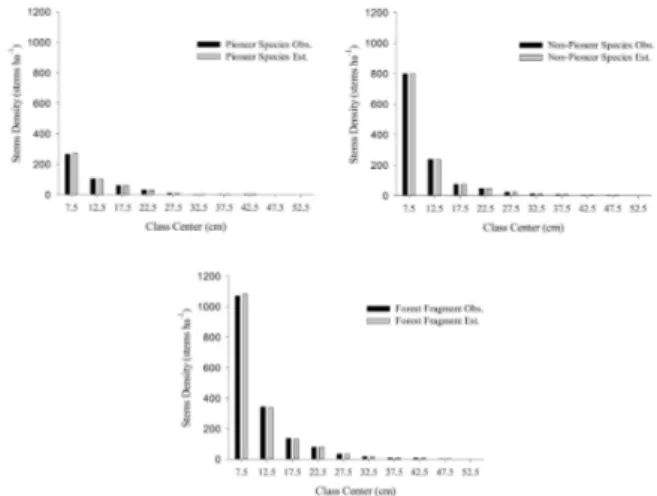
There was no statistical difference between the number of stems observed and estimated by the K-S test, at 5% probability, for 2015 (Forest Fragment:
DCalc = 0.006 < DTab = 0.033; Pioneer: DCalc = 0.015 < DTab = 0.062; Non-Pioneer: DCalc = 0.002 < DTab = 0.039) (Figure 1).
The average basic wood density and carbon content of the pioneer species was 0.517 g cm-3 and 52.3%, respectively. For the non-pioneer species, the density was 0.526 g cm-3 and the carbon content was 53.0%. Based on this data, the biomass was calculated in Mg ha-1, and the carbon stock in MgC ha-1, both for the forest fragment and the ecological groups by diameter class (Table 3).
4.DISCUSSION
The non-significance for the parameter 1 shows that there was no relation between the basal areas of the parcels and tree recruitment. Despite this, the independent variables that denote the conditions of the stand, such as the basal area, are the most recommendable to estimate the number of trees recruited in tropical forest (Rossi et al., 2007a). Therefore, the observed average for tree recruitment during the monitoring period was used as input for the transition matrix. However, it is only possible to infer how other variables, for example, the occurrence of clearings (Rossi
Table 1– Basal area (Bt), in m2 ha-1, parameters of the equation
(0 e 1) and correlation coefficient (ryy) for pioneer (P) and non-pioneer (NP) species and for the forest fragment (T).
Tabela 1– Área basal (Bt), em m2 ha-1,parâmetros da equação (0 e 1) e coeficiente de correlação (ryy ) para as espécies pioneiras (P), não pioneiras (NP) e para o fragmento florestal (T).
^ ^
* significant at the 5% level of significance
ns not significant
GE Bt 0 1 ryy
2015
P 6.03 3.952351* 0.061276ns 2.40394
NP 11.80 5.852116* -0.027648 ns 2.63039
T 18.05 6.402702* -0.033595 ns 3.01231
2020
P 6.50 3.952351* 0.061276 ns 2.40394
NP 14.06 5.852116* -0.027648 ns 2.63039
T 20.83 6.402702* -0.033595 ns 3.01231
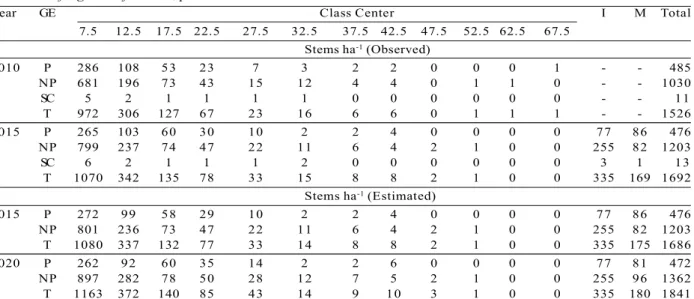
Year GE Class Center I M Total
7.5 12.5 17.5 22.5 27.5 32.5 37.5 42.5 47.5 52.5 62.5 67.5 Stems ha-1 (Observed)
2010 P 286 108 53 23 7 3 2 2 0 0 0 1 - - 485
NP 681 196 73 43 15 12 4 4 0 1 1 0 - - 1030
SC 5 2 1 1 1 1 0 0 0 0 0 0 - - 11
T 972 306 127 67 23 16 6 6 0 1 1 1 - - 1526
2015 P 265 103 60 30 10 2 2 4 0 0 0 0 77 86 476
NP 799 237 74 47 22 11 6 4 2 1 0 0 255 82 1203
SC 6 2 1 1 1 2 0 0 0 0 0 0 3 1 13
T 1070 342 135 78 33 15 8 8 2 1 0 0 335 169 1692
Stems ha-1 (Estimated)
2015 P 272 99 58 29 10 2 2 4 0 0 0 0 77 86 476
NP 801 236 73 47 22 11 6 4 2 1 0 0 255 82 1203
T 1080 337 132 77 33 14 8 8 2 1 0 0 335 175 1686
2020 P 262 92 60 35 14 2 2 6 0 0 0 0 77 81 472
NP 897 282 78 50 28 12 7 5 2 1 0 0 255 96 1362
T 1163 372 140 85 43 14 9 10 3 1 0 0 335 180 1841
In which: GE = Ecological group; P = pioneer species; NP = non-pioneer species; SC = species without classification; I = Recruitment; M = Mortality; Total = total number of stems of the fragment.
Em que: GE = Grupo Ecológico; P = Pioneiras; NP = Não Pioneiras; SC = Sem Classificação; I = Ingresso; M = Mortalidade; Total = número total de fustes do fragmento.
Table 2 – Observed and estimated numbers of stems ha-1 for the ecological groups (pioneer and non-pioneer species) and
for the forest fragment, by diameter class.
Tabela 2 – Números de fustes ha-1 observados e estimados para os grupos ecológicos (pioneiras e não pioneiras) e para o fragmento florestal, por classe diamétrica.
et al., 2007b), fires (Ribeiro et al., 2012) and pests (Trumbore et al., 2015) modify the environment and influence tree recruitment with the long term evaluation. The number of stems between the monitoring period (2010 and 2015), increased from 1,526 to 1,692. This is mainly explained by the trees recruitment (335 stems ha-1) having been greater than mortality (169 stems ha-1). Additionally, there was a significant migration of stems between the diameter classes due to the accumulation of biomass by the trees (Hanberry et al., 2016; Poorter et al., 2016).
The projected diameter distribution of the forest fragment for 2015 compared with the data observed for the same year (est.: 1,686 stems ha-1; obs.: 1,692 stems ha-1), demonstrated the adherence of the Markov chain when realizing the forest prognosis (DCalc = 0.006 < DTab = 0.033). This occurred due to the projection having been realized over a short time span (5 years)
Year GE Center Class Total
7.5 12.5 17.5 22.5 27.5 32.5 37.5 42.5 47.5 52.5 Volume (m3 ha-1)
2015 P 5.82 7.67 10.83 9.79 5.57 1.47 2.28 5.71 - - 49.13
NP 16.84 18.16 13.09 15.61 12.13 9.28 6.64 6.56 4.45 2.89 105.64 Total 22.84 26.03 24.12 25.74 18.17 11.37 8.92 12.27 4.45 2.89 156.78 2020 P 5.61 7.11 11.19 11.73 7.58 1.54 1.90 8.09 - - 54.75 NP 18.87 21.68 13.96 16.60 15.52 9.90 7.98 8.20 4.45 2.89 120.05 Total 24.59 28.75 25.57 28.57 23.71 11.76 9.96 15.66 5.93 2.89 177.38
Biomass (Mg ha-1)
2015 P 3.01 3.96 5.60 5.06 2.88 0.76 1.18 2.95 - - 25.40
NP 8.85 9.54 6.88 8.21 6.38 4.88 3.49 3.45 2.34 1.52 55.53 Total 11.95 13.62 12.62 13.47 9.50 5.95 4.66 6.42 2.33 1.51 82.02
2020 P 2.90 3.67 5.78 6.06 3.92 0.80 0.98 4.18 - - 28.30
NP 9.92 11.40 7.34 8.73 8.16 5.20 4.20 4.31 2.34 1.52 63.10 Total 12.86 15.04 13.38 14.95 12.40 6.15 5.21 8.19 3.10 1.51 92.80
Carbon (MgC ha-1)
2015 P 1.57 2.07 2.93 2.65 1.51 0.40 0.62 1.54 - - 13.28
NP 4.69 5.06 3.64 4.35 3.38 2.58 1.85 1.83 1.24 0.80 29.41 Total 6.30 7.19 6.66 7.11 5.02 3.14 2.46 3.39 1.23 0.80 43.28
2020 P 1.52 1.92 3.03 3.17 2.05 0.42 0.51 2.19 - - 14.80
NP 5.25 6.04 3.89 4.62 4.32 2.76 2.22 2.28 1.24 0.80 33.42 Total 6.79 7.94 7.06 7.89 6.55 3.25 2.75 4.32 1.64 0.80 48.97
In which: GE = Ecological group; P = pioneer species; NP = non-pioneer species; I = Recruitment; M = Mortality; Total = total number of stems of the fragment.
Em que: GE = Grupo Ecológico; P = Pioneiras; NP = Não Pioneiras; I = Ingresso; M = Mortalidade; Total = número total de fustes do fragmento.
Table 3 – Volume (m3 ha-1), biomass (Mg ha-1) and carbon stocks (MgC ha-1) for the ecological groups (pioneer and
non-pioneer species) and for the forest fragment, by diameter class.
Tabela 3 – Volume (m3 ha-1), biomassa (Mg ha-1) e estoque de carbono (MgC ha-1) para os grupos ecológicos (pioneiras e não pioneiras) e para o fragmento florestal, por classe diamétrica.
Figure 1 – Estimated and observed diametric distribution (stems ha-1) for the ecological groups (pioneer and
non-pioneer species) and for the forest fragment. Figura 1 – Distribuição diamétrica estimada e observada (fustes ha-1) para os grupos ecológicos (pioneiras e não pioneiras) e para o fragmento florestal.
in terms of tropical forest (Batista et al., 2016). Another point that contributed to the efficacy of the projection was the absence of disturbances in the fragment, given that this can affect the prognosis and generate imprecise and tendentious estimations (Xie et al., 2013). However, the absorbent state was observed in the center of the 47.5 cm class, indicating an accumulation of stems in this diameter class due to presenting a probability equal to zero for transition to the next class. However, this did not invalidate the use of the transition matrix for short periods, since it is a stationary matrix not recommended over long evaluation periods (Dalla Lana et al., 2015).
Based on the demonstration of the efficacy of the Markov chain, the diameter distribution for 2020 was projected, which could reach 1,841 stems ha-1, taking into account the recruitment of 335 stems ha-1, and a mortality of 180 stems ha-1. Therefore, due to the elevated number of young plants that will substitute the adult plants in the future, we can infer that the fragment will continue to evolve in a sustainable manner over the coming years (Batista et al., 2016).
In terms of the ecological groups, a reduction in the number of pioneer species in the forest fragment between the monitoring periods, dropping from 485 to 476 stems ha-1, was observed. For these species, mortality was greater than tree recruitment, corresponding to 86 and 77 stems ha-1, respectively. By contrast, the number of non-pioneer species increased over the years. In 2010, 1,030 stems ha-1 were counted increasing to 1,203 stems ha-1 in 2015. Tree recruitment for this species was 255 stems ha-1 while mortality was 82 stems ha-1. This predominance of non-pioneer species in the forest fragment mainly occurred due to the successional advance (Souza et al., 2012). Therefore, it is presumed that there is a reduction of luminosity due to the tree canopy, which suppressed shade intolerant species and benefited recruitment of ombrophil species (Chazdon, 2012). In addition to this abiotic condition, factors such as the existence of a source of propagules and dispersers near to the forest may have favored the substitution of the species throughout the natural succession process (Shono et al., 2007; Chazdon, 2012; Ferreira et al., 2012). Just as with the forest fragment as a whole, the Markov chain was able to satisfactorily project the diameter distribution when divided into ecological groups. For the pioneer species, the number of estimated and
observed stems per hectare for 2015 was 476 (DCalc = 0.015 < DTab = 0.062). For the non-pioneer species, the estimated and observed number was 1,203 stems ha-1 (D
Calc = 0.002 < DTab = 0.039). When projecting the diameter distribution for 2020, 472 stems ha-1 were observed for the pioneer species and 1,362 stems ha -1 for the non-pioneer species. Based on these results, it was observed that the forest fragment could continue in successional advancement over the coming years if there was no disturbance that affected the forest’s growth dynamic.
In terms of the carbon stock, a 5.69 McC ha-1 increase
was observed in the period from 2015 to 2020, taking into account the whole forest fragment. This increase was also verified for the ecological groups over this same period, with the carbon stock of the pioneer species increasing from 13.28 MgC ha-1 to 14.80 MgC ha-1 and the non-pioneer
species from 29.41 MgC ha-1 to 33.42 MgC ha-1 This greater
contribution to the carbon stock by the non-pioneer species is mainly due to the greater number of trees per hectare, according to the projection by the Markov chain, as well as due to these species presenting greater density in comparison with the pioneer species which directly affects the carbon stock (Poorter, 2008; Fonseca et al., 2011).
Secondary forests in tropical regions and those undergoing successional advance, have a fundamental importance in providing ecosystem services, mainly as carbon sinks for the atmosphere (Chazdon, 2012). It is estimated that, in the period from 2000 to 2007, these forests stored a total of 1.6 ± 0.5 PgC year-1, with this estimate being higher
than for some primary tropical forests due to the rapid accumulation of biomass under succession (Pan et al., 2011). Therefore, it is expected that the forest fragment can stock a greater quantity of carbon with successional advance and contribute to attenuating the negative effects stemming from climate change.
5.CONCLUSIONS
By 2020, the diameter structure of the fragment will reach a total of 1,841 stems ha-1 following the “J-inverted” distribution. The forest will continue to act as a carbon sink for the atmosphere over the coming years, reaching a carbon stock of 48.97 MgC ha-1, with the greater contribution coming from non-pioneer species.
6.ACKNOWLEDGEMENTS
the Coordenação de Aperfeiçoamento de Pessoal de Nível Superior (CAPES) and the Fundação de Amparo à Pesquisa do Estado de Minas Gerais (FAPEMIG) for the research funding. We would also like to thank the study group in economy and forest management (GEEA) for their assistance with data collection.
7.REFERENCES
Amaro MA. Quantificação do estoque
volumétrico, de biomassa e de carbono em uma Floresta Estacional Semidecidual no Município de Viçosa-MG [tese]. Viçosa, MG: Universidade Federal de Viçosa; 2010.
Associação Brasileira de Normas Técnicas – ABNT. NBR 11941: Densidade básica da madeira. Brasília, DF: 2003.
Batista APB, Rodal MJN, Silva JAAD, Alves Junior FT, Mello JMD. Dynamics and prediction of diametric structure in two Atlantic Forest fragments in northeastern Brazil. Revista Árvore. 2016;40(2):307-17.
Brasil. Resolução n° 392, de 25 junho de 2007. Definição de vegetação primária e secundária de regeneração de Mata Atlântica no Estado de Minas Gerais. Brasília DF: Ministério do MeioÚmbiente/Conselho Nacional de Meio Ambiente
Callegaro RM, Longhi SJ, Andrzejewski C. Variações estruturais entre grupos florísticos de um remanescente de Floresta Ombrófila Mista Montana em Nova Prata - RS. Ciência Florestal. 2015;25(2):337-49.
Chassot T, Fleig FD, Finger CAG, Longhi SJ. Modelos de crescimento em diâmetro de árvores individuais de Araucaria angustifolia (Bertol.) Kuntze em Floresta Ombrófila Mista. Ciência Florestal. 2011;21(2):303-13.
Chazdon R. Tropical forest regeneration. Boletim Museu Paraense Emílio Goeldi de Ciencias Naturais. 2012;7(3):195-218.
Dalla Lana M, Péllico Netto S, Corte APD, Sanquetta CR, Ebling AA. Prognose da estrutura diamétrica em Floresta Ombrófila Mista. Floresta e Ambiente.2015;22(1):71-8.
Ebling AA, Watzlawick LF, Rodrigues AL, Longhi SJ, Longhi RV, Abrão SF. Acuracidade da
distribuição diamétrica entre métodos de projeção em Floresta Ombrófila Mista. Ciência Rural. 2012;42(6):1020-6.
Ferreira PI, Paludo GF, Chaves CL, Bortoluzzi RLC, Mantovani A. Florística e fitossociologia arbórea de remanescentes florestais em uma fazenda produtora de Pinus spp. Floresta. 2012;42(4):783-94.
Ferreira Júnior WG, Schaeffer CEGR, Silva AF. Uma visão pedogeomorfológica sobre as formações florestais da Mata Atlântica. In: Martins SV. Ecologia de florestas tropicais do Brasil. Viçosa, MG: UFV; 2012.
Figueiredo LTM, Soares CPB, Souza AL, Martins SV. Alterações florísticas em uma Floresta Estacional Semidecidual, no município de Viçosa, MG, entre 1994 e 2008. Floresta. 2013;43:169-80.
Figueiredo LTM, Soares CPB, Souza AL, Leite HG, Silva GFD. Dinâmica do estoque de carbono em fuste de árvores de uma Floresta Estacional Semidecidual. Cerne. 2015;21(1):161-7.
Fundação SOS Mata Atlântica; Instituto Nacional de Pesquisas Espaciais - INPE. Atlas dos
Remanescentes Florestais da Mata Atlântica – Período 2013-2014. São Paulo: Fundação SOS Mata Atlântica; 2015.
Fonseca W, Benayas JMR, Alice FE. Carbon
accumulation in the biomass and soil of different aged secondary forests in the humid tropics of Costa Rica. Forest Ecology and Management. 2011;262(8):1400-8.
Gandolfi S, Leitão Filho HF, Bezerra CL. Levantamento florístico e caráter sucessional de espécies arbustivo-arbóreas de uma Floresta Mesófila Semidecídua no município de Guarulhos, SP. Revista Brasileira de Biologia. 1995;55(4):753-67.
Hanberry BB, He HS, Shifley SR. Loss of
aboveground forest biomass and landscape biomass variability in Missouri, US. Ecological Complexity. 2016;25:11-17.
Lima JPDC, Leão JRA. Dinâmica de crescimento e distribuição diamétrica de fragmentos de florestas nativa e plantada na Amazônia sul ocidental. Floresta e Ambiente.2013;20(1):70-9.
Pan Y, Birdsey RA, Fang J, Houghton R, Kauppi PE, Kurz WA, et al. Large and persistent carbon sink in the world’s forests. Science.
2011;333(6045):988-93.
Parzen G. Stochastic process. San Francisco: Holden-Day; 1962.
Poorter L. The relationships of wood, gas and water fractions of tree stems to performance and life history variation in tropical trees. Annals of Botany. 2008;102(3):367-75.
Poorter L, Bongers F, Aide TM, Zambrano AMA, Balvanera P, Becknell JM, et al. Biomass resilience of Neotropical secondary forests. Nature.
2016;530(7589):211-4.
Reis LP. Modelagem de floresta inequiânea: redes neurais artificiais aplicadas em uma floresta manejada no leste da Amazônia. [Tese]. Viçosa, MG: Universidade Federal de Viçosa; 2017.
Ribeiro MN, Pedroni F, Peixoto KDS. Fire and dynamics of a woody community in the cerrado of Barra do Garças, Mato Grosso, Brazil. Acta Botanica Brasilica. 2012;26(1):203-17.
Rossi LMB, Koehler HS, Arce JE, Sanquetta CR. Modelagem de recrutamento em florestas. Floresta. 2007a;37(3).
Rossi LMB, Koehler HS, Sanquetta CR, Arce JE. Modelagem de mortalidade em florestas naturais. Floresta. 2007b;37(2).
Scarano FR, Ceotto P. Brazilian Atlantic Forest: impact, vulnerability and adaptation to climate change. Biodiversity and Conservation. 2015;24(9):2319-31.
Schneider PR, Finger CAG. Manejo sustentado de florestas inequiâneas heterogêneas. Santa Maria: UFSM; 2000.
Shen Y, Santiago LS, Ma L, Lin GJ, Lian JY, Cao HL et al. Forest dynamics of a subtropical monsoon forest in Dinghushan, China:
recruitment, mortality and the pace of community change. Journal of Tropical Ecology.
2013;29(2):131-45.
Shono K, Cadaweng EA, Durst PB. Application of assisted natural regeneration to restore degraded tropical forestlands. Restoration Ecology.
2007;15(4):620-6.
Silva JMC, Pinto LP, Hirota M, Bedê L, Tabarelli M. Conservação da Mata Atlântica brasileira: um balanço dos últimos dez anos. In: Cabral DC, Bustamente AG. Metamorfoses Florestais:
Culturas, ecologias e as transformações históricas da Mata Atlântica. Curitiba: Prismas; 2016.
Souza AL, Boina A, Soares CPB, Vital BR, Oliveira RG, Lana JM. Estrutura fitossociológica, estoques de volume, biomassa, carbono e dióxido de carbono em Floresta Estacional Semidecidual. Revista Árvore. 2012;36(1):169-79.
Souza AL, Soares CPB. Florestas nativas: estrutura, dinâmica e manejo. Viçosa MG: UFV; 2013.
Souza CR, Azevedo CP, Rossi LMB, Santos J, Higuchi N. Projection of diametric distribution and carbon stock of a managed forest in Manaus/AM. Floresta. 2014a;44(3):525-34.
Souza LFT, Fernandes Filho EI, Faria MM. Compartimentação geomorfológica e mapeamento digital de solos no município de Viçosa–MG. Revista Geonorte. 2014b;5(6):110-14.
Stepka TF, Dias NA, Figueiredo Filho A, Machado AS, Sawczuk AR. Prognose da estrutura
diamétrica de uma Floresta Ombrófila Mista com os métodos razão de movimentos e matriz de transição. Pesquisa Florestal Brasileira. 2010;30(64):327-35.
Teixeira LM, Chambers JQ, Silva AR, Lima AJN, Carneiro VMC, Santos J et al. Projeção da dinâmica da floresta natural de Terrafirme, região de Manaus-AM, com o uso da cadeia de
transição probabilística de Markov. Acta Amazônica. 2007;37(3):377-84.
carbono em uma Floresta Estacional Semidecidual, no Parque Tecnológico de Viçosa, MG. Revista Árvore. 2013;37(4):647-55.
Torres CMME, Jacovine LAG, Oliveira Neto SND, Souza ALD, Campos RA, Schettini BLS. Análise fitossociológica e valor de importância em carbono para uma Floresta Estacional Semidecidual. Floresta e Ambiente. 2017;24:e00099714.
Trumbore S, Brando P, Hartmann H. Forest health and global change. Science. 2015;349(6250):814-8.
Universidade Federal de Viçosa – UFV.
Departamento de Engenharia Agrícola. Estação
Climatológica Principal de Viçosa. Boletim Meteorológico 2016. Viçosa, MG: 2016.
Vasconcelos SS, Higuchi N, Oliveira MV. Projeção da distribuição diamétrica de uma floresta
explorada seletivamente na Amazônia Ocidental. Acta Amazonica. 2009;39(1):71-80.
Vital BR. Métodos de determinação de densidade da madeira. Viçosa, MG: 1984.
Xie F, Wu B, Hu Y, Wang Y. A generalized Markov chain model based on generalized interval