Diana Margarida da Costa Ribeiro
Outubro de 2010
Escola de Ciências
Optimization of transient expression
procedures in Catharanthus roseus and
Arabidopsis thaliana for subcellular
localization studies
U M in ho |2 01 0 D ia na M ar ga rid a da C os ta R ib ei ro O p ti m iz a ti o n o f tr a n si e n t ex p re ss io n p ro ce d u re s in C a th a ra n th u s ro se u s a n d A ra b id o p si s th a li a n a f o r su b ce ll u la r lo ca li za ti o n s tu d ie sDissertação de Mestrado
Mestrado em BioTecnologia e Bio-Empreendedorismo em
Plantas Aromáticas e Medicinais
Diana Margarida da Costa Ribeiro
Outubro de 2010
Escola de Ciências
Optimization of transient expression
procedures in Catharanthus roseus and
Arabidopsis thaliana for subcellular
localization studies
Trabalho efectuado sob a orientação do
Professora Doutora Mariana Sottomayor (IBMC, Porto)
Co-Orientadore
Doutora Patrícia Duarte (IBMC, Porto)
Supervisor na instituição
COMPROMETE;
Universidade do Minho, ___/___/______
Optimization of transient expression procedures in Catharanthus roseus and Arabidopsis thaliana III
Agradecimentos
Olhando para trás, muitos foram os que contribuíram para que o último ano fosse especial e inesquecível, na maioria dos casos palavras não chegam para expressar a minha gratidão.
Gostaria de começar por agradecer a toda a família por tudo o que me têm vindo a ensinar, por me fazer sentir capaz de tudo e claro por todos os momentos extraordinários, barulhentos e cheios de risos que passamos juntos!
Às minhas Biomininas e Biomininos que foram o meu refúgio sempre que precisei de motivação, animo, paciência e ajuda para prosseguir. Estiveram sempre presentes nos momentos especiais e acima de tudo durante dificuldades inesperadas, e que nunca me deixaram desanimar! Ao grupinho do comboio que me ajudaram a alegrar as inúmeras e muito chatas viagens de comboio! E em especial, tenho que agradecer à Cheila por todos os bons conselhos!
Gostaria igualmente de agradecer às meninas das peroxidases e menino, claro, por me terem recebido tão bem no grupo, por me terem ajudado sempre no lab, pela boa disposição, e por terem contribuírem para o meu bem-estar durante esta pequena estadia na Invicta.
Muito muito obrigado à minha chefinha, Patrícia, que me ensinou tudo o que hoje sei fazer num laboratório, agradeço toda a paciência, dedicação, orientação, disponibilidade, todos os ensinamentos e todos fins-de-semana que passou a trabalhar em conjunto para esta tese.
À Doutora Mariana agradeço a confiança que depositou em mim mesmo sem me conhecer, e a excelente orientação. Foi uma honra trabalhar com um grupo tão dinâmico!
Optimization of transient expression procedures in Catharanthus roseus and Arabidopsis thaliana V Optimization of transient expression procedures in Catharanthus roseus and
Arabidopsis thaliana for subcellular localization studies.
Abstract
Nowadays, the availability of much gene sequence information demands the development of tools for their fast characterization at the protein level, where function actually resides. Here, the interest in the characterization of certain of the known
Arabidopsis class III peroxidase (Prx) genes, as well as the interest in the
characterization of candidate genes implicated in the metabolism of the anticancer terpenoid indole alkaloids of Catharanthus roseus, has led to the need of establishing transient expression procedures for these two species.
Therefore, the main goal of this work was the development and optimization of simple/fast, efficient and reproducible transient expression protocols for subsequent subcellular localization studies of proteins coded by Prx genes, and for characterization of candidate genes provided from omic approaches, namely implicated in the regulation, biosynthesis or transport of the valuable alkaloids from C. roseus. A complementary goal was to investigate the subcellular localization and sorting determinants of Prxs, namely the vacuolar sorting capacity of a C-terminal amino acid sequence extension (CTE) present in vacuolar Prxs, using as examples the well characterized and most abundant vacuolar Prx from C. roseus leaves, CrPrx1, and the most abundant Prx in the leaves of Arabidopsis, AtPrx34. For this, already available CrPrx1-GFP fusions and newly generated AtPrx34-GFP fusions were used in the transient expression assays.
The successful establishment of protocols for PEG-mediated transformation of both Arabidopsis and C. roseus mesophyll protoplasts was achieved and validated as excellent transient expression systems. Transient expression by Agrobacterium infiltration of Arabidopsis and C. roseus leaves was also attempted, but it was only successful with in vitro C. roseus plants. However, promising insights were made into the development of this technique.
Expression of CrPrx1-GFP fusions in Arabidopsis and C. roseus protoplasts using the established protocols confirmed the vacuolar localization of this Prx. Additionally the CrPrx1 signal peptide (SP) and CTE were confirmed as sorting determinants that target GFP to the ER and vacuole, respectively. The characterization of the subcellular
Optimization of transient expression procedures in Catharanthus roseus and Arabidopsis thaliana VI localization and sorting determinants of AtPrx34 was not elucidated, possibly due to malfunctioning of the vector plasmid used for protoplast infiltration. In fact, upon agroinfiltration of in vitro C. roseus plants, it was possible to observe sorting to the ER of an SPAtPrx34-GFP fusion coded by a construct harboured in a binary vector plasmid,
different from the one used for protoplast transformation. Thus, a resolution of the subcellular sorting of AtPrx34 should be possible in the near future.
The transient expression assays described in the present study were highly reproducible, resulted in very satisfactory transformation efficiencies, and constitute a reliable and inexpensive methods that can be performed in most labs, and that are suitable test-systems to characterize genes of unknown function. This is also the the first time a transient expression system for C. roseus protoplasts is reported, using a PEG-mediated transformation protocol.
Keywords: Catharanthus roseus, Arabidopsis, protoplasts, PEG-mediated
transformation, agroinfiltration, GFP fusions, subcellular localization, secretory pathway, sorting signals, vacuole, confocal microscopy.
Optimization of transient expression procedures in Catharanthus roseus and Arabidopsis thaliana VII Optimização de procedimentos de expressão transiente em Catharanthus roseus e
Arabidopsis thaliana para estudos de localização subcelular.
Resumo
Actualmente, a disponibilidade de inúmeras sequências genómicas exige o desenvolvimento de ferramentas para uma rápida caracterização ao nível protéico, onde de facto reside a função. Neste trabalho a caracterização de determinados genes de Peroxidases de Classe III (Prx) de Arabidopsis, assim como o interesse na caracterização de possíveis genes envolvidos no metabolismo de alcalóides indólicos terpenóides anticancerígenos de Catharanthus roseus, impulsionou a necessidade de estabelecer procedimentos de expressão transiente para estas duas espécies.
Consequentemente, o objectivo principal deste trabalho foi o desenvolvimento e optimização de protocolos de expressão transiente simples/rápidos, eficientes e reproduzíveis para estudos de localização subcelular de proteínas codificados por genes Prx, e para a caracterização de possíveis genes obtidos de abordagens omicas, nomeadamente implicados na regulação, biossíntese ou transporte de alcalóides relevantes de C. roseus. Como objectivo complementar investigar a localização subcelular e sinais de direccionamento de Prxs, designadamente a capacidade de direccionamento vacuolar da extensão C-terminal aminoacídica (CTE) presente em Prxs vacuolares, utilizando como exemplos a Prx vacuolar mais abundante e estudada presente nas folhas de C. roseus, Crprx1, e a Prx mais abundante nas folhas de
Arabidopsis, AtPrx34. Para tal, fusões CrPr1-GFP já disponíveis e fusões AtPrx34-GFP
recém geradas foram utilizadas em procedimentos de expressão transiente.
O estabelecimento com sucesso de protocolos de transformação mediada por PEG para protoplastos de mesófilo de Arabidopsis e C. roseus foi alcançado e validado como um excelente sistema de transformação transiente. Transformação transiente por infiltração com Agrobacterium de folhas de Arabidopsis e C. roseus foi abordado, mas apenas foram obtidos resultados positivos com plantas de C. roseus in vitro. Todavia progressos promissores foram realizados para o desenvolvimento desta técnica.
Expressão de fusões CrPrx1-GFP em protoplastos de Arabidopsis e C. roseus utilizando os protocolos estabelecidos confirmaram a localização vacuolar desta Prx. Adicionalmente o péptido sinal (SP) e a extensão C-terminal (CTE) de CrPrx1 foram
Optimization of transient expression procedures in Catharanthus roseus and Arabidopsis thaliana VIII confirmados com sinais determinantes que direccionam a GFP para o RE e o vacúolo, respectivamente. A caracterização da localização subcelular e sinais de direccionamento de AtPrx34 não foram elucidados, possivelmente devido a uma irregularidade funcional do vector plasmídeal utilizado na transformação de protoplastos. De facto, após agroinfiltraçao de plantas C. roseus in vitro, foi possível observar o direccionamento para o RE da fusão SPAtPrx34-GFP codificada por um constructo incluído em vector
binário, diferente do vector utilizado na transformação de protoplastos. Portanto, a caracterização do direccionamento subcelular da AtPrx34 poderá ser possível num futuro próximo.
Os procedimentos de expressão transiente descritos no presente estudo manifestaram-se bastante reproduzíveis, resultando em níveis satisfatórios de eficiência de transformação, e constituem métodos fidedignos e de baixo custo que podem ser realizados na maioria dos laboratórios, e são sistemas-teste convenientes para caracterizar genes de função desconhecida. Foi também reportado pela primeira vez um sistema de transformação transiente em protoplastos de C. roseus, utilizando um protocolo de transformação mediada por PEG.
Palavras-chave: Catharanthus roseus, Arabidopsis, transformação mediada por PEG, Agroinfiltração, fusões-sGFP, localização subcelular, via secretora, sinais de direccionamento, vacúolo, microscopia confocal.
Optimization of transient expression procedures in Catharanthus roseus and Arabidopsis thaliana IX
Table of contents
Agradecimentos ... III Abstract ... V Resumo ... VII Table of contents ... IX List of abbreviations ... XI List of figures ... XV List of tables ... XXV Short Curriculum vitae ... XXVI1. Introduction ... 3
1.1. Catharanthus roseus: the plant and its clinical uses ... 3
1.2. Biosynthesis of the Vinca alkaloids in C. roseus ... 6
1.3. Class III peroxidases... 10
1.4. The plant secretory pathway ... 14
1.5. Transient gene expression systems ... 21
1.5.1. Agrobacterium-mediated transformation ... 22
1.5.2. PEG-mediated transformation ... 25
1.6. Objectives ... 27
2. Materials and methods ... 31
2.1. Biological material ... 31
2.1.1. Plant material ... 31
2.1.1. Bacterial strains and plasmids ... 33
2.2. Confirmation of already available CrPrx1- GFP fusions ... 35
2.3. Preparation of plasmid DNA for PEG-mediated transformation of protoplasts ... 36
2.4. Generation of AtPrx34 –GFP fusions ... 37
2.4.1. Transformation of E. coli ... 38
2.4.2. Primers ... 39
2.4.3. Polymerase chain reaction (PCR) ... 40
2.4.4. Cloning: restriction digestions and ligations ... 42
2.4.5. Selection of positive clones ... 45
2.5. Isolation of Arabidopsis mesophyll protoplasts ... 47
Optimization of transient expression procedures in Catharanthus roseus and Arabidopsis thaliana X
2.7. PEG-mediated transformation of Arabidopsis and C. roseus protoplasts ... 51
2.8. Confocal Laser Scanning Microscopy (CLSM) analysis of the transformed protoplasts 52 2.9. Agrobacterium-mediated transformation by leaf infiltration ... 53
2.10. Confocal Laser Scanning Microscopy (CLSM) analysis of the infiltrated leaf regions 55 3. Results ... 59
3.1. Confirmation of the CrPrx1-GFP fusions ... 59
3.2. Generation of the AtPrx34-GFP fusions ... 61
3.3. Isolation of Arabidopsis mesophyll protoplasts ... 74
3.4. Isolation of C. roseus mesophyll protoplasts ... 74
3.5. PEG-mediated transformation of Arabidopsis protoplasts ... 76
3.5.1. Transformation with control/marker constructs ... 76
3.5.2. Transformation with AtPrx34-GFP fusions ... 82
3.5.3. Transformation efficiency and protoplast survival rates ... 85
3.6. PEG-Mediated Transformation of C. roseus Protoplasts ... 86
3.6.1. Tranformation with control/marker constructs ... 86
3.6.2. Transformation efficiency and protoplast survival rates ... 90
3.7. Agrobacterium-mediated transformation of Arabidopsis leaves ... 91
3.8. Agrobacterium-mediated transformation of C. roseus leaves ... 93
4. Discussion ... 97
5. Conclusions and final remarks ... 107
Optimization of transient expression procedures in Catharanthus roseus and Arabidopsis thaliana XI
List of abbreviations
35S - Cauliflower Mosaic virus promoter 4-MN - 4-methoxy-α-naphthol
aa – Amino acid
Acc/dec - Acceleration/deceleration
AtPrx34 - Arabidopsis thaliana Peroxidase 34 AVLBS - Anhydrovinblastine synthase BAP - 6-Benzylaminopurine
Bdd - Bi-distilled deionized BiP – Binding protein BN - pTH2-BN
BP-80 - Binding-protein of 80 kDa cDNA - Complementary DNA CCV - Clathrin coated vesicles CDS – Coding sequence COPI - Coat protein complex I COPII - Coat protein complex II
CrPrx1 - Catharanthus roseus Peroxidase 1 CrPrx2b - Catharanthus roseus Peroxidase 2b CTE or CE - C-Terminal Extension
ctVSD - C-terminal Vacuolar Sorting Domain cv. - Cultivar
DMAPP - Dimethylallyl diphosphate DNA - Deoxyribonucleic acid
dNTPs - Deoxyribonucleotide triphosphate: Purine (Adenine, Guanine), Pyrimidine (Uracil, Thymine, Cytosine)
DV - Dense vesicles
EDTA - Ethylenediaminetetraacetic acid e.g. - For example
ER - Endoplasmic Reticulum
ERES - Endoplasmic Reticulum Export Sites FP - Fluorescent Protein
Optimization of transient expression procedures in Catharanthus roseus and Arabidopsis thaliana XII FW - Fresh Weight
g - Gram
G10H - Geraniol 10-hydroxylase
GFP - Green Fluorescent Protein (originally isolated from Aequorea victoria) GPP - Geranyl diphosphate
HDS - Hydroxymethylbutenyl 4-diphosphate synthase HRPC - Horseradish peroxidase isoenzyme C
IPP - Isopentenyl diphosphate L – Liter
LB - Luria Bertrani LV - Lytic vacuole
MEP - 2-C-methyl-D-erythritol4-phosphate MES - 2-(N-morpholino)ethanesulfonic acid mL – Milliliter
mM - Millimolar
mRNA - messenger Ribonucleic acid MS - Murashige & Skoog
MVB - Multivesicular body
Nos ter - NOS terminator (nopaline synthase) from A.tumefaciens
OD - Optical density ON - Overnight
PAC - Precursor-accumulating vesicle pDNA – plasmid DNA
PEG 4000 - Polyethylene glycol with a molecular weight of 4000
Prx - Class III peroxidase Primer fwd - Primer forward Primer rev - Primer reverse
psVSD - Physical structure Vacuolar Sorting Domain PSV - Protein-storage vacuole
PVC - Prevacuolar compartment
RFP - Red Fluorescent Protein (originally isolated from Acropora millepora)
RMR - luminal Receptor homology domain trans Membrane domain and RING-H2 motif in the cytoplasmic tail protein
Optimization of transient expression procedures in Catharanthus roseus and Arabidopsis thaliana XIII RT - Room temperature
ROS - Reactive oxygen species rpm - Revolutions per minute
SAV - Senescence-associated vacuole SP - Signal peptide
ssVSD - sequence-specific Vacuolar Sorting Domain SGD - strictosidine β-D-glucosidade
STR - Strictosidine synthase TDC - Tryptophan decarboxylase TGE - Transient gene expression
TIA - Terpenoid indole alkaloid TIP - Tonoplast intrinsic protein Tm - Melting temperature Vir - Virulence genes v/v – volume/volume
VSD - Vacuolar Sorting Domain YEB - Yeast Extract Broth w/v – weight/volume ºC - Degree Celsius µg - microgram µL – microliter µM – microMolar
Optimization of transient expression procedures in Catharanthus roseus and Arabidopsis thaliana XIV Amino Acid terminology, abbreviation terms and single letter for each amino
acid:
Amino Acid Abbreviation Single letter
Lysine LYS K Asparagine ASN N Threonine THR T Arginine ARG R Methionine MET M Isoleucine ILE I Glutamine GLN Q Histidine HIS H Proline PRO P
Glutamic acid GLU E
Aspartic acid ASP D
Alanine ALA A Glycine GLY G Valine VAL V Tyrosine TYR Y Serine SER S Tryptophan TRP W Cysteine CYS C Leucine LEU L Phenylalanine PHE F
Optimization of transient expression procedures in Catharanthus roseus and Arabidopsis thaliana XV
List of figures
Figure 1. Flowering plant of Catharanthus roseus (L.) G. Don cv. Little Bright Eyes and respective
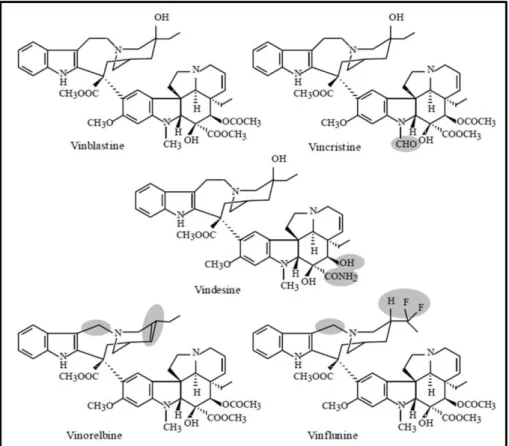
taxonomic classification. Adapted from The PLANTS Database (http://plants.usda.gov). ... 3 Figure 2. Structure of natural and semi synthetic Vinca alkaloids. Shaded areas indicate the structural
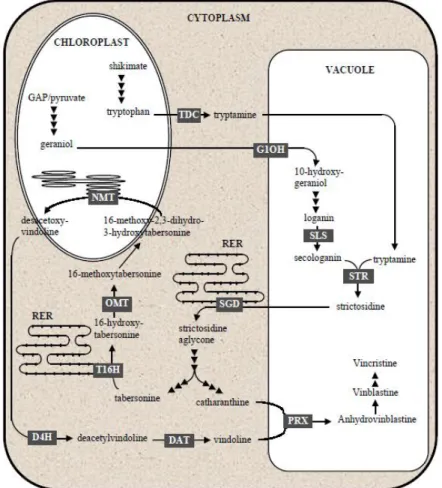
differences from vinblastine. In Sottomayor & Alfonso Ros Barceló 2006. ... 5 Figure 3. Compartmentalization of the biosynthetic pathway of terpenoid indole alkaloids in C. roseus
cells. G10H: geraniol 10-hydroxylase; SLS: secologanin synthase; TDC: tryptophan decarboxylase; STR: strictosidine synthase; SGD: strictosidine β-D-glucosidade; T16H: tabersonine 16-hydroxylase; OMT: adenosyl - L-methionine : 16-hydroxytabersonine - 16-O-methyltransferase; NMT: S-adenosyl - L-methionine : 16-methoxy - 2,3-dihydro-3-hydroxytabersonine - N-methyltransferase; D4H: desacetoxy vindoline 4-hydroxylase; DAT: acetylcoenzyme A : deacetylvindoline 4-O-acetyltransferase; PRX: peroxidase. In Sottomayor & Alfonso Ros Barceló 2006. ... 8 Figure 4. Structures of vinblastine and vincristine and their precursors. The coupling of catharanthine
and vindoline originates an unstable iminium cation that is reduced to yield
α-3’,4’-anhydrovinblastine. Adapted from Sottomayor et al. 1998. ... 9
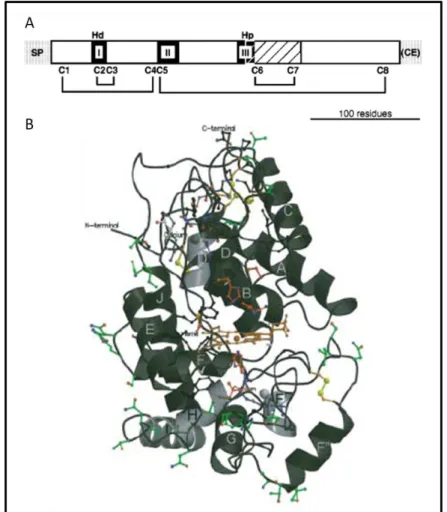
Figure 5. Prx features according with the structure of horseradish peroxidase isoenzyme C (HRPC). A. Structural representation of HRPC. N-terminal signal peptide (SP) and C-terminal extension (CE) are indicated by gray boxes. Filed boxes represent a conserved catalytic and distal heme-binding domain (I), a central heme-binding domain (II) and a proximal heme-binding domain (III) of unknown functions. A region presumed to be important for determining the specific function is indicated by a hatched box. Invariable distal histidine (Hd), proximal histidine (Hp) and eight cysteine residues (C1 to C8), which form a disulfide bond network are shown above and below the boxes, respectively (in Hiraga et al., 2001). B. Three-dimensional structure of HRPC. The central heme group is sandwiched between the two protein domains (orange). Helices A-J are marked;
active site residues are in red; side chain ligands to the distal and proximal Ca2+ ions are in blue;
cysteine residues involved in disulfide bridges showed in yellow; an invariant ion-pair motif are on a grey background; and putative N-glycosylated triplets are in green. N-terminal and C-terminal extensions are indicated. In Welinder et al. 2002. ... 11 Figure 6. In gel Prx activity of Arabidopsis and C. roseus leaf extracts. Isoelectric focusing (IEF) gel
showing that the main Prx activity observed in leaf protein extracts of these two species is due to the presence of a basic isoenzyme, identified as AtPrx34 and CrPrx1, for Arabidopsis and C. roseus, respectively. Unpublished data. ... 13 Figure 7. In silico analysis of Prx gene expression in Arabidopsis adult leaves, using the GENEVESTIGATOR
microarray database (https://www.genevestigator.ethz.ch/). In this figure are represented the levels of expression of the ten most expressed AtPrx genes. ... 14
Optimization of transient expression procedures in Catharanthus roseus and Arabidopsis thaliana XVI Figure 8. Anterograde and retrograde transport between ER and Golgi in plant cells. Protein motifs that
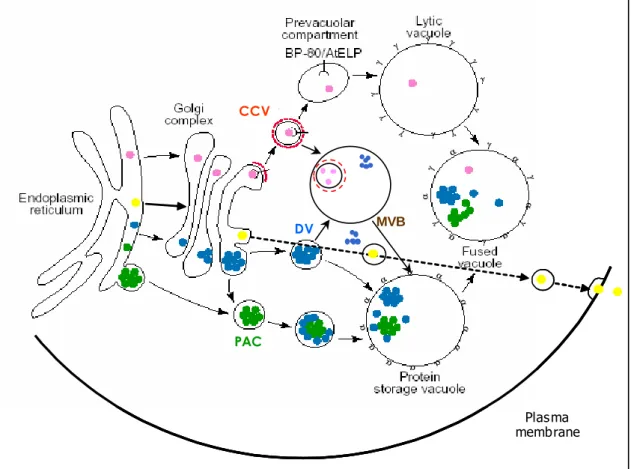
are important for anterograde and retrograde cargo recognition are indicated. In Matheson et al., 2006. ... 16 Figure 9. A working model for soluble protein traffic to the different vacuoles and cell wall. All proteins
are translocated into the ER lumen. Cargo proteins (pink dots) destined to the lytic vacuoles (LVs) bind the sorting receptor BP-80, and enter clathrin coated vesicles (CCVs). They are then released into the prevacuolar compartment/multivesicular body (PVC/MVB), from where BP-80 is recycled, and are eventually delivered to LV. The broken red line represents the clathrin coat. Most storage proteins (blue dots) are concentrated throughout the Golgi stack and packaged into dense vesicles (DVs), which eventually fuse with the protein storage vacuole (PSV). Green dots indicate a
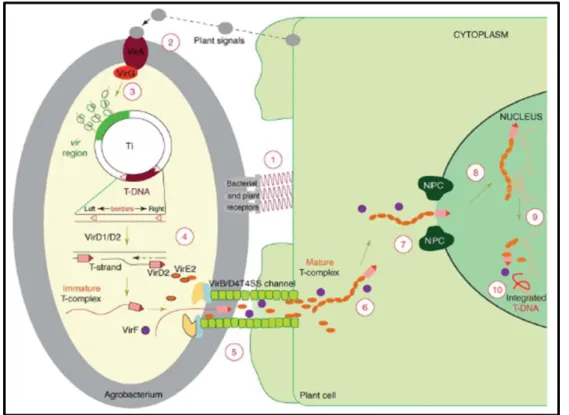
pathway where proteins are directed to PSVs following a Golgi-independent route. MVBs might be a last intermediate station before PSVs. The fused vacuole represents the situation in many mature cells, where the LVs and PSVs merge into a single compartment capable of receiving both lytic and storage proteins. Yellow dots represent proteins that follow the default pathway to the cell wall. The Greek letters indicate specific vacuole types identified because they carry a specific TIP in their tonoplast: α for α-TIP on PSV, γ for γ-TIP on LV. The recycling pathways are not shown. Adapted from Vitale and Raikhel, 1999. ... 19 Figure 10. A model for the Agrobacterium-mediated genetic transformation. The transformation process
comprises 10 major steps and begins with recognition and attachment of the Agrobacterium to the host cells (1) and the sensing of specific plant signals by the Agrobacterium VirA/VirG two-component signal-transduction system (2). Following activation of the vir gene region (3), a mobile copy of the T-DNA is generated by the VirD1/D2 protein complex (4) and delivered as a VirD2–DNA complex (immature T-complex), together with several other Vir proteins, into the host-cell
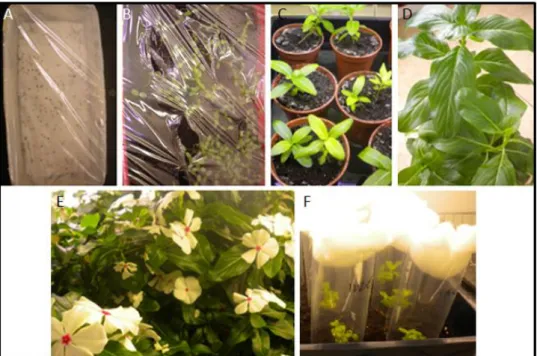
cytoplasm (5). Following the association of VirE2 with the T-strand, the mature T-complex forms, travels through the host-cell cytoplasm (6) and is actively imported into the host-cell nucleus (7). Once inside the nucleus, the T-DNA is recruited to the point of integration (8), stripped of its escorting proteins (9) and integrated into the host genome (10). In Tzfira and Citovsky, 2006. ... 24 Figure 11. Catharanthus roseus plants at different developmental stages. A. Seeds germinating on filter
paper. B. Seedlings recently transferred to soil at the beginning of the acclimatization process. C. Young acclimatized plants in individual pots. D. Non-flowering plant. E. Adult flowering plants. F. Regenerated plants, obtained in vitro from mature zygotic embryos, at the beginning of the acclimatization process. ... 32 Figure 12. Plants of Arabidopsis thaliana at different developmental stages. A. Seedlings at the original
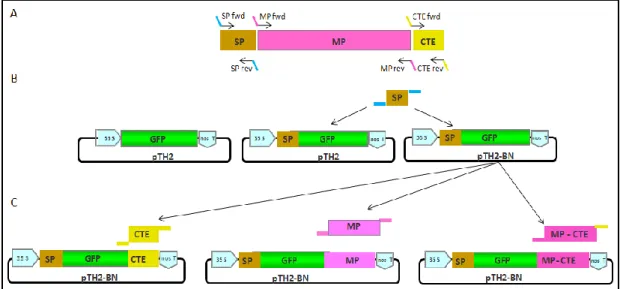
pot where seeds were scattered to germinate. B. Seedlings exhibiting the first pair of true leaves after transference into individual pots. Pots were covered with cling film to start acclimatization. C. Plants at the developmental stage 4 defined by Boyes et al. (2001). D. Magnification of C. ... 33 Figure 13. Schematic representation of the cloning strategy followed to obtain the AtPrx34-GFP
Optimization of transient expression procedures in Catharanthus roseus and Arabidopsis thaliana XVII amplification. SP - signal peptide; MP – mature protein; CTE - C-terminal extension. B. Schematic representation of pTH-2, depicting the 35S promoter, GFP and the nos terminator regions (left). The SP of AtPrx34 was cloned in frame into pTH-2 (centre) and pTH2-BN (right). C. The CTE, MP and MP-CTE of AtPrx34 were all cloned at the C-terminus of GFP, on the starter construct
35S::SPAtPrx34-GFP- in pTH2-BN (B, right). ... 38
Figure 14. Schematic representation of the cloning vectors, pTH2 and pTH2-BN, depicting the most relevant restriction sites and the 35S promoter, sGFP and Nos terminator regions. ... 38
Figure 15. Isolation of Arabidopsis mesophyll protoplasts. ... 48
Figure 16. Representation of the hemocytometer used to count the cells. ... 49
Figure 17. Isolation of C. roseus mesophyll protoplasts. ... 50
Figure 18. Agro-infiltration of Arabidopsis and C. roseus leaves using a syringe. A to C. Infiltration of Arabidopsis leaves. D and E. Infiltration of C. roseus leaves. F. Infiltrated C. roseus leaves detached from the plant. G and H. Infiltration of C. roseus seedlings. I to K. Infiltration of C. roseus in vitro regenerated plants. Arrows indicate infiltrated regions. ... 54
Figure 19. Agroinfiltration of C. roseus leaves using vacuum. A. Seedlings. B. 1st and 2nd leaf pairs of an adult plant. C. Detached leaves and leaf discs obtained from the 2nd pair of leaves of C. roseus adult plants, in the Petri dishes used for vacuum infiltration. ... 55
Figure 20. Schematic representations and restriction analysis of the CrPrx1-GFP fusions. A. Schematic representation of the CrPrx1-GFP constructs. B. Schematic representation of the cloning vectors, pTH2 and pTH2-BN, depicting the most relevant restriction sites and the 35S promoter, sGFP and Nos terminator regions. C. Agarose gel electrophoresis showing the plasmids bearing the different cosntructs linearized with SalI. The lower molecular weight bands (asterisks) correspond to undigested plasmid and can also be seen in D. D. Agarose gel electrophoresis showing the restriction analysis of the same plasmids as in C. C1 and C2 were double digested with SalI and PstI excising the 35S promoter (~400bp) and sGFP (~750bp) for C1, and the 35S promoter (~400bp) and SP-GFP (~850bp) for C2 (arrowheads). C3 and C5 were double digested with SalI and XhoI releasing SP-GFP-CTE (~950bp) for C3 and SP-GFP-MP-CTE (~1500bp) for C5 (arrowheads). M – Molecular weight marker, GeneRulerTM DNA Ladder Mix (Fermentas). 1.5 % agarose gels. ... 59
Figure 21. Agarose gel electrophoresis of all pDNAs used for protoplast transformation. A. pTH2 empty vector (C1) and CrPrx1-GFP fusions (C2-C5). B. Vacuolar (Vac) marker construct (35S::SPCrPrx1 -GFP-CTTPPhaseolin) and ER (ER) marker construct (35S::SPCrPrx1-GFP-KDEL). M – Molecular weight marker, GeneRulerTM DNA Ladder Mix (Fermentas). In both cases, 2 µL of each sample were loaded onto 1.5 % agarose gels. ... 60 Figure 22. Coding sequence and deduced translated protein sequence of AtPrx34, the main Prx in A.
thaliana leaves. A. Coding sequence and deduced amino acid sequence for AtPrx34. The predicted
SP sequence in is blue and the predicted CTE sequence is in yellow. Coloured boxes mark the annealing sites of all primers used: light blue for SP (navy blue for SP2), pink for MP and yellow for CTE. The underlined sequence marks the predicted cleavage site of the SP. B. Prediction of the
Optimization of transient expression procedures in Catharanthus roseus and Arabidopsis thaliana XVIII AtPrx34 SP region and cleavage site using the SignalP 3.0 program. C. Multiple alignment of the C-terminal regions of the deduced amino acid sequences of several Arabidopsis class III peroxidases. The box marks the AtPrx34 sequence, previously named AtPCb. The CTE regions are in italic and are thought to be absent in the mature proteins. Adapted from Welinder et al. 2002. ... 62 Figure 23. Restriction analysis of the original clone containing the complete cDNA of AtPrx34. A.
Schematic representation of vector pRAFL03. B. pRAFL03-AtPrx34 individual clones digested with
SalI. A single band with ~4.3 kb was observed. M – Molecular weight marker, GeneRulerTM DNA Ladder Mix (Fermentas). 1.5 % agarose gel. ... 63 Figure 24. Restriction analysis of the expression vectors pTH2 and pTH2-BN. A. Schematic representation
of pTH2 and pTH2-BN, depicting the most relevant restriction sites and the 35S promoter, sGFP and Nos terminator regions. B. Individual clones of pTH2 and pTH2-BN digested with PstI, releasing a fragment of 1.2 kb (35S::GFP) for pTH2, and 1.25 kb (35S::GFP-BN linker) for pTH2-BN.
M – Molecular weight marker, GeneRulerTM DNA Ladder Mix (Fermentas). 1.5 % agarose gel. ... 63
Figure 25. PCR amplification of the selected AtPrx34 regions using Taq DNA polymerase (Fermentas). All observed bands had the expected molecular weight. A. SP ~100 bp and CTE ~60 bp. 1.5% agarose gel. B. Full CDS ~1100 bp, MP-CTE ~950 bp and MP ~900 bp. 1.0 % agarose gel. M – Molecular
weight marker, GeneRulerTM DNA Ladder Mix (Fermentas). ... 64
Figure 26. PCR amplification of the selected AtPrx34 regions using Pfu DNA polymerase (Fermentas). All observed bands had the expected molecular weight. A. SP ~90 bp and CTE (~60 bp). 1.5% agarose gel. B. Full CDS (~1100 bp), MP-CTE (~950 bp) And MP (~900 bp). 1.0 % agarose gel. M – Molecular
weight marker, GeneRulerTM DNA Ladder Mix (Fermentas). ... 64
Figure 27. Preparative agarose gel electrophoresis for the ligation reactions between SP1AtPrx34 and the
expression vectors pTH2 and pTH2-BN. All DNAs were previously digested with SalI and NcoI and
purified. 2 µL of each vector (pTH2 and BN) and 4 µL of SP1AtPrx34 (arrow) were loaded on the gel.
M – Molecular weight marker, GeneRulerTM DNA Ladder Mix (Fermentas). 1.5% agarose gel. ... 65
Figure 28. Restriction analysis of the clones obtained after ligation between SP1AtPrx34 and the expression
vectors pTH2 and pTH2-BN. A. Schematic representation of the SP1AtPrx34-GFP construct (top) and
restriction analysis of the pTH2-SP1AtPrx34 clones with SalI and EcoRI (bottom).The lane marked with
pTH2 corresponds to the digestion of the empty vector. All the represented clones are positive, which is translated by the presence of a band with 1.1 kb. B. Schematic representation of the SP1AtPrx34-GFP BN construct (top) and restriction analysis of the pTH2-BN-SP1AtPrx34 clones with SalI
and BglII (bottom) .The lane marked with BN corresponds to a digestion of the empty vector. Positive clones were identified by the presence of a band with ~850 bp. M – Molecular weight
marker, GeneRulerTM DNA Ladder Mix (Fermentas). 1.5% agarose gels. ... 66
Figure 29. Alignment between the SP1AtPrx34 sequence and sequences obtained for the generated clones.
A. Schematic representation of the SP1AtPrx34-GFP construct (top) and alignments (bottom).
Alignments were performed with the sequences obtained for clones 23 and 24 from Figure 28A. B.
Optimization of transient expression procedures in Catharanthus roseus and Arabidopsis thaliana XIX Alignments were performed with the sequences obtained for clones 1 and 2 from Figure 28B. Asterisks (*) represent perfect matches. SP sequence is marked in brown. Sequencing reactions were performed with primer M13Fwd, that anneals with both expression vectors upstream the 35S promoter region. ... 66 Figure 30. Preparative agarose gel electrophoresis for the ligation reactions between CTE, MP and
MP-CTE of AtPrx34 and the backbone pTH2-BN-SP1AtPrx34. All DNAs were previously digested with BglII
and XhoI and purified. 2 µL of the vector (BN+SP), MP and MP-CTE, and 4 µL of CTE (arrow) were
loaded on the gel. M – Molecular weight marker, GeneRulerTM DNA Ladder Mix (Fermentas). 1.5%
agarose gel. ... 67
Figure 31. Restriction analysis of the clones obtained after ligation between pTH2-BN-SP1AtPrx34 and the
CTE, MP and MP-CTE regions of AtPrx34. A. Schematic representation of the SP1AtPrx34-GFP-CTE
construct (top) and restriction analysis of the pTH2-SP1AtPrx34-GFP-CTEclones with SalI and XhoI
(bottom). All the represented clones are positive, which is translated by the presence of a band
with ~900 bp. 1.5% agarose gel. B. Schematic representation of the SP1AtPrx34-GFP-MPAtPrx34
construct (top) and restriction analysis of the pTH2-SP1AtPrx34-GFP-MPAtPrx34 clones with BglII and
XhoI (bottom). All the represented clones are positive, which is translated by the presence of a
band with ~900 bp corresponding the MPAtPrx34 fragment. C. Schematic representation of the
SP1AtPrx34-GFP-MP-CTEAtPrx34 construct (top) and restriction analysis of the
pTH2-SP1AtPrx34-GFP-MP-CTEAtPrx34 clones with BglII and XhoI (bottom). All the represented clones
are positive, which is translated by the presence of a band with ~950 bp corresponding the
MP-CTEAtPrx34 fragment. 1.5% agarose gels. Lanes marked with BN+SP correspond to digestions of
the backbone construct. M – Molecular weight marker, GeneRulerTM DNA Ladder Mix (Fermentas).
... 68
Figure 32. Alignment between the predicted CTEAtPrx34 / MPAtPrx34 / MP-CTEAtPrx34 sequence and the
generated clones. A. Schematic representation of the SP1AtPrx34-GFP-CTEAtPrx34 construct (top) and
alignments (bottom). Alignments were performed with the sequences obtained for clones 8 and 16 from Figure 31A. Sequencing reactions were performed with custom primer sGFP-Fwd that
anneals with sGFP. B. Schematic representation of the SP1AtPrx34-GFP-MPAtPrx34 construct (top) and
alignments (bottom). Alignments were performed with the sequences obtained for clones 4 and 10 from Figure 31B. Sequencing reactions were performed with custom primer sGFP-Fwd and complemented custom primer AtPrx34-Fwd that anneals within AtPrx34 mature protein. C.
Schematic representation of the SP1AtPrx34-GFP-MP-CTEAtPrx34 construct (top) and alignments
(bottom). Alignments were performed with the sequences obtained for clones 10 and 17 from Figure 31C. Sequencing reactions were performed with custom primer sGFP-Fwd and
complemented custom primer AtPrx34-Fwd. Asterisks (*) represent perfect matches. All inserts sequences are marked in the same color as portrayed in the schematic representation of he constructs. Nucelotides in grey represent the vectors sequence. Between the inserts sequence and te vectors sequence are the restrion enzymes sequence... 69
Optimization of transient expression procedures in Catharanthus roseus and Arabidopsis thaliana XX Figure 33. PCR amplification of the SP2 region from AtPrx34. A. Amplification performed with Taq DNA
polymerase. B. Amplification performed with Pfu DNA polymerase. All the P2 bands had the expected molecular weight of 160 bp. M - Molecular marker, Gene Ruler. 1.5% agarose
electrophoresis gel. ... 70
Figure 34. Preparative agarose gel electrophoresis for the ligation reactions between SP2AtPrx34 and the
expression vectors pTH2 and pTH2-BN. All DNAs were previously digested with SalI and NcoI, and
purified accordingly. 2 µL of each vector (pTH2 and BN) and 4 µL of SP2AtPrx34 (arrow) were loaded
on the gel. M – Molecular weight marker, GeneRulerTM DNA Ladder Mix (Fermentas). 1.5%
agarose gel. ... 71
Figure 35. Restriction analysis of the clones obtained after ligation between SP2AtPrx34 and the expression
vectors pTH2 and pTH2-BN. A. Schematic representation of the SP1AtPrx34-GFP construct (top) and
restriction analysis of the pTH2-SP2AtPrx34 clones with SalI and EcoRI (bottom).The lane marked with
pTH2 corresponds to the digestion of the empty vector. All the represented clones are positive, which is translated by the presence of a band with 1.2 kb. B. Schematic representation of the SP1AtPrx34-GFP BN construct (top) and restriction analysis of the pTH2-BN-SP2AtPrx34 clones with SalI
and BglII (bottom) .The lane marked with BN corresponds to a digestion of the empty vector. Positive clones were identified by the presence of a band with ~950 bp. M – Molecular weight
marker, GeneRulerTM DNA Ladder Mix (Fermentas). 1.5% agarose gels. ... 71
Figure 36. Alignment between the predicted SP2AtPrx34 sequence and the generated clones. Schematic
representation of the SP1AtPrx34-GFP construct for pTH2 and pTH2-BN(top) and alignments
(bottom). Alignments were performed with the sequences obtained for clones 3 and 5 from Figure 35A, and for clones 4 and 7 from Figure 35B. Asterisks (*) represent perfect matches. SP sequence is marked in brown. Sequencing reactions were performed with primer M13Fwd that anneals with both expression vectors upstream the 35S promoter region. ... 72 Figure 37. Preparative agarose gel electrophoresis for the ligation reactions between CTE, MP and
MP-CTE of AtPrx34 and the backbone pTH2-BN-SP2AtPrx34. A. Ligation between AtPrx34 CTE and
pTH2-BN-SP2. B. Ligation between AtPrx34 MP / MP-CTE and pTH2-pTH2-BN-SP2. All DNAs were previously digested with BglII and XhoI and purified. 2 µL of the vector (BN+SP), MP and MP-CTE, and 4 µL of
CTE (arrow) were loaded on the respective geis. M – Molecular weight marker, GeneRulerTM DNA
Ladder Mix (Fermentas). 1.5% agarose gel. ... 72
Figure 38. Restriction analysis of the clones obtained after ligation between pTH2-BN-SP2AtPrx34 and the
CTE, MP and MP-CTE regions of AtPrx34. A. Schematic representation of the SP1AtPrx34-GFP-CTE
construct (top) and restriction analysis of the pTH2-SP2AtPrx34-GFP-CTEclones with SalI and XhoI
(bottom). All the represented clones are positive, which is translated by the presence of a band
with ~1000 bp. 1.5% agarose gel. B. Schematic representation of the SP2AtPrx34-GFP-MPAtPrx34 and
SP2AtPrx34-GFP-MP-CTEAtPrx34 constructs (top) and restriction analysis of the same constructclones
with BglII and XhoI (bottom). All the represented clones are positive, which is translated by the
Optimization of transient expression procedures in Catharanthus roseus and Arabidopsis thaliana XXI
corresponding the MP-CTEAtPrx34 fragment (right). 1.5% agarose gels. Lanes marked with BN+SP
correspond to digestions of the backbone construct. M – Molecular weight marker, GeneRulerTM
DNA Ladder Mix (Fermentas)... 73 Figure 39. Agarose gel electrophoresis of all AtPrx34-GFP pDNAs used for protoplast transformation. A.
C2-C5 AtPrx34-GFP fusions, generated with SP1. B. C2-C5 AtPrx34-GFP fusions, generated with
SP2. M – Molecular weight marker, GeneRulerTM DNA Ladder Mix (Fermentas). In all cases, 2 µL of
each sample were loaded onto 1.5 % agarose gels. ... 73 Figure 40. Bright field images of A. thaliana mesophyll protoplasts at different magnifications. Bars = 50
µm. Magnification = 40x. ... 74 Figure 41. Bright field (left column) and autofluorescence under UV light (right column) images of C.
roseus mesophyll protoplasts.. Blue fluorescence under UV light is due to the accumulation of the
alkaloid serpentine in the vacuoles of mesophyll specialized cells named idoblasts. Under UV light, chloroplasts also slightly fluoresce in red. Bars = 50 µm. Magnification = 40x. ... 75 Figure 42. Transient transformation of Arabidopsis protoplasts with a control GFP fusion observed under
the confocal microscope. A. Schematic representation of the 35S::GPF construct (C1). B. Typical GFP fluorescence pattern observed for transformation with the C1 cosntruct. GFP accumulates in the cytoplasm. Arrows are pointing to the nucleus of cells. Left - GFP channel; Middle – Red channel showing chloroplast autofluorescence; Right – merged images. Bars = 10 µm.
Magnification = 40x. ... 77 Figure 43. Transient transformation of Arabidopsis protoplasts with an ER located GFP fusion observed
under the confocal microscope. A. Schematic representation of the 35S::SPCrPrx1-GPF-KDEL
construct. B. GFP is targeted to, and accumulated in the ER. The arrow is pointing to the perinuclear ER. Left - GFP channel; Middle – Red channel showing chloroplast autofluorescence; Right – merged images. Bars = 10 µm. Magnification = 40x. ... 78
Figure 44. Transient transformation of Arabidopsis protoplasts with the SPCrPrx1-GFP fusion (C2),
observed under the confocal microscope. A. Schematic representation of the 35S::SPCrPrx1-GPF
construct (C2). B. GFP is targeted to an unidentified compartment of the secretory pathway. Arrow points to the perinuclear ER. Left - GFP channel; Middle – Red channel showing chloroplast autofluorescence; Right – merged images. Bars = 10 µm. Magnification = 40x. ... 79
Figure 45. Transient transformation of Arabidopsis protoplasts with SPCrPrx1-GFP-CTECrPrx1 fusion (C3),
observed under the confocal microscope. A. Schematic representation of the 35S::SPCrPrx1
-GPF-CTECrPrx1 construct (C3). B. The presence of the CTE of CrPrx1 targets GFP to the central
vacuole. Arrows indicates unidentified smaller structures also eccumulating GFP. Left - GFP channel; Middle – Red channel showing chloroplast autofluorescence; Right – merged images. Bars = 10 µm. Magnification = 40x... 80
Figure 46. Transient transformation of Arabidopsis protoplasts with SPCrPrx1-GFP-MP-CTECrPrx1 fusion (C5),
observed under the confocal microscope. A. Schematic representation of the 35S::SPCrPrx1
Optimization of transient expression procedures in Catharanthus roseus and Arabidopsis thaliana XXII small vacuoles or intermediate compartments (possibly PVCs). Left - GFP channel; Middle – Red channel showing chloroplast autofluorescence; Right – merged images. Bars = 10 µm.
Magnification = 40x. ... 80 Figure 47. Transient transformation of Arabidopsis protoplasts with a vacuole located GFP fusion,
observed under confocal laser-scanning microscopy. A. Schematic representation of the
35S::SPCrPrx1-GPF- CTPPPhaseolin construct. B. GFP target to the vacuole. Arrow shows a
nontransformed cell next to a transformed cell. Left - GFP channel; Middle – Red channel showing chloroplast autofluorescence; Right – merged images. Bars = 10 µm. Magnification = 40x. ... 81
Figure 48. Transient transformation of Arabidopsis protoplasts with SPCrPrx1-GFP-MPCrPrx1 fusion (C4),
observed under confocal laser-scanning microscopy. A. Schematic representation of the C4:
35S::SPCrPrx1-GPF-MPCrPrx1 construct. B. GFP is targeted to an unidentified compartment of the
secretory pathway. Arrow points to the perinuclear ER. Left - GFP channel; Middle – Red channel showing chloroplast autofluorescence; Right – merged images. Bars = 10 µm. Magnification = 40x. ... 82 Figure 49. Transient transformation of Arabidopsis protoplasts with several AtPrx34-GFP fusions
observed under the confocal microscope. A. Schematic representation of all used constructs is
shown: 35S::SP1AtPrx34-GFP (C2), 35S::SP1AtPrx34-GFP-CTEAtPrx34 (C3), 35S::SP1AtPrx34-GFP-MPAtPrx34 (C4)
and 35S::SP1AtPrx34-GFP-MP-CTEAtPrx34 (C5). B. In all cases GFP accumulates in the cytoplasm. Left -
GFP channel; Middle – Red channel showing chloroplast autofluorescence; Right – merged images. Bars = 10 µm. Magnification = 40x... 83
Figure 50. Transient transformation of Arabidopsis protoplasts with SP2AtPrx34-GFP fusion, observed
under confocal laser-scanning microscopy. A. Schematic representation of the 35S::SP2AtPrx34-GFP
(C2) construct. B and C. No specific GFP pattern is explicit for protoplasts transformed with the C2 construct described. Arrow indicate a weak fluorescent signal observed in a pattern suggestive of components of the secretory pathway. D. Signal emission to all other AtPrx34-GFP fusions with SP2. Left - GFP channel; Middle – Red channel showing chloroplast autofluorescence; Right – merged images. Bars = 10 µm. Magnification = 40x. ... 84 Figure 51. Quantitative data for PEG-mediated transformation of Arabidopsis protoplasts. A. Cell survival
rate for untransformed protoplasts not exposed and exposed to PEG (without and with PEG, respectively), and for protoplasts submitted to the complete protocol of transformation with C1 construct. B. Transformation rate of protoplasts with C1 construct. Statistical data calculated from an average of 8 individual experiments. ... 85 Figure 52. Transient transformation of C. roseus protoplasts with a control GFP construct observed
under the confocal microscope. A. Schematic representation of the 35S::GPF construct (C1). B. Typical GFP fluorescence pattern observed for transformation with the C1 cosntruct. GFP
accumulates in the cytoplasm. Arrow is pointing to the nucleus of cells. Left - GFP channel; Middle – Red channel showing chloroplast autofluorescence; Right – merged images. Bars = 10 µm. Magnification = 40x. ... 87
Optimization of transient expression procedures in Catharanthus roseus and Arabidopsis thaliana XXIII Figure 53. Transient transformation of C. roseus protoplasts with an ER located GFP fusion observed
under the confocal microscope. A. Schematic representation of the 35S::SPCrPrx1-GPF-KDEL
construct. GFP is target to, and accumulated in the ER. The arrow is pointing the perinuclear ER. Left - GFP channel; Middle – Red channel showing chloroplast autofluorescence; Right – merged images. Bars = 10 µm. Magnification = 40x. ... 87
Figure 54. Transient transformation of C. roseus protoplasts with the SPCrPrx1-GFP fusion (C2), observed
under the confocal microscope. A. Schematic representation of the 35S::SPCrPrx1-GPF construct
(C2). B. GFP is targeted to an unidentified compartment of the secretory pathway. Arrow points to the perinuclear ER. Left - GFP channel; Middle – Red channel showing chloroplast
autofluorescence; Right – merged images. Bars = 10 µm. Magnification = 40x. ... 88
Figure 55. Transient transformation of C. roseus protoplasts with SPCrPrx1-GFP-CTECrPrx1 fusion (C3),
observed under the confocal microscope. A. Schematic representation of the 35S::SPCrPrx1
-GPF-CTECrPrx1 construct (C3). B. The presence of the CTE of CrPrx1 targets GFP to the central
vacuole, but still is observedl ER acummulation. Left - GFP channel; Middle – Red channel showing chloroplast autofluorescence; Right – merged images. Bars = 10 µm. Magnification = 40x. ... 88 Figure 56. Transient transformation of C. roseus protoplasts with C4 CrPrx1-GFP fusion, observed under
confocal laser-scanning microscopy. A. Schematic representation of the 35S::SPCrPrx1-GPF-MPCrPrx1
construct (C4). B. GFP is targeted to an unidentified compartment of the secretory pathway. Arrow points to the perinuclear ER. Left - GFP channel; Middle – Red channel showing chloroplast autofluorescence; Right – merged images. Bars = 10 µm. Magnification = 40x. ... 89
Figure 57. Transient transformation of C. roseus protoplasts with SPCrPrx1-GFP-MP-CTECrPrx1 fusion (C5),
observed under the confocal microscope. A. Schematic representation of the 35S::SPCrPrx1
-GPF-MP-CTECrPrx1 construct (C5). In this case, GFP also accumulates in the large central vacuole.
Arrow points to the perinuclear ER. Left - GFP channel; Middle – Red channel showing chloroplast autofluorescence; Right – merged images. Bars = 10 µm. Magnification = 40x. ... 89 Figure 58. Transient transformation of C. roseus protoplasts with vacuole control-GFP fusion, observed
under confocal laser-scanning microscopy. A. Schematic representation of the 35S::SPCrPrx1-GPF-
CTPPPhaseolin construct. B. GFP target to the vacuole. Arrow is poiting to a nontransformed cell next
to an undoubtedly transformed cell. Left - GFP channel; Middle – Red channel showing chloroplast autofluorescence; Right – merged images. Bars = 10 µm. Magnification = 40x. ... 90 Figure 59. Quantitative data for PEG-mediated transformation C. roseus protoplasts. A. Cell survival rate
for untransformed protoplasts not exposed and exposed to PEG (without and with PEG,
respectively), and for protoplasts submitted to the complete protocol of transformation with C1 construct. B. Transformation rate of protoplasts with C1 construct. Statistical data calculated from an average of single experiments performed in April and June. ... 91 Figure 60. Transient Transformation of Arabidopsis leaves infiltrated with A. tumefaciens harbouring a
SP2AtPrx34-GFP construct (GV3101), observed under the confocal laser-scanning microscopy. Agrobacterium infiltration was performed in MgCl2 buffer. Left - GFP channel; Middle – Red
Optimization of transient expression procedures in Catharanthus roseus and Arabidopsis thaliana XXIV channel showing chloroplast autofluorescence; Right – merged images. Bars = 10 µm.
Magnification = 40x. ... 92 Figure 61. Transient transformation of C. roseus leaves infiltrated with A. tumefaciens harbouring a
SP2AtPrx34-GFP construct (GV3101), observed under the confocal laser-scanning microscopy. Agrobacterium infiltration was performed in MMA buffer. A. At least one cell appeared
transformed and showing GFP fluorescence mainly in the ER. B. Magnification of the same cell as in A. Bars = 20 µm . Magnification = 40x... 94
Optimization of transient expression procedures in Catharanthus roseus and Arabidopsis thaliana XXV
List of tables
Table 1. Classification of peroxidases. In Welinder 1992. ... 10 Table 2. Main advantages and disadvantages of different TGE techniques. ... 22 Table 3. List of Agrobacterium clones and respective GFP/RFP constructs used to study the vacuolar
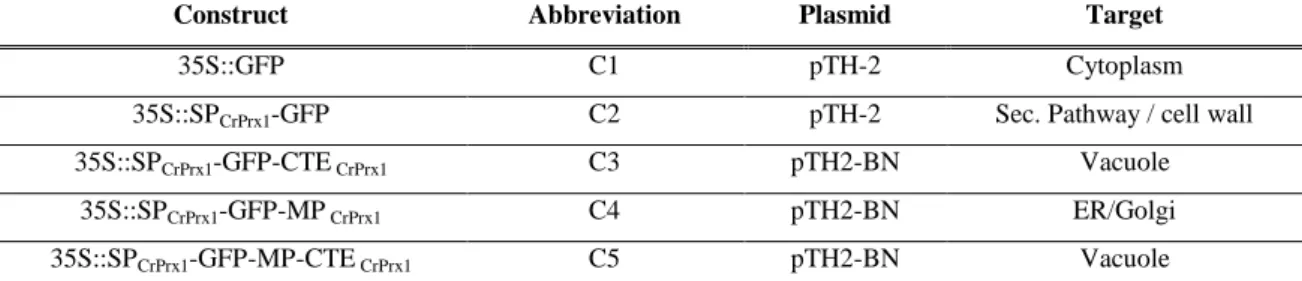
sorting capacity of the CTE of AtPrx34 and CrPrx2. All constructs were under the control of the cauliflower mosaic virus (CaMV) 35S constitutive promoter. ... 34 Table 4. List of GFP-CrPrx1 constructs used for optimization of PEG-mediated transformation of
protoplasts. All constructs were under the control of the CaMV 35S constitutive promoter. ... 35 Table 5. Composition of the restriction reactions performed with constructs C1, C2, C3 and C5 from
Table 4 a. ... 36
Table 6. Digestion reaction performed with AtPrx34 cDNAa. ... 39
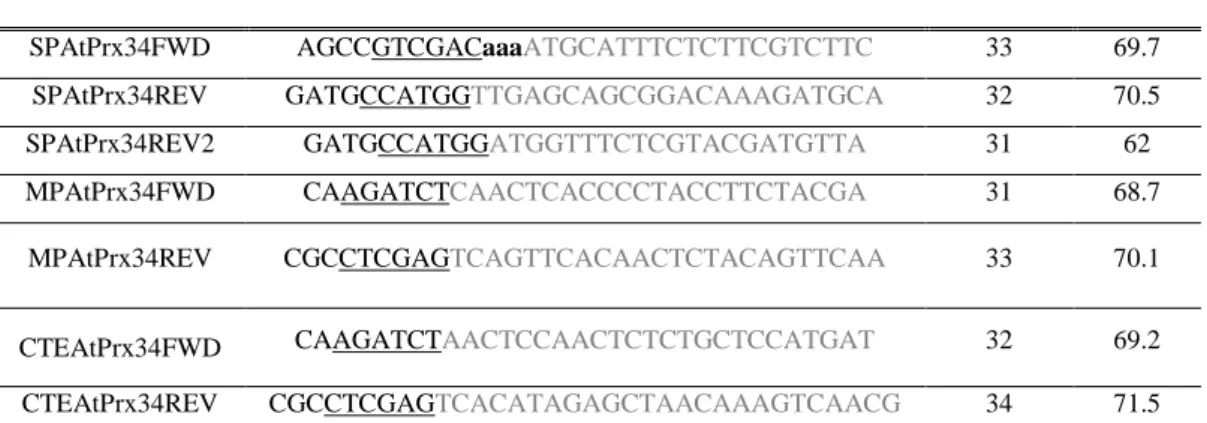
Table 7. Digestion reaction performed with the cloninga. vectors*. ... 39
Table 8. List of primers used to amplify the different AtPrx34 regions to be cloned into pTH2 and pTH2-BN... 40 Table 9. PCR reaction using Taq DNA polymerase. ... 41 Table 10. PCR reaction using Pfu DNA polymerase. ... 41 Table 11. PCR conditions used for amplification of the AtPrx34 SP and CTE. ... 41 Table 12. PCR conditions used for amplification of the AtPrx34 MP and MP-CTE. ... 42
Table 13. Restriction reaction performed with the cloning vectors pTH-2 and pTH2-BN a. ... 43
Table 14. Restriction reaction performed with the AtPrx34 SP a. ... 43
Table 15. Ligation reactions performed in order to clone the AtPrx34 SP1/SP2 at the N-terminus of GFP in pTH2 and pTH2-BN... 43 Table 16. Composition of the restriction reaction performed to the cloning vector (pTH2-BN+SP) and the
PCR purified inserts MP-CTE and MP a. ... 44
Table 17. Composition of the restriction reaction performed to the purified CTE a. ... 44
Table 18. Composition of the ligation reactions performed to clone the CTE, MP and MP-CTE of AtPrx34 at the C-terminus of GFP in pTH2-BN. ... 45 Table 19. Composition of the digestion reaction performed to select the positive clones. ... 46
Optimization of transient expression procedures in Catharanthus roseus and Arabidopsis thaliana XXVI
Short Curriculum vitae
Diana M. da Costa Ribeiro was born in 1987 in Braga, Portugal. She presently lives in Braga and works, as a researcher, in the 3B‟s Research Group (Biomaterials, Biodegradables and Biomimetics), under the supervision of Nuno Neves.
Her background includes a three-year graduation in Applied Biology, by the School of Sciences, University of Minho. She has just submitted her M.Sc thesis on Biotechnology and Bio-Entrepreneurship in Aromatic and Medicinal Plants to the University of Minho, which was fully developed in the Institute for Molecular and Cell Biology (IBMC), Porto, Portugal.
During the last two months of her graduation, Diana M. da Costa Ribeiro worked in the vegetal biology field, under the supervision of Manuel Ferreira. Her work focusing on the in vitro cultures from primary explants and regeneration of Mentha sp., Mentha x
piperita var. piperita L., Mentha spicata var. 'Crispa' L., Mentha pulegium L. and Mentha aquatica L. As well as the chemical characterization of essential oils, isolated
by hydrodistillation, from in vivo plants and in vitro cultures of the same Mentha sp., analyzed by Gas Chromatography (GC) and Gas Chromatography-Mass Spectrometry (GC-MS) techniques.
During the three-year graduation she was involved in several scientific events organized by the Applied Biology students, and attended the most important national meetings organized by biology students, National Meeting of Biology Students, and in 2008 she was part of the commission of biology students that organized the XII National Meeting of Biology Students, in Braga, Portugal.
In 2009 she joined the research group of Plant Peroxidases and Secondary Metabolism (IBMC, Porto) to develop her master thesis, where she worked for a year on the development of new transient expression procedures in Catharanthus roseus and
Arabidopsis thaliana for subcellular localization studies, under the supervision of
Mariana Sottomayor. This work had involved the design and production of the appropriate fluorescent proteins fusions, and the use of transient transformation protocols, PEG-mediated transformation of protoplasts and Agroinfiltration of leaves. As a result of her master research work a paper is being prepared, and is expected to be submit very soon.
Optimization of transient expression procedures in Catharanthus roseus and Arabidopsis thaliana 3
1. Introduction
1.1. Catharanthus roseus: the plant and its clinical uses
Catharanthus roseus is a perennial semi-shrub known as the Madagascar periwinkle,
highly appreciated as an ornamental plant. Linnaeus first published C. roseus as Vinca
rosea, in his “Systema Naturae” in 1759. This species was later published as Catharanthus by George Don in his “General System of Gardening and Botany” (1835)
(Figure 1).
Currently, C. roseus has a pantropical distribution, being naturalized in Africa, America's, Asia, Australia and Southern Europe, and on some islands in the Pacific Ocean (Van Der Heijden et al. 2004).
Figure 1. Flowering plant of Catharanthus roseus (L.) G. Don cv. Little Bright Eyes and respective taxonomic
classification. Adapted from The PLANTS Database (http://plants.usda.gov).
C. roseus has long been used in traditional medicine as an oral hypoglycemic
agent in the treatment of diabetes (Singh et al. 2001), and investigation of this activity ultimately led to the discovery of two anticancer alkaloids present in the leaves of this plant, vinblastine and vincristine (Noble 1990).
The presence of the two anti-tumour alkaloids, vinblastine and vincristine, found in the leaves, together with the accumulation of one alkaloid with anti-hypertensive properties, ajmalicine, found in the roots, justify the extensive investigation performed on this species. Alkaloids are low molecular-weight, nitrogen-containing compounds
Optimization of transient expression procedures in Catharanthus roseus and Arabidopsis thaliana 4 derived mostly from amino acids, usually with basic properties and very often particularly pharmacologically active (Facchini 2001; Ziegler & Facchini 2008).
Vinblastine and vincristine form the so-called Vinca alkaloids together with a few semisynthetic derivatives (Figure 2), and they are mitotic inhibitors that became the first natural anticancer agents to be clinically used, being still an indispensable part of most curative regimens used nowadays in cancer chemotherapy (Van Der Heijden et al. 2004; Sottomayor & Ros Barceló 2006; Loyola-Vargas et al. 2007).
Chemically, vinblastine and vincristine are dimeric terpenoid indole alkaloids differing only in that vincristine has a formyl group at a position where vinblastine has a methyl group (Figure 2). Despite the minor difference in structure between vinblastine and vincristine, a significant difference exists in the spectrum of human cancers that respond to the drugs. Vinblastine is used mainly in the treatment of Hodgkin‟s disease (a type of lymphoma). Vincristine has superior anti-tumour activity compared to vinblastine but is more neurotoxic. It is especially useful in the treatment of leukaemia, and other cancer conditions, including non-Hodgkin‟s lymphomas and breast cancers.
C. roseus also synthesises anti-hypertensive agents such as ajmalicine and serpentine,
which are used to combat heart arrhythmias and to improve the blood circulation in the brain (Sottomayor & Ros Barceló 2006).
Regarding the Vinca alkaloids, these are known to inhibit cell mitosis acting by binding to tubulin, thus preventing polymerization into microtubules and the organization of the mitotic spindle. This mode of action is shared with other natural agents such as colchicine (Dewick 2002; Van Der Heijden et al. 2004; Sottomayor & Ros Barceló 2006; Loyola-Vargas et al. 2007).
Optimization of transient expression procedures in Catharanthus roseus and Arabidopsis thaliana 5
Figure 2. Structure of natural and semi synthetic Vinca alkaloids. Shaded areas indicate the structural
differences from vinblastine. In Sottomayor & Alfonso Ros Barceló 2006.
A major problem associated with the clinical use of vinblastine and vincristine is that only very small amounts of these desirable alkaloids are present in the plant. Although the total alkaloid content of the leaf can reach 1% or more, over 500 kg of dried Catharanthus leaves are needed to yield 1 g of vincristine. Due to this low yield, the extraction is both costly and tedious, requiring large quantities of raw material and extensive use of chromatographic fractionations (Van Der Heijden et al. 2004; Sottomayor & Ros Barceló 2006). Moreover, the greater importance of vincristine over vinblastine as a drug, is not reflected in the plant, which produces a much higher proportion of vinblastine. Those facts stimulated intense investigation in alternative methods for the production of vinblastine and vincristine, like the semi-synthesis of the dimeric alkaloids from the monomers catharanthine and vindoline - produced in C.
roseus at much larger amounts, as well as investigation in the modification of the
molecules aiming a higher specificity (lower toxicity), a higher activity and a different pharmacological profile (Dewick 2002; Van Der Heijden et al. 2004; Sottomayor & Ros Barceló 2006; Loyola-Vargas et al. 2007). The pharmaceutical company Eli Lilly developed several series of derivatives with modifications in the vindoline part of the dimeric structure, producing vindesine (Figure 2). In 1975, Potier and collaborators
Optimization of transient expression procedures in Catharanthus roseus and Arabidopsis thaliana 6 proposed that, in planta, the dimeric vinblastine type alkaloids resulted from the coupling of catharanthine and vindoline and, in light of this hypothesis, they reported for the first time the chemical synthesis of α-3‟,4‟-anhydrovinblastine, later proved to be the first dimeric biosynthetic precursor of vinblastine in the plant (Potier et al. 1975). The group of Potier investigated possible modifications of anhydrovinblastine and produced vinorelbine (Figure 2). Vindesine is a semi-synthetic derivative of vinblastine and has a vincristine-like spectrum of activity, and vinorelbine has a broader anticancer activity with lower neurotoxic side-effects than either vinblastine or vincristine (Dewick 2002; Van Der Heijden et al. 2004; Sottomayor & Ros Barceló 2006). Recently, the pharmaceutical company Pierre Fabre Medicaments developed the highly promising derivative vinflunine which has just been approved for chemotherapy in 2009 (Sottomayor & Ros Barceló 2006; Pierre Fabre SA 2009).
1.2. Biosynthesis of the Vinca alkaloids in C. roseus
Plant cells are considered to be excellent producers of a broad variety of chemical compounds. Many of these compounds are of high economic value such as various drugs, flavours, fragrances and insecticides. These compounds usually play a role in the interaction of the plant with its environment, e.g. as toxins to defend the plant against microorganisms or various predators, as messengers, attractants, repellents. They are called secondary metabolites because they are not directly involved in the normal growth, development, or reproduction of organisms (Facchini 2001; Ziegler & Facchini 2008).
Alkaloids are one of the most diverse groups of secondary metabolites found in living organisms, especially in plants. A great number of alkaloids have been used in medicine and many of them are prominent components of modern drugs organisms (Facchini 2001; Ziegler & Facchini 2008). The alkaloids of C. roseus are terpenoid indole alkaloids (TIAs), which are almost restricted to four plant families of Dicotyledones: Apocynaceae – where C. roseus is included, Loganiaceae, Rubiaceae and Nyssaceae.
C. roseus accumulates more than 100 TIAs (El-sayed & Verpoorte 2007)and the TIA biosynthetic pathway has been extensively studied. It has been shown to involve at least 30 enzymes from primary precursors to vinblastine, from which 12 steps have been characterized at the enzyme and/or gene level (Verpoorte et al. 2007).
Optimization of transient expression procedures in Catharanthus roseus and Arabidopsis thaliana 7 The TIA biosynthetic pathway of C. roseus is extremely intricate, complex and highly compartmentalized inside the cell. A number of enzymes involved in this pathway were shown to be localized in different subcellular compartments. The compartmentalization / localization involved in this metabolic pathway can be considered a regulatory mechanism that plants develop to accomplish the final function of their secondary metabolism, since this location might require the transport of different metabolites from one point to another for its biosynthesis to be completed (St-Pierre et al. 1999). The early stages of the TIA pathway involve the formation of secologanin derived from the terpenoid biosynthesis and its condensation with tryptamine to produce the central intermediate strictosidine [Figure 3; (Facchini 2001; Van Der Heijden et al. 2004; El-sayed & Verpoorte 2007; Roytrakul & Verpoorte 2007; Ziegler & Facchini 2008)].
The enzyme condensing secologanin and tryptamine is strictosidine synthase (STR), and its subcellular localization was determined to be the vacuole (Sottomayor & Ros Barceló 2006; El-sayed & Verpoorte 2007; Roytrakul & Verpoorte 2007; Loyola-Vargas et al. 2007).
Strictosidine is the general precursor of several divergent pathways leading to the multitude of TIAs accumulated by C. roseus (Sottomayor & Ros Barceló 2006). Somewhere, downstream of strictosidine formation, the pathway of TIAs suffers several ramifications mostly uncharacterized. The less characterized branches are the ones leading to catharanthine and vindoline, the monomeric precursors of the Vinca alkaloids, and the ones that will be the discussed here.
The information on catharanthine biosynthesis is very limited. Enzymes and genes involved in the catharanthine pathway have not been isolated or cloned yet, and almost nothing is known about the nature of the enzymes involved in the conversion of cathenamine to catharanthine and tabersonine (Figure 3). On another hand it has been established that tabersonine is transformed into vindoline by a sequence of six steps which are well characterized. These steps include: aromatic hydroxylation, O-methylation, hydration of the 2,3-double bond, N(1)-O-methylation, hydroxylation at position 4 and 4-O-acetylation (Figure 3). The data reported suggest that the route of vindoline biosynthesis is regulated by development and is restricted to the aerial parts of the adult plant, mainly in young leaves and cotyledons. This activity diminishes with age and organ type, and is already low in adult leaves, floral stems, roots and tips
Optimization of transient expression procedures in Catharanthus roseus and Arabidopsis thaliana 8 (Sottomayor & Ros Barceló 2006; El-sayed & Verpoorte 2007; Roytrakul & Verpoorte 2007; Loyola-Vargas et al. 2007; Oudin et al. 2007) .
Figure 3.Compartmentalization of the biosynthetic pathway of terpenoid indole alkaloids in C. roseus cells.
G10H: geraniol 10-hydroxylase; SLS: secologanin synthase; TDC: tryptophan decarboxylase; STR: strictosidine synthase; SGD: strictosidine β-D-glucosidade; T16H: tabersonine 16-hydroxylase; OMT: S-adenosyl - L-methionine : 16-hydroxytabersonine - 16-O-methyltransferase; NMT: S-adenosyl - L-methionine : 16-methoxy - 2,3-dihydro-3-hydroxytabersonine - N-methyltransferase; D4H: desacetoxy vindoline hydroxylase; DAT: acetylcoenzyme A : 4-O-deacetylvindoline 4-O-acetyltransferase; PRX: peroxidase. In Sottomayor & Alfonso Ros Barceló 2006.
The product resulting from the coupling of the monomeric TIAs catharanthine and vindoline is the dimeric α-3‟,4‟-anhydrovinblastine, which is converted into vinblastine (further converted into vincristine), leurosine and Catharine (Figure 4). The coupling process is thought to be catalysed by a class III peroxidase with anhydrovinblastine synthase activity, CrPrx1 (Sottomayor et al. 1998; Sottomayor & Ros Barceló 2003; Sottomayor et al. 2004; El-sayed & Verpoorte 2007; Loyola-Vargas et al. 2007) .
Optimization of transient expression procedures in Catharanthus roseus and Arabidopsis thaliana 9 Figure 4. Structures of vinblastine and vincristine and their precursors. The coupling of catharanthine and vindoline originates an unstable iminium cation that is reduced to yield α-3‟,4‟-anhydrovinblastine. Adapted from Sottomayor et al. 1998.
The laboratory where this thesis was developed described the purification, cloning and characterization of CrPrx1, the only enzyme detected so far with α-3‟,4‟-anhydrovinblastine synthase activity(see section 1.3), and showed that this was the most likely in vivo responsible for the synthesis of anhydrovinblastine (Sottomayor et al. 1998; M. M. R. Costa et al. 2008). This conclusion was based on the confirmation of the same subcellular localization of both CrPrx1, substrates and product of the dimerization reaction - the vacuole. CrPrx1 was shown to belong to the plant branch of the peroxidase superfamily (class III peroxidises), given the visible spectrum of the protein, with maxima at 404, 501 and 633 nm indicative of a high spin ferric heme protein, and its ability to oxidize a range of common phenolic substrate at the expense of hydrogen peroxide (H2O2) (Sottomayor & Ros Barceló 2003; Sottomayor et al. 2004;