Universidade Federal de Santa Catarina www.producaoonline.inf.br
ISSN 1676 - 1901 / Vol. 4/ Num. 3/ Agosto de 2004
Industrial application trends and market perspectives for
virtual reality and visual simulation
Industrial application trends and market perspectives for virtual
reality and visual simulation
Antonio Valerio Netto1 Maria Cristina F. de Oliveira2
Department of Computer Sciences and Statistics Institute of Mathematics and Computer Science - ICMC
University of São Paulo – USP – Campus São Carlos P.O Box 668 - Zip Code 13560-241 - São Carlos, SP, Brazil
Abstract. This paper attempts to provide an overview of current market trends in industrial applications of VR (Virtual Reality) and VisSim (visual simulation) for the next few years. Several market studies recently undertaken are presented and commented. A profile of some companies that are starting to work with these technologies is provided, in an attempt to motivate Brazilian companies into the use of these new technologies by describing successful example applications undertaken by foreign companies.
Keywords. Virtual Reality, Visual Simulation, Market Study, Business Driver, Industrial Applications.
1. Introduction
Market demands naturally evolve along time. To mention just one example, in a recent past the automobile industry had a long product life cycle, little variety of models and a new car was released every 10 years. Currently, it shows a reduced product life cycle, large product variety and a new car is released every 4-6 years. In the future, it will require even shorter product life cycles, a huge variety and increased personalization. Obviously, evolving market demands require changes in the ways products are developed, and therefore companies must search for new mechanisms to support these needs.
In a technological world, Virtual Reality (VR) is expected to be the next “big opportunity”. For engineers, this means that within the next decade designing on a flat computer screen will no longer be the norm. They can expect at least to touch and manipulate a virtual part as they design it, and probably even walk inside and around a projection of the design in progress (Thilmany, 2001).
VR is the intuitively correct man machine interface for all product design process stages. That technology is a fast method to recognize design errors instantly. With VR is possible to have an error reduction, time-gains and cost-reduction. Using a VR system is possible to enable the customers to cut development costs and time; to maintain financial and organizational control of the entire development process and digitally to evaluate product before expensive hardware is created or ordered. A virtual environment enables quick product development and adds quality to the development process, enabling system-based decisions. Industrial applications of VR range from CAD-design, sales, training, production-planning, styling, development and ergonomics studies to visualization of huge and complex data sets (Valerio Netto, 2002). The goal is always to reduce the “time to market“ while keeping high quality. However, VR is not a stand-alone solution, it must be integrated into the process design chain.
1,2
The authors would like to acknowledge the sponsorship of CNPq - The Brazilian Research Funding Agency - (Process 521931/97-5) and FAPESP - The State of São Paulo Research Funding Agency (Process 00/04779-2).
This paper begins to explain what reasons to use new technology (VR) in industrial application. After that, the paper attempts to provide an overview of current market trends in industrial applications of VR for the next few years. Several market studies recently undertaken are presented and commented in Section 3. In Section 4 is to show how it can be implanted VR in the general company. In last Section, there are some remarks about the theme.
2. Industrial application trends
Growing microchip power and falling computer prices have ushered in what some analysts call the next stage in engineering technology, one that brings improved visualization capabilities. The most accessible visualization technology currently in use in large engineering firms is the virtual prototyping software, often used in conjunction with CAD (Computer Aided Design) systems and analysis software. Virtual prototyping allows engineers to test their designs on a computer, rather than by building a physical prototype. Virtual prototypes can simulate real operations, i.e., a computer simulation can predict how a part would act in real world conditions. If the part fails a test or an analysis, engineers can work out how to modify the design in the CAD system in order to produce a second prototype that shows a better performance. Eventually, a physical prototype will be built near to the end of the process to confirm the CAD model.
Figure 1 shows the financial cost of design modifications at the different stages during product development process (blue curve - number of modifications in %). The later a modification is introduced in the project, the more expensive it is. Modifications that cost U$100.000 in the planning phase will cost U$3.675 million in the production phase. VR technology provides an ideal intuitive user interface for all the stages of the product design process because it allows designers to instantly identify design errors. A VR system supports early evaluation of digital products, before expensive hardware is created or ordered, thus reducing the overall cost of design modifications. Therefore, its use may reduce development costs and time and improve financial and organizational control of the entire development process.
Figure 1 – Influence of modifications during product development process.
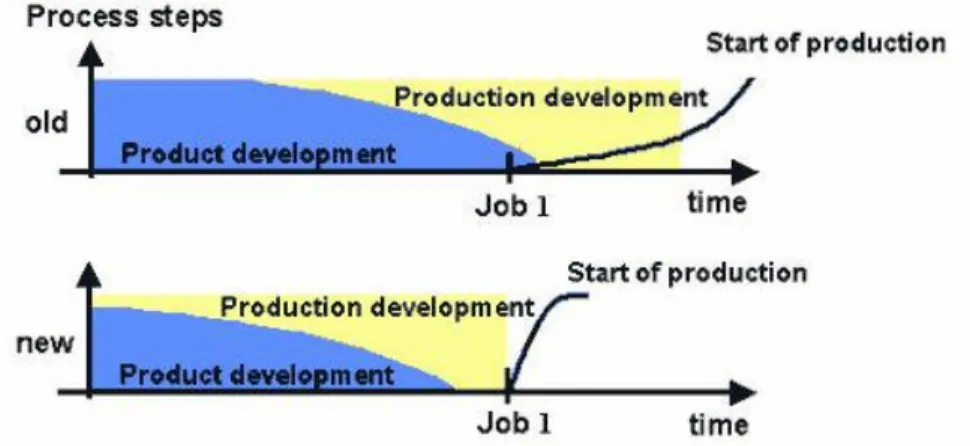
In Figure 2, one can qualitatively compare the elapsed time taken by the steps involved in the "old" (traditional) and "new" (with incorporated VR technology) product development process approaches. In the new approach a completely digital product for “Job 1” can be produced and assembled according to the planned process earlier and with high degrees of precision and quality. It is possible to verify the difference between the old curve (slower to start of production in an ideal way) and the new approach curve.
Typically, design projects involving virtual environments start with models created with Digital Mock-Up (DMU) systems. DMU is an important first step in creating geometric models that will be later used for generating interactive virtual prototypes. Although DMU does not necessarily rely on virtual environments, characteristics such as immersion, interaction and involvement can facilitate and extend the possibilities for testing, analyzing and, later on, modifying the digital prototype. Generally, a 3D model is imported from a 3D CAD software and displayed using special viewing and interaction equipment, in a process known as design review. An interactive design review can also be used as a product presentation tool and as a way to leverage sales. VR support can also speed up and improve quality of design decisions on color and style variation (Valerio Netto, 2002).
3. Virtual Reality/Visual Simulation market
The VR, or Visual Simulation (VizSim), market was valued at U$22.3 billion in 2001, according to CyberEdge, a New York research and marketing firm that covers the industry (Delaney, 2001). The CyberEdge study analyzed the engineering, animation, medical, and architectural industries, and identified, for the first time since 1991, a 17% reduction in the VizSim/VR industry’s growth in 2001. Though more systems are being sold, the average price has declined enough to reduce their gross value. The growth in sales of VizSim/VR systems occurs at the same time that system and component prices are falling, resulting in an overall slowdown in industry revenues.
CyberEdge anticipated that more than 336.000 VizSim systems would be sold worldwide, compared with 203.000 in 2000, an increase of 65%. The majority of these sales take place in North America, with Europe following. The top five applications are: VizSim/VR research, virtual prototyping, postgraduate education (college), museum/exhibition and design evaluation. High-potential applications areas are military training, entertainment, petroleum exploration, security training and virtual prototyping.
Their study identified that the most common display system in VizSim/VR systems is the mono monitor, whereas the CAVE, or Dome, is the least common one. The most common 3D input device is the generic mouse, and the most-used operating system is Windows NT. There are 8.512 companies around the world involved in the VizSim/VR industry, with more than 448.000 people developing or using VizSim/VR. This figure includes over 110.000 hardware and software developers, nearly 232.000 developers of other software or hardware using systems, and more than 186.000 systems end users (Delaney, 2001).
A point to consider when analyzing the numbers of CyberEdge´s market study is that the definition of a VizSim/VR system was left open to the interviewees, which introduces a non-standardization in the answers that might have contaminated their figures. What is considered as a VizSim/VR system by someone may not be considered as so by another.
Another engineering technology market research firm, Daratech, places the market value of virtual prototyping and visualization technologies used in engineering alone at U$1.3 billion. Daratech predicted a growth of almost 20% for 2001. In 2000, in a conservative estimate they had projected a figure of US$ 1 billion in mechanical CAD applications and technologies related to virtual prototyping and visualization.
Penton Digital Media Research (PDMR), the market research firm covering the digital media convergence, software, and graphics workstation markets, announces the release of their market study, entitled 3D Visualization & Simulation, part of the Software Tools & Applications Series. Their market study provides five-year forecasts along with analyses and insight into the market for tools and platforms for creating and operating visualization and simulation content and applications. Market segments covered range from defense and government, design and engineering, industry and business, to medical and scientific. PDMR projects that this market will double in size over the next 4 years – growing from an estimated U$12.6 billion at the end of 2001 to U$24.8 billion by the year 2005, as shown in Table 1. For year 2002 the market for the Design & Engineering segment was estimated in U$2.5 billion; U$489 million for services, U$678 million for software and U$1.3 billion for hardware. For year 2005, the
forecast is that it will reach U$3.7 billion in overall; U$743 million for services, U$1 billion for software and U$1.9 billion for hardware.
2000 2001 2002 2003 2004 2005
Total Revenue U$8.1 bi U$12.6 bi U$16.1 bi U$19.4 bi U$22.3 bi U$24.8 bi
YOY Growth 52% 56% 28% 20% 15% 11%
Table 1 – Revenues from hardware, software, and services related to 3D VizSim (Penton, 2001) (YOY – Year Of Year).
For Machover Associates, the computer graphics industry will keep growing, and overall revenues are expected to grow by 13% Compound Annual Growth (CAG) between 1999 and 2004 (from U$71.7 billion to U$133.7 billion). The 3D segment will grow faster at 20% CAG from U$24.9 billion in 1999 to U$62 billion in 2004. Machover Associates forecasted that revenues worldwide reached U$81.7 billion in 2000 and will grow to U$149.2 billion by 2005. With wider Internet bandwidth and more powerful and cost-effective 3D hardware available, the growth of the 3D segment will be 18% CAG, reaching U$71.3 billion in 2005.
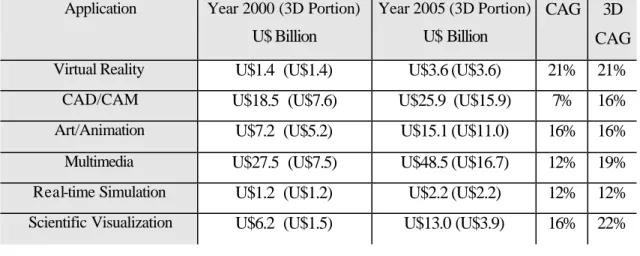
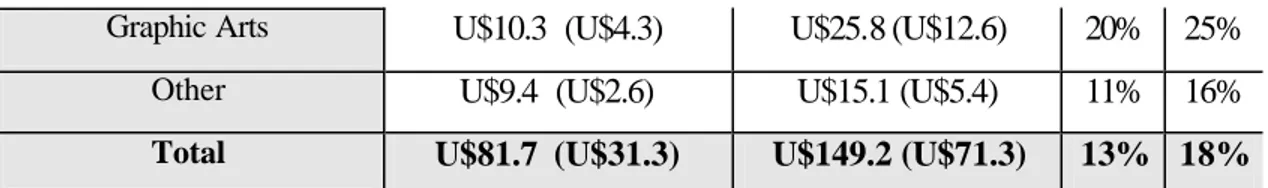
Table 2 shows the worldwide forecast (foreign and US suppliers) for commercial/industrial Computer Graphics (CG) applications (including 3D) for years 2000 to 2005.
Application Year 2000 (3D Portion)
U$ Billion
Year 2005 (3D Portion)
U$ Billion
CAG 3D CAG
Virtual Reality U$1.4 (U$1.4) U$3.6 (U$3.6) 21% 21%
CAD/CAM U$18.5 (U$7.6) U$25.9 (U$15.9) 7% 16%
Art/Animation U$7.2 (U$5.2) U$15.1 (U$11.0) 16% 16%
Multimedia U$27.5 (U$7.5) U$48.5 (U$16.7) 12% 19%
Real-time Simulation U$1.2 (U$1.2) U$2.2 (U$2.2) 12% 12%
Graphic Arts U$10.3 (U$4.3) U$25.8 (U$12.6) 20% 25%
Other U$9.4 (U$2.6) U$15.1 (U$5.4) 11% 16%
Total U$81.7 (U$31.3) U$149.2 (U$71.3) 13% 18%
Table 2 – Worldwide forecast for commercial/industrial CG applications (Machover, 2000).
4. Implanting VR
Introducing VR technology in industrial and commercial environments remains a challenge that demands a proper handling of several questions. Which cautions a company must take when introducing VizSim/VR systems? How much money must be spent on a system and how to properly allocate money amongst people, equipment, contracting professional services, maintenance, etc? There is the migration problem, i.e., which employees will work with VizSim/VR systems? Is it possible to utilize the company´s own employees, and how? Which type of professional services must be contracted? How much preparation a product life cycle or specific process must undergo before receiving the VR technology?
Research accomplished by Whyte (2001) has observed that in all companies that used VR a few individuals acted as visualization specialists. Model creation was not seen as a generic skill to be learnt by all the staff, particularly for the creation of VR models for communication with non-professionals. Three main scenarios for VR adoption were identified:
• In some companies a specialist visualization group (often from the CAD or R&D – Research & Development departments) championed the use of VR;
• In others, the company was involved into a multi-company project on which VR was introduced and used solely by the project staff;
• In other cases the creation of a VR model was commissioned from, or created in collaboration with, a service provider, such as a university or a commercial retailer.
These scenarios are not mutually exclusive and some companies adopted more than one. It is clear that companies organize the use of VR in different ways and adopt
different models for different tasks. For professional tasks, a quite abstract VR model may be used, and the ability to interact with it is more important than image quality. For design reviews with clients and other tasks involving interaction with non-professionals, image quality and the capability of moving around the model in real time are determinant. Such different uses were seen as distinct ones. On a particular project, a company created two separate VR models from CAD data, one to be used for design review (communication with non-professionals) and the other for coordinating detail design (professional use). For example, the first model, for design presentation, showed surface finish and details, whereas the second one, for improving design coordination, incorporated clash detection and engineering.
There are some notable similarities and some significant differences between the findings of these market studies and the academic literature. For example, companies in the construction sector are applying VR to a range of business tasks that go from professional tasks (high cost -hardware, software and service) until non-professionals tasks (low cost) interaction (Whyte, 2001).
In general, industry is using VR mainly at the later design stages, though there is considerable research effort targeted at investigating its use for conceptual design (Valerio Netto, 2002). The industrial scenario is fragmented, the VR´s industrial use appears to be a specialist activity yet.
The divergence between applications being studied in academia and used in industry may be due to a lack of a shared vision for the technology future, or it may be that academic research covers a more long-term focus. However, the use of VR in the R&D department of large companies is often intended to contribute to long-term objectives, rather than to immediate practicalities.
5. Final remarks
Brazilian companies in general still consider with reserve the use of VR technology, mainly due to its high initial cost. It is necessary to acquire or lease proper equipment, as well as modeling and virtual environment integration and development software, and
there is also the cost of training staff and hiring expert labor. Greater industrial investment in this area is also discouraged by a lack of useful literature. There are few published reports of practical experience, and no objective comparisons of VR performance results against traditional approaches in terms of time and cost savings in product development processes.
This picture is changing somehow over the last years due to greater investments and to the emergence of successful cases. Advances in VR research provides increasingly powerful hardware and software tools, and more sophisticated immersion and interaction feelings, thus attracting greater interest from several industrial segments and an increasing number of users and applications. Additionally, reports of successful experiences of using VR in product development processes abroad begin to appear. This is the case of the German Daimler Chrysler, which has the most sophisticated set of graphical computers in the automotive industry at Sindelfingen, namely the Virtual Reality Center (VRC). The use of these new tools led to a cost reduction higher than 20% in a new vehicle modeling project due to the reduction in physical prototypes and model building, in addition to reducing overall development time (Gavine, 2000; Editorial, 2001).
Obviously, acceptance of these new processes and methodologies by engineers and technicians is not immediate, and there is a natural and understandable resistance to change. Therefore, a great effort is necessary in information, publicity, and usage justification for this new technology. The use of virtual systems in a larger scale depends heavily on the evolution of equipment and software technology to increase the number of approaches that can be effectively and precisely simulated, as the credibility of the technique is crucial for the decision of introducing a procedural change.
Acknowledgment
The authors are grateful to Professor Pat Banerjee of the Industrial Virtual Reality Institute (IVRI) of University of Illinois at Chicago (UIC) for many insightful discussions.
References
DARATECH. IT Market Research & Technology Assessment for manufacturing,
Engineering, Construction and Plant Operations, 2001. http://www.daratech.com
(November).
DELANEY, B. The Market for Visual Simulation/Virtual Reality Systems, Fourth edition, CyberEdge information services, September, 2001. http://www.cyberedge.com (November).
EDITORIAL. Virtual Reality, auto style magazine - special edition, Magazine of the dealerships of Mercedes-Benz, Year 1, no. 1, pp. 27-29, 2001. (In Portuguese).
GAVINE, A. Cave men, Testing Technology International, November, pp. 16-17, 2001.
MACHOVER, C. The business of Computer Graphics, IEEE Computer Graphics and
Application, pp. 44-45, January/February, 2000.
PENTON, D. M. R. 3D Visualization & Simulation Market Study, March, 2001. http://www.pentondigital.com/dmr/studies/3dviz. (December).
THILMANY, J. Electronic spelunkers, Mechanical Engineering Magazine, June, 2001. http://www.plmsoluctions-eds.com/publications/articles/me_evis_0701/
(january/2002)
VALERIO NETTO, A. Virtual reality saving time and money in the automotive chain,
Magazine of Automotive Engineering and aerospace, year 2, n. 9, pp. 32-37, Market
WHYTE, J. Business drivers for the use of virtual reality in the construction sector, AVR II and CONVR 2001, Conference at Chalmers, Gothenburg, Sweden, October, 2001.