Ana Rita Alves Pereira de Ferreira Monteiro
Investigating the expression of
genes and proteins in
Glioblastoma during hypoxia
Biomedical Sciences and Medicine Department
Year 2017/2018
Ana Rita Alves Pereira de Ferreira Monteiro
Investigating the expression of
genes and proteins in
Glioblastoma during hypoxia
Master in Oncobiology –
Molecular Mechanisms of Cancer
Work Supervised by:
Dr. Patrícia Madureira, Cancer Biology and Progression Laboratory, Centre for Biomedical Research (University of Algarve) and Brain Tumour Research Centre of Excellence (University of Portsmouth); Dr. Ana Teresa Maia, Centre for Biomedical Research and Department of Biomedical Sciences and Medicine (University of Algarve).Biomedical Sciences and Medicine Department
Year 2017/2018
Investigating the expression of
genes and proteins in Glioblastoma
during hypoxia
Statement of authorship
I hereby declare that I am the author of this work, which is, to the
best of my knowledge and belief, original, except as
acknowledged in the text. Authors and work consulted are
properly cited in the text and listed in the references in the
required format. The material has not been previously submitted,
in whole or in part, for a degree at this or any other university.
_________________________________
Signature
© Copyright: Ana Rita Monteiro
The University of Algarve has the perpetual right, without
geographical boundaries, to archive and publicize this work in
the form of printed copies, in digital form, or by any other
means known or that may be invented, for the release through
scientific repositories and to admit its copying and distribution
for educational or research purposes only, not commercial, as
I
Acknowledgements
I am enormously grateful to my supervisor, Dr. Patrícia Madureira for giving me the wonderful opportunity to work in a such amazing lab as the one from the Brain Tumour Research Excellence center at University of Portsmouth. I am immensely thankful for all the shared knowledge, encouragement and patience, as well the friendship, support and warm welcome in Portsmouth. My wish is that future will bring us to work together again.
A big thank you to Dr. Richard Hill who also supervised, helped and taught me during the 10 months I spend in the laboratory.
I would also like to express my profound gratitude to my co-supervisor Dr. Ana Teresa Maia, who took time from an incredibly busy schedule to assist me with my dissertation. I am truly thankful for the help and attentiveness.
I am extremely grateful to Professor Geoffrey J. Pilkington and everyone in the Brain Tumour Research Excellence center laboratory from University of Portsmouth, for accepting me and giving me the chance to learn and grow as a person and a scientist in a challenging environment.
A big thanks to all my friends in Portsmouth, particularly Mohsen Seifi, Noor Alabdullah and Tarek Zaidieh who gave support and motivation in harder days and who made me feel like at home. I am also enormously grateful to my dear friend Diana Leite for all the help in the laboratory, as well the friendship, companionship, shared laughs and for making my days happier.
I am also immensely grateful to my friends and dear colleagues Juliana Machado and Catarina Martins. Thank you for accommodating me in your office, homes and hearts. A heartfelt gratitude goes to everyone from “Grupeta dos 10 magníficos”, who are indeed the best friends in the world. Thank you for these 8 years of friendship and for all the encouragement words.
II
For all the love and caring, I am infinitely grateful to Daniel Duarte who despite being miles away from me, kept close at all times. You proved there is no distance for love. Most importantly, I am eternally grateful to my parents Elisabete Pereira and Samuel Monteiro who supported me financially through this opportunity, for being by me side at all times and for loving me unconditionally and for making of me what I am today. I owe you all my triumphs. Also, a tremendously heartfelt gratitude to by brother Miguel Monteiro and sister Joana Monteiro.
“Nature is the source of all true knowledge. She has her own logic, her own laws, she has no effect without cause nor invention without necessity.” Leonardo da Vinci
III
Abstract
Glioblastoma multiforme (GBM), grade IV Astrocytoma, is the most common and deadly form of brain cancer. Despite the low incidence rate (3.2 per 100.000 people), patient’s median survival is only 14 months. Notwithstanding all new diagnostic tools, GBM remains a therapeutic challenge, being extremely difficult to prevent recurrence. Therefore, it is essential to conduct research in order to understand the molecular pathways in the core of GBM aggressiveness and swift evolution.
GBM is often characterized by hypoxic regions where oxygen levels are extremely low. As a natural consequence of tumour growth and expansion, some areas of the tumour become distanced from the blood vessels and consequently, from the oxygen supply. In such a critical environment, cells activate pro-survival and malignancy mechanisms such as the metabolic switch, invasion and angiogenesis. Hence we investigated the expression of genes featuring these survival mechanisms and identified a panel of hypoxia-driven-malignancy markers.
To conduct this study, two GBM patient´s biopsy-derived cell lines (UP-029 and SEBTA-023) were used and cultured under hypoxic conditions for a selected set of time-points (time-course). To characterize the hypoxic response of these cells, hypoxia profiler microarrays were ran for normoxia, 6 and 48 hours of hypoxia (1% O2). Once identified the induced and repressed genes, these were analyzed and validated through qRT-PCR assays. Finally, western-blot analysis was performed to detect target proteins and correlate with the previously obtained gene expression data. Our study validated ANGPTL4, PIGF, VEGFA, GLUT1, PFKB4, PFKB3, BNIP3,
DDIT4, NDRG1 and CAIX genes as relevant in GBM’s hypoxia-mediated response.
We also pointed out MXI1, HNF4A genes as likely significant factors in GBM hypoxia. Furthermore, we hypothesize PFKB3 as an adaptive resistance marker in GBM and the repression of TFRC as required mechanism for GBM progression.
IV
Resumo
O Glioblastoma multiforme (GBM) é a forma mais comum e letal de cancro no sistema nervoso central. Devido às suas caraterísticas altamente invasivas e malignas, o Glioblastoma foi considerado pela World Health Organization (WHO) como um Astrocitoma grau IV. Contrariamente a outros tipos de cancro de igual grau, a capacidade de invasão do GBM é limitada ao tecido cerebral.
Apesar dos avanços nas tecnologias de diagnóstico e dos constantes progressos na investigação do cancro, o tratamento do GBM é meramente paliativo. A seletividade farmacológica da barreira hemato-encefálica, a elevada heterogeneidade tumoral e influência destrutiva do tumor no tecido nervoso, refletem-se na ineficiência das terapias aplicadas.
Clinicamente, o GBM manifesta-se através de pressão intracranial, cefaleias e/ou défices neurológicos tais como, alterações visuais, alterações da fala, dificuldades cognitivas e até modificações na personalidade. Embora, menos frequentes, convulsões também se encontram descritas como um dos sintomas.
A taxa de incidência deste tipo de carcinoma é de facto baixa, sendo que em 100000 apenas 3.2 pessoas são afetadas. Não obstante, a média de sobrevida destes pacientes é somente 14 meses. Conduzir investigações no sentido de entender os mecanismos moleculares que se encontrar subjacentes à expansão e agressividade do GBM torna-se, portanto, essencial.
Uma das características mais proeminentes do GBM são as regiões hipóxicas, onde os níveis de oxigénio são extremamente baixos. Esta é uma consequência natural, derivada da expansão tumoral e do incremento da distância de difusão de oxigénio. Estabelecido um microambiente como este, crítico para a sobrevivência celular, as células tumorais ativam mecanismos de malignidade tais como “switch” metabólico, angiogénese e invasão. Desta forma as células adquirem vantagem clonal e capacidade migratória para invadirem zonas de tecido cerebral saudável. Para além do incremento da malignidade, a elevada capacidade invasiva destas
V
células constitui um risco em termos de recorrência. De um modo geral, a hipóxia integra-se como um marcador de mau prognostico.
Para este estudo, duas linhas celulares obtidas através de biópsias de pacientes com GBM (UP-029 e SEBTA-023), foram incubadas a diferentes tempos de hipóxia. Após extração de ácido ribonucleico (ARN), realizou-se um microarray de perfil de hipóxia a três amostras em diferentes condições: normóxia (controlo), 6 e 48 horas. O método do microarray baseia-se na tecnologia de reações de polimerase em cadeia e em tempo real (RT-PCR). Este, por sua vez, é um método de quantificação de expressão génica através da geração de cópias (por ciclo de PCR) a partir de um ADN molde. Isto origina uma correlação entre a quantidade inicial de cópias e a quantidade acumulada a cada ciclo. Desta maneira, foi possível quantificar a expressão génica de 84 genes previamente descritos na literatura como relacionados na resposta hipóxica em diversos tipos de cancro. Este ensaio permitiu-nos identificar em larga escala diversos marcadores de hipóxia que foram diferencialmente expressos com significância. Do painel analisado, destacaram-se os genes
ANGPTL4, NDRG1, CAIX, PFKB4 e VEGFA como relevantemente induzidos tanto
nas UP-029 como nas SEBTA-023. Para além destes, os genes MXI1, HNF4A e
TFRC foram estabelecidos como significativamente sub-expressos durante a hipóxia
nas duas linhas celulares de GBM.
Continuando com a análise, estudámos através de ensaios de RT-PCR quantitativo os vários genes distinguidos acima, tal como outros apenas diferencialmente expressos numa das linhas celulares durante a hipóxia. Cada gene foi analisado em quatro condições diferentes: normóxia, 6, 24 e 48 horas de hipóxia, em pelo menos três corridas diferentes. O método de 2-ΔΔCT foi usado para calcular o
fold-change de cada gene, que nos transmite a magnitude biológica da expressão de
um gene relativamente a um controlo. De modo a estudar a significância estatística dos resultados, usámos Students T-test (tipo 2, cauda 2) para calcular os P-values de cada amostra. Considerámos três níveis de significância para P-values inferiores que 0.05 (*), 0.01 (**) e 0.001 (***).
Desta análise de RT-PCR quantitativo, para além dos genes previamente distinguidos, também os genes PIGF, PDK1, PFKB3, BNIP3, DDIT4 e SLC16A3
VI
foram detetados como significativamente induzidos nas linhas celulares UP-029 e SEBTA-023. Validámos, também, o gene TFRC como significativamente sub-expresso durante a hipóxia.
De modo a analisar a expressão de proteínas de alguns deste fatores, realizaram-se ensaios de Western-blot. Esta é uma técnica vastamente usada em laboratório que permite a identificação de proteínas específicas de uma amostra de proteína total. Este método consiste na separação de proteínas por pesos moleculares através da aplicação de voltagem. Para tal, a amostra proteica é desnaturada através de calor e posteriormente pipetada num gel de eletroforese. As proteínas (carga negativa) migram através do gel na direção do polo positivo, assim que aplicada voltagem. Desta forma, as moléculas menores migram mais rapidamente e facilmente para a base do gel que as de maior peso molecular, que ficam mais próximas do topo. Após separação e transferência para uma membrana de nitrocelulose, é possível sinalizar estas proteínas através de complexos de anticorpos e fluoróforos. Assim, pudemos detetar a expressão proteica de alguns genes de interesse em diferentes condições: normóxia, 1, 2, 3, 6, 24 e 48 horas de hipóxia.
Realizou-se uma análise de expressão proteica de HIF1a para confirmar a indução da resposta hipóxica. Uma vez que é regulado a nível da proteína, foram detetadas, de facto, bandas de HIF1a durante a hipóxia , apesar de não se observarem induções significantes da expressão génica. Como CAIX, foi significativamente expresso a nível do gene, foram também realizados blots para a proteína correspondente. A proteína CAIX foi detetável nas amostras de 6, 24 e 48 horas de hipóxia, especialmente nas células SEBTA-023.
A proteína EGFR, vastamente descrita em GBM, foi também analisada. Curiosamente não foi detetável nas células UP-029, mas sim nas SEBTA-023, em todas as amostras. À semelhança de EGFR, os blots das proteínas UpaR, VEGFC e S100A10 foram também analisados. As proteínas UpaR e S100A10 foram detetadas em ambas as linhas celulares, com distinção nas amostras SEBTA-023. Nas células UP-029 a baixa deteção de proteína pode-se justificar por uma activação mais tardia
VII
da expressão de factores de invasão. Curiosamente a expressão de VEGFC, detetável em ambas as linhas, diminuí em simultaneidade com o aumento de horas de hipóxia.
Em suma, o nosso estudo identificou ANGPTL4, NDRG1, CAIX, PFKB4,
VEGFA, PIGF, PDK1, PFKB3, PFKB4, BNIP3, CAIX, DDIT4, NDRG1 e SLC16A3
como genes significativamente induzidos e HNF4A e TFRC como genes significativamente sub-expressos em GBM. Extrapolámos, que por vezes a indução das expressões de genes e proteínas de invasão é uma resposta tardia após um período considerado crónico de hipóxia. De futuro, deveriam ser estudados tempos de hipóxia mais prolongados, como 72 e 96 horas. Sugerimos, também, PFKB3 como um provável marcador de resistência à terapia, uma vez que já se encontra descrito noutros tumores, e neste estudo foi significativamente induzido. Conjuntamente, propõe-se o TFRC como um possível fator importante no impedimento da progressão do GBM, uma vez que foi sub-expresso nas diferentes análises. Estudos relativos a estes dois genes deverão ser conduzidos no futuro, para confirmar as hipóteses acima. Seria também relevante repetir este estudo aumentando o número de linhas celulares de modo a elevar a sensibilidade da seleção de possíveis novos marcadores de invasão em hipóxia.
Palavras-chave:
Glioblastoma (GBM); Hipóxia; Angiogénese; Glicólise; InvasãoVIII
List of Contents
Acknowledgements I
Abstract III
Resumo IV
List of Figures XII
List of Tables XIV
Glossary XV Chapter I 1 1. Introduction 2 1.1. Glioblastoma classification 3 1.1.1. Primary Glioblastoma 3 1.1.2. Secondary Glioblastoma 5
1.1.3. Molecular classification of Glioblastoma subtypes 10
1.1.3.1. Classical 11 1.1.3.2. Mesenchymal 11 1.1.3.3. Proneural 11 1.1.3.4. Neural 12 1.2. Therapeutic strategies 13 1.2.1. Surgery 13 1.2.2. Radiotherapy 15 1.2.3. Chemotherapy 16 1.2.3.1. Temozolomide 16 1.2.3.2. Carmustine 17
IX
1.2.3.3. Target therapies 18
1.2.3.4. Therapy resistance 19
1.3. Hypoxia in Glioblastoma 21
1.3.1. Hypoxia inducible factors 21
1.3.2. Angiogenesis 22
1.3.3. Metabolic reprogramming 24
1.3.4. Invasion 26
1.4. Study Objective 29
Chapter II 30
2. Material and methods 31
2.1. Ethical Statement 31
2.2. Cell lines and cell culture 31
2.3. Western-blot 31
2.3.1. Preparation of cell lysates for protein extraction 32
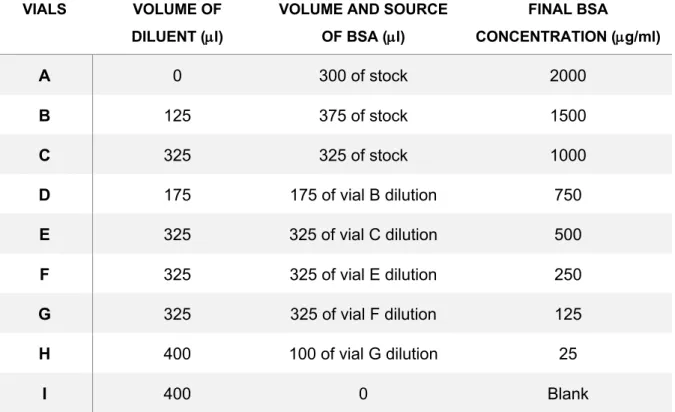
2.3.2. Protein quantification 32
2.3.3. SDS-Page 33
2.3.4. Antibodies 36
2.4. Polymerase chain reaction 37
2.4.1. RNA extraction 37
2.4.2. Hypoxia RT2 profiler PCR array 38
X
2.4.4. Statistical analysis 47
2.4.4.1. Hypoxia RT2 profiler PCR array 47
2.4.4.2. qRT-PCR assay 48
Chapter III 50
3. Results 51
3.1 Investigating the expression of hypoxia genes expression
in UP-029 and SEBTA-023 cell lines 51
3.1.1 UP-029 RT2 hypoxia array analysis 52
3.1.2 SEBTA-023 RT2 hypoxia array analysis 55
3.2 UP-029 and SEBTA-023 qRT-PCR arrays 58
3.2.1 Hypoxia Inducible Factors 1a and 2a expression in GBM 59
3.2.2 Expression of angiogenic factors in hypoxic GBM cells 60
3.2.3 Expression of Metabolic factors in GBM hypoxia 62
3.2.4 Expression of Invasion factors in GBM hypoxia 64
3.2.5 Expression of other factors in GBM hypoxia 67
3.3 Protein expression analysis 69
Chapter IV 72
4. Discussion 73
4.1. Hypoxia profile of the UP-029 and
XI
4.2. Validation of hypoxia differentially expressed genes
in UP-029 and SEBTA-023 Glioblastoma cell lines 75
4.2.1. Hypoxia Inducible Factors 1a and 2a expression
in SEBTA-023 and UP-029 Glioblastoma cell lines 75
4.2.2. Expression of Angiogenic factors in
SEBTA-023 and UP-029 Glioblastoma cell lines 76
4.2.3. Expression of Metabolic factors in
SEBTA-023 and UP-029 Glioblastoma cell lines 77
4.2.4. Expression of Invasion factors in
SEBTA-023 and UP-029 Glioblastoma cell lines 78
4.2.5. Expression of other hypoxia related genes in
SEBTA-023 UP-029 Glioblastoma cell lines 79
4.3 Protein levels analysis in SEBTA-023 and
UP-029 Glioblastoma cell lines 81
Chapter V 83 5. Conclusion 84 Chapter VI 85 6. Future Perspectives 86 Chapter VII 87 7. Bibliography 88 Chapter VIII 96 8. Annex 97
XII
List of Figures
Chapter I
Figure 1.1. PTEN gene cytogenetic location on Chromosome 10. 4
Figure 1.2. PI3K oncogenic pathway, when PTEN is inactivated. 4
Figure 1.3. EGFR induced signaling pathways. 5
Figure 1.4. Comparison of IDH1 Wild-type (wt) with IDH1 Mutant. 6
Figure 1.5. Mutated IDH1 generates 2-HG which by inhibiting TET
and KDMs leads to genome hypermethylation. 7
Figure 1.6. TP53 Wild-Type tumour suppressor pathway 8
Figure 1.7. The role of the 3-hits theory 10
Figure 1.8. The 4 molecular classifications of GBMs 12
Figure 1.9. Clonal evolution theory 19
Figure 1.10. HIFα regulation in normoxia 22
Figure 1.11. Hypoxia mediated invasion in Glioblastoma 28
Chapter II
Figure 2.1. RT2 Profiler PCR array plate format. 40
Figure 2.2. qRT-PCR array plate mastermixes distribution 45
Figure 2.3. qRT-PCR assay plate format. 46
Chapter III
Figure 3.1. UP-029 6 hours (group 1) hypoxia time-point
XIII
Figure 3.2. UP-029 48 hours (group 2) hypoxia time-point
RT2 profiler PCR array 54
Figure 3.3. SEBTA-023 6 hours (group 1) hypoxia time-point
RT2 profiler PCR array 56
Figure 3.4. SEBTA-023 48 hours (group 2) hypoxia time-point
RT2 profiler PCR array 57
Figure 3.5. UP-029 qRT-PCR assay: a. HIF1a and b. HIF2a 59
Figure 3.6. SEBTA-023 qRT-PCR array: a. HIF1a and b. HIF2a 59
Figure 3.7. UP-029 qRT-PCR array: a. VEGFA, b. VEGFC,
c. VEGFD, d. ANGPTL4 and e. PIGF 60
Figure 3.8. SEBTA023 qRT-PCR array: a. VEGFA, b. VEGFC,
c. VEGFD, d. ANGPTL4 and e. PIGF 61
Figure 3.9. UP0-29 qRT-PCR array: a. Glut1, b. LDHA,
c. HK2, d. PDK1, e. PFKB3 and f. PFKB4 62
Figure 3.10. SEBTA-023 qRT-PCR array: a. Glut1, b. LDHA,
c. HK2, d. PDK1, e. PFKB3 and f. PFKB4 63
Figure 3.11. UP0-29 qRT-PCR array: a. UPa, b. UPaR,
c. AnnexinA2, d. S100A10, e. MMP2, f. PAI1, and g. MMP9 64
Figure 3.12. SEBTA-023 qRT-PCR array: a. UPa, b. UPaR,
c. AnnexinA2, d. S100A10, e. MMP2, f. PAI1 and g. MMP9 65
Figure 3.13. UP-029 qRT-PCR array: a. BNIP3, b. CAIX,
c. DDIT4, d. EGR1, e. NDRG1, f. SLC16A3, and g. TFRC 67
Figure 3.14. SEBTA-023 qRT-PCR array: a. BNIP3, b. CAIX,
c. DDIT4, d. EGR1, e. NDRG1, f. SLC16A3, and g. TFRC 68
XIV
List of Tables
Chapter I
Table 1.1. The 4 molecular classifications of Glioblastomas 12
Table 1.2. Karnofsky performance status 14
Table 1.3. Genomic alterations and example of targeted therapies 18
Chapter II
Table 2.1. Dilution Scheme of Diluted Albumin (BSA) standards. 33
Table 2.2. Running gel formulation 34
Table 2.4. List of primary antibodies 36
Table 2.5. List of secondary antibodies 37
Table 2.6. Genomic DNA elimination mix 39
Table 2.7. Reverse-transcription mix. 39
Table 2.8. List of Hypoxia related and housekeeping genes
analyzed by the RT2 profiler array 41
Table 2.9. PCR components mix for 96 well array format 43
XV
Glossary
A
ADM: Adrenomedullin AIIt: AnnexinA2-S100A10 heterotetramerANGPTL4: Angiopoietin like 4
Apaf-1: Apoptotic protease activating
factor 1
APS: Ammonium persulfate ATP: Adenosine triphosphate ATRX: Alpha-thalassemia/mental
retardation X-linked syndrome protein
B
BCA: Bicinchoninic acid Bcl-2: B-cell lymphoma 2
BNIP3: BCL2 Interacting protein 3 BTR: Brain tumour research centre
C
CAIX: Carbonic anhydrase IX cAMP: Cyclic adenosine
monophosphate
cDNA: Complementary DNA CDKN: Cyclin-dependent kinase
inhibitor
CDK4: Cyclin-dependent kinase CD133: Prominin-1
CNS: Central nervous system
CT: Cycle threshold
CTCF: CCCTC-binding factor CTV: Clinical target volume
D
DDIT4: DNA-damage-inducible
transcript four
DMEM: Dulbecco’s modified eagle’s
medium
DNA: Acid deoxyribonucleic
E
ECM: Extracellular matrix EGFR: Epithelial growth factor
receptor
EGLN2: Egl nine homolog 2 EGR1: Early growth response 1 EMT: Epithelial-to-mesenchymal
transition
EPO: Erythropoietin
ERK: Extracellular signal-regulated
kinase
E2F: E2 factor
F
FBS: Fetal bovine serum
FDA: Food and drug administration F3: Coagulation factor III
XVI
G
GABRA1: Gamma-aminobutyric acid receptor GADP: Glyceraldehyde-three-phosphate GBM: GlioblastomaG-CIMP: Glioma CpG island
methylator phenotype
GDC: Genomic DNA contamination gDNA: Genomic DNA
GLUT: Glucose transporter GSC: Glioblastoma stem cell GTV: Gross tumour volume
H
HBSS: Hank’s balanced salted
solution
HDAC1: Histone deacetylase HIF: Hypoxia inducible factor HKG: Housekeeping genes HK2: Hexokinase 2
HMOX1: Heme-oxygenase one HNF4A: Hepatocyte nuclear factor 4
alpha
HPRT: Hypoxanthine
phosphoribosyltransferase 1
I
IDH1: Isocitrate dehydrogenase 1 IER2: Immediate early response 2
K
KDM: Lysine histone demethylases Klf4: Kruppel-like factor 4
KPS: Karnofsky performance scale
L
LDHA: Lactate dehydrogenase A LOH: Loss of heterozygosity LOX: Lysil oxidase
M
MAPK: Mitogen-activated protein
kinase
MDM2: Mouse double minute 2
homolog
MET: Hepatocyte growth factor
receptor
MEK: Methyl ethyl ketone
MGMT: O6 –methylgunine-DNA
methyltransferace
MMP: Matrix metalloproteinase mRNA: Message acid ribonucleic MTIC:
5-(3-methyltriazen-1-yl)imidazole-4-carboxamide
mTOR: Mammalian target of
rapamycin
XVII
N
NADPH: Nicotinamide adenine
dinucleotide phosphate dehydrogenase
NDRG1: N-myc downstream regulator
1
NEFL: Negative elongation factor Neurod1: Neurogenic differentiation 1 NF-Kb: Nuclear factor kappa B
NF1: Neurofibromatosis 1 Ngn: Neurogenin
NRES: National research ethics
service
NRP: Neuropilin
O
O2: Oxygen
Oct4: Octamer-binding transcription
factor four
ORs: Organs at risk
P
PBS: Phosphate Buffered Saline PCNA: Proliferating cell nuclear
antigen
PDGFR: Platelet-derived growth factor
receptors PDK1: Pyruvate Dehydrogenase Kinase 1 PFKB: 6-phosphofructo-2kinase/fructose-2,six-biphosphate PI3K: Phosphatidylinositol-4,5-bisphosphate 3-kinase
PLAU: Plasminogen Activator
Urokinase
PLGF: Placenta growth factor PPC: PCR positive controls
pRB: Phosphorylated retinoblastoma PTEN: Phosphatase and Tensin
Homolog
PTV: Planning target volume PHD1-3: Prolyl hydroxylases 1-3 P21: Protein 21
R
RIN: RNA Integrity Number
RISC: Recurrence-initiating stem-like
cancer
ROS: Reactive Oxygen Species RNA: Acid Ribonucleic
RTC: Reverse transcription control RT-PCR: Real-time
Reverse-Transcription Polymerase Chain Reaction
S
SDS: Sodium dodecyl sulphate
SDS-PAGE: Sodium dodecyl sulphate
poly-acrylamide gel
SERPINE1: Serpin Peptidase Inhibitor
Clade E
SOX2: Sex determining region Y-box 2 SYT1: Synaptotagmin-1
XVIII
T
TBS-T: Tris-buffered saline-tween20 TEMED: N, N’,
N’-Tetramethylethylenediamine
TET: Ten-Eleven translocation TFRC: Transferrin receptor
TNFRSF1A: Tumour necrosis factor
receptor 1A
tPA: Tissue type-plasmin activator TP53: Tumour protein 53
TRADD: Tumor necrosis factor
receptor type 1-associated death domain
U
uPA: Urokinase type-plasmin activator uPAR: Urokinase type-plasmin
activator receptor
USF2: Upstream transcription factor 2
V
VEGF: Vascular endothelial growth
factor
VEGFR: Vascular endothelial growth
factor receptor
VHL: Von Hippel-Lindau
W
WHO: World Health Organization WT: Wild-type
Others:
a-KG: a-Ketoglutarate
2-HG: 2-hydroxyglutarate
1,3BPG: D-1,2-bisphosphoglycerate ∆∆CT: delta-delta cycle threshold
CHAPTER I
INTRODUCTION
2
1. Introduction
Glioblastoma (GBM) is the most common form of brain cancer, with its origin in glial cells or neural stem cells from the central nervous system (CNS) (Lombardi & Assem, 2017). Due to its highly invasive and aggressive nature, GBM is classified by the WHO (World Health Organization) as a grade IV Astrocytoma (Gupta & Dwivedi, 2017). Unlike other grade IV malignancies, GBM invasiveness seems to be exclusive to the brain microenvironment. Nevertheless, the destructive influence on brain tissue, and the heterogeneity of the tumour and its associated microenvironment, constitute great obstacles for the efficacy of current therapies (Lombardi M, Assem M, 2017). In fact, within all human tumours, GBM is considered one of the most lethal and difficult to treat (Paolillo, Boselli, & Schinelli, 2018).
The clinical presentation of GBM may vary depending on the location of the tumour. The most common symptoms include increased intracranial pressure, headache and focal or progressive neurologic deficits. Nearly 25% of the patients have seizures as an early event, while at a later stage close to 50% suffer from this symptom (Davis, 2016).
The known risk factors for GBM are ionizing radiation and genetic diseases. Patients that undergo therapeutic radiation for another tumour or condition may be affected in the future by a radiation-induced GBM. Also, there is an increased risk of GBM in patients suffering from genetic diseases such as neurofibromatosis 1 and 2, tuberous sclerosis, Li-Fraumeni syndrome, retinoblastoma and Turcot Syndrome. Approximately 1% of GBM patients are known to have a hereditary disease. Environmental exposures to chemicals such as smoking, pesticides, petroleum refining, etc. may also be correlated to GBM (Davis M, 2016). Electromagnetic fields and nonionizing radiation from cell phones were not proved to lead to GBM development (Davis M, 2016).
GBM incidence is slightly higher in men than women, as well as in Caucasians as compared to other ethnicities. The average incidence rate is 3.2 per 100.000 people. The median survival after surgery and chemotherapy acknowledged by population-based studies is only 14 months (Delgado-López & Corrales-García, 2016;
3
Davis M, 2016). Even though more common in advanced ages (median 64 years old), GBM may occur at any age. In fact, GBM is the most common pediatric solid tumour. The prognosis in children is slightly better than in adults, due to biological dissimilarities, however it still remains poor (Das K & Kumar R, 2017; Davis M, 2016). Despite all treatment efforts, about 70% of GBM patients experience disease progression within one year of diagnosis and less than 5% (adulthood GBM) and 20% (pediatric GBM) survive five years after the diagnosis. Indeed, second line treatments are basically palliative care in order to optimize life quality (Das & Kumar, 2017; Davis, 2016).
Despite all new diagnostic tools, GBM remains the most deadly type of malignant brain tumour with a very low median survival rate (Monteiro, Hill, Pilkington, & Madureira, 2017). Nowadays, the inability to predict sensitivity or resistance to therapies as well the challenge of achieving an optimal CNS bioavailability lead to an unfortunate scenario for GBM patients (Lombardi M, Assem M, 2017). Studies regarding this disease are imperative in order to improve prophylaxis, early diagnosis, prognosis and treatment prediction to lead to a better outcome. Moreover, understanding the molecular pathways in the core of GBM aggressiveness and swift evolution may be half way towards a paradigm change (Lombardi M, Assem M, 2017).
1.1 Glioblastoma classification
GBM can be assembled into two distinct groups: primary and secondary. Primary GBM, most common (approximately 90% of all cases), develop from a glioma precursor cell without evidences of precursor lesions. On the other hand, secondary GBM is the consequence of a lower-grade glioma (e.g. Grade II astrocytoma) progression. While primary GBM is more common in elderly, secondary GBM manifests preferentially in younger patients. Although histologically similar, primary and secondary GBMs are differentiated by distinct genetic and epigenetic landscapes (Ohgaki & Kleihues, 2013).
1.1.1 Primary Glioblastoma
Primary GBMs are typically characterized by PTEN mutations, loss of chromosome 10 and overexpression of the Epithelial Growth Factor receptor (EGFR) (Ohgaki & Kleihues, 2013). Although the loss of heterozygosity (LOH) of chromosome 10q may
4
be found on both GBM types and linked to loss of PTEN in the secondary tumours, spontaneous mutations of PTEN are exclusive of primary GBM (Mansouri, Karamchandani, & Das, 2017). The LOH of chromosome 10 represents by itself a poor molecular prognosis marker. Indeed, this loss can, in some cases, be linked with the
PTEN inactivation, since this tumour suppressor gene cytogenetic location is 10q23.3,
as illustrated on Figure 1.1 (Balesaria et al., 1999).
PTEN (Phosphatase and tensin homolog) mutation is believed to be an early
event of glioma carcinogenesis (Feng et al., 2016). When lacking this protein, PI3K/AKT/mTOR pathway becomes constitutively activated, leading to an immortal path of uncontrolled growth and survival. PTEN, as the major regulator of this pathway (shown in Figure 1.2), is a key tumour suppressor and as such its inhibition fuels the carcinogenesis process (Chalhoub & Baker, 2009).
PT EN g en e q2 3. 3
Figure 1.1. PTEN gene cytogenetic location on Chromosome 10. Schematic representation of
chromosome 10, highlighting the location of the PTEN gene in red. Adapted from https://ghr.nlm.nih.gov/gene/PTEN/location.png RHEB PTEN PI3-kinase PIP 2 P P PIP 3 P P P PDK1 AKT TCS1 TCS2 mTORC1 Cell Survival Cell metabolism Cell Proliferation Cell Growth Inhibitory pathway Inductor pathway Inactivated pathway Oncogenic Pathway Tumour Suppressor Pathway
Figure 1.2. PI3K oncogenic pathway, when PTEN is inactivated. When PTEN protein is
inactivated PIP3 remains active. This will lead to and over-activation of the mTOR that signals for cell survival, metabolism, proliferation and growth.
5
Along with PTEN loss, the EGFR over-activation is intimately related with cell survival, proliferation and invasion pathways, which constitute imperative hallmarks for cancer progression. Indeed, this protein is overexpressed in ~60% of primary GBMs, featuring a more aggressive phenotype (HONGSHENG et al., 2017). This membrane receptor signals to some of the most important oncogenic pathways, the MAPK/ERK and the PI3K/AKT/mTOR pathways, both illustrated on Figure 1.3.
Nearly 88% of gliomas develop alterations in the MAPK/ERK pathway, which is translated in a poor survival prognosis. Moreover, this signaling pathway is also known to lead to increased therapy resistance (Pandey, Bhaskara, & Babu, 2016). Additionally, the over-activation of the PI3K/AKT/mTOR pathway is also a poor prognostic marker (X. Li et al., 2016). Not only the lack of PTEN contributes for the abnormal PI3K activity, constitutively active EGFR also induces this pathway. In fact, both EGFR and PTEN mutational events seem to be harbored in a significant number of GBMs as mutually inclusive genetic events (Arif et al., 2015).
1.1.2 Secondary Glioblastoma
Secondary GBM mutational landscapes frequently show TP53 and ATRX loss, chromosomes 1p and 19q co-deletion and Isocitrate dehydrogenase 1 (IDH1) mutations. Indeed, IDH1 mutation is a well-established molecular marker of all secondary GBMs, while TP53, ATRX mutations and co-deletion of both chromosomes
Figure 1.3. EGFR induced signaling pathways. EGFR induces two oncogenic pathways, when
mutated, which leads to overactivation of the RAS-RAF-MEK-ERK and AKT-mTOR signaling chains. Inhibitory pathway Inductor pathway Inactivated pathway Oncogenic Pathway Tumour Suppressor Pathway RAF RAS GTP MEK ERK1/ 2 EGFR RHEB PTEN PI3-kinase PIP P P PIP P P P PDK1 AKT TCS1 TCS2 mTORC1 SOS
6
1p and 19q depend on the type of precursor tumour. TP53 and ATRX loss are mutational marks of an astrocytoma precursor. On the other hand, loss of chromosomes 1p and 19q are typical of oligodendrogliomas (Mansouri, Karamchandani, & Das, 2017). More than a molecular marker, IDH1 mutations are of great clinical significance since they represent a better prognosis (Cohen A, Holmen S & Colman H, 2013).
Mutations targeting IDH1 result in the loss of this enzyme normal activity. While in the healthy system, this protein has the catalytic function of producing a-Ketoglutarate (a-KG) and NADPH, in a tumour environment, mutated IDH1 produces 2-hydroxyglutarate (2-HG) and NADP+, as exhibited in figure 1.4.
NADPH is a very important metabolite for proliferation, since it is involved in cellular processes such as defense against oxidative stress, glycolysis and synthesis of fatty acids. However, IDH1 mutations result in a decrease of NADPH cellular levels as this molecule acts as an electron donor to produce 2-HG. It is not yet clear if the reduced levels of this metabolite is the reason why secondary GBMs have a slower tumour growth rate (Yang, Ye, Guan, & Xiong, 2012). Since NADPH is a critical metabolite for the cellular detoxifying process against Reactive Oxygen Species (ROS), this could also be a possible cause for mutated IDH1 better prognosis (van Lith et al., 2014).
Similarly, α-KG plays an important role in GBM tumour cell metabolism. As the only structural difference between α-KG and HG molecules is the replacement of the 2-ketone group for a hydroxyl group. This leads to 2-HG acting as a competitive antagonist. This results in the inhibition of many a-KG-dependent dioxygenases, such as lysine histone demethylases (KDMs) and Ten-Eleven Translocation (TET) family of
Mutant: 2-HG NADP+ NADPH Isocitrate Wild-Type: a-KG NADP+ NADPH IDH1 IDH1
Figure 1.4. Comparison of IDH1 Wild-type (wt) with IDH1 Mutant. The catalytic reaction lead by wt
IDH1 has as products NADPH and a-KG. When mutated, NADP+ and 2-HG are the catalytic products.
7
DNA hydroxylases. In this way high 2-HG concentrations in GBM cells lead to a global DNA hypermethylation phenotype, illustrated in Figure 1.5, altering gene expression and inhibiting differentiation (Maus & Godefridus, 2017).
Although not yet clear how IDH1 mutations are translated into better outcomes, the hypermethylated phenotype resultant from IDH1 mutations may be a main reason by affecting the expression of DNA repair proteins (such as MGMTs), leaving cells vulnerable to DNA alkylating therapeutics. Additionally, the fact that mutated IDH1 lacks the ability to reverse 2-HG or a-KG into Isocitrate, as illustrated in Figure 1.4, may also be related with a better outcome. Isocitrate is a substrate to generate citrate for lipid synthesis, central in cell proliferation and maintenance. Therefore, low levels of citrate may have a great impact on cell survival (van Lith et al., 2014).
Even though IDH1 is a central molecular marker for the identification of secondary GBMs, there are more mutational hints in these tumour landscapes. Not only these hints may characterize a tumour as a secondary GBM, it might even represent evidences of a specific precursor tumour.
Astrocytomas are brain tumours with origin in the star-shaped brain glial cells called astrocytes (Killela et al., 2013). As mentioned before, TP53 and ATRX losses
Figure 1.5. Mutated IDH1 generates 2-HG which by inhibiting TET and KDMs leads to genome hypermethylation. This will result in altered gene expression and inhibition of differentiation.
Isocitrate a-KG 2-HG WT IDH1 Mutated IDH1 TET KDMs
Hypermethylated DNA • Altered Gene Expression • Inhibition of differentiation Inhibitory pathway Inductor pathway Inactivated pathway Oncogenic Pathway Tumour Suppressor Pathway
8
are both common in astrocytomas. Indeed, the loss of TP53 is one of the most frequent and earliest mutations in the developing astrocytoma. This early event results of a mutation G:C®A:T on the CpG sites that mostly occur in the hotspot codons 248 and 273 (Ohgaki & Kleihues, 2007). In its wild-type form, TP53 is a transcription factor activated when DNA damage is detected in the cell cycle. Subsequently, this protein is involved in processes such as the regulation of cell cycle arrest and apoptosis, illustrated in Figures 1.6a and 1.6b (Sionov & Haupt, 1999).
Figure 1.6. TP53 Wild-Type tumour suppressor pathway for: a. cell cycle arrest TP53 arrests the
cell cycle in the G1 phase by inducing the expression of P21. When inhibiting CDKs via P21, pRB maintains itself in a hypophosphorylated state, sequestering E2F transcription factor. E2F is repressed, as well the transcription of its target genes required for the transition to S phase. Additionally, pRB recruits HDAC1 which promotes the compaction of the nucleosomes to prevent transcription. P21 is
a.
b.
Inhibitory pathway Inductor pathway Inactivated pathway CDK s pRB E2F P P HDAC1 Nucleosomes Compaction polymerased
DNA damage P21 transcription PCNATP53
Noxa Transcriptional activation Bcl-2 PUMA Cytochrome C Bax Bax Mitochondria Bax PUMA Apoptosome Apaf-1 Pro-Caspase 9 Caspase 9 (Activation) Pro-Caspase 3 Caspase 3 (Activation) ApoptosisTP53
9
also able to halt cellular growth by preventing PCNA (Proliferating Cell Nuclear Antigen) from activating DNA polymerase d, central in DNA replication (Sionov & Haupt, 1999); b. cell apoptosis TP53 also induce apoptosis if the DNA damage is too extensive or irreversible. Bax releases cytochrome c from the mitochondria, subsequently activating caspase-9 (Haupt S., Berger M., Goldberg Z., & Haupt Y., 2003). PUMA encodes for two proteins: PUMA-a and PUMA-b that bind to Bcl-2 to release cytochrome c and induce cell death in a c/Apaf-1-dependent way (Nakano & Vousden, 2001). When released by Bax and PUMA proteins, cytochrome c binds to the Apoptotic Protease Activating Factor 1 (Apaf-1) forming the Apoptosome. This complex triggers Pro-Caspase 9, turning it into Caspase 9 (activated form), which will in its turn trigger Pro-Caspase 3 (into Caspase 3), finally leading to apoptosis (Ooi & Ma, 2013). Lastly, Noxa has been indicated as functioning through an analogous pathway to Bax (Shibue et al., 2003).
ATRX (alpha-thalassemia/mental retardation X-linked syndrome protein), member of the SN2 family of chromatin-remodeling proteins, has a key role in gene expression regulation. This protein exists in two isoforms which take part in the maintenance of the stability of the genome and chromatin structure at telomeres (Hoelper, Huang, Jain, Patel, & Lewis, 2017; Jones et al., 2017). Although ATRX role in gliomas is not yet fully understood, low expression levels of this protein have been linked with tumours which overexpress genes involved in signal transduction (GTP-related) as well as in transport, modification, and ubiquitination of proteins (Jones et al., 2017). Moreover, tumours with this mutation exhibit lengthening of the telomeres (Hoelper et al., 2017).
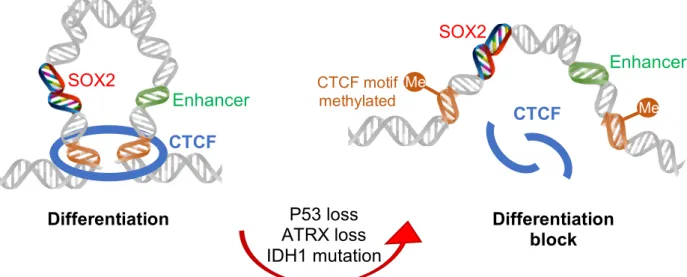
It has been shown that ATRX and TP53 loss, alongside with IDH1 mutations are the 3 oncogenic hits required to arrest astrocytoma stem cells differentiation. This event promotes gliomaneogenesis by maintaining these cells in a perpetual self-renewing and invasive state. SOX2 was identified as downregulated in tumours harboring these 3-hits. SOX2 expression depends on the CTCF-dependent chromatin loop to be able to reach its enhancer 700 kb downstream. However, the 3 P53-ATRX-IDH1 hits induce the hypermethylation of the CTCF motifs which flank the SOX2 locus, meaning that the loop is disrupted, clarified in Figure 1.7 (Modrek et al., 2017).
10
Although SOX2 is mainly known for its role in promoting pluripotency, in the brain it may promote the transcription of pro-neurogenic factors such as Neurod1, Ngn1 and Ngn2 (Amador-Arjona et al., 2015). Downregulation of SOX2 was shown to be concurrent with downregulation of these pro-neurogenic genes, which may explain the differentiation blockage (Modrek et al., 2017).
Secondary GBMs may also evolve from an oligodendrioma precursor. This rare type of glioma (<4%) has origin in the oligodendrocyte cells which give support and insulation to the axons in the CNS. Classically, oligodendrogliomas feature loss of heterozygosity for chromosome arms 1p and 19q as a result from an aberrant translocation t (1:19) (q10:p10). This molecular marker, besides its origin identification purpose, is of a high clinical significance since it seems to be associated with sensitivity to chemotherapy and improved outcome (Wesseling, Van Den Bent, & Perry, 2015). Simultaneous loss of 1p and 19q alleles is indeed one of the earliest events in the majority of oligodendrogliomas. Such fact suggests that this genetic modification confers a selective growth advantage to oligodendroglioma cells. However, it is yet unknown which underlying molecular mechanisms are implicated in tumour progression (Reifenberger & Louis, 2003).
1.1.3 Molecular Classification of Glioblastoma Subtypes
Regardless of their primary or secondary origin, GBMs can be categorized into 4 molecular subtypes: classical, mesenchymal, proneural and neural. This molecular classification of GBMs is based in mutational patterns that bear a resemblance with
CTCF Me M M Me SOX2 Enhancer CTCF motif methylated P53 loss ATRX loss IDH1 mutation Differentiation Differentiation block SOX2 Enhancer CTCF
Figure 1.7. The role of the 3-hits theory, which will lead to the maintenance of the pluripotency
11
the expression profiles of their putative cells of origin (Verhaak et al., 2010). Mesenchymal tumours are enriched with both mesenchymal and astroglial signatures. While, proneural tumours have a clear sign of an oligodendrocyte development (Alcantara Llaguno & Parada, 2016). The neural subtype has an alignment of genes which functions are related with the nervous system function and development. On the other hand, similarly to the mesenchymal subtype, classical tumours have stem cell markers (Lombardi & Assem, 2017). Each subtype is associated to a singular molecular signature, indicative of the cell of origin. Yet, the clinical and scientific significance of this categorization relies not in the cell of origin but in the mutational markers of each tumour type that may or not confer a better prognosis and an enhanced therapeutic response. Distinctive mutated molecular pathways may establish advantages or disadvantages in terms of therapy response (Verhaak et al., 2010).
1.1.3.1 Classical
The classical subtype commonly characterized by the amplification of chromosome 7 paired with loss of chromosome 10, features the amplification of EGFR and loss of PTEN and CDKN2A (Lombardi & Assem, 2017; Verhaak et al., 2010).
1.1.3.2 Mesenchymal
Mesenchymal tumours similarly to the classical subtype, harbor the amplification of chromosome 7 and loss of chromosome 10, amplification of EGFR and loss of
PTEN. However, this subtype has the particularity of NF1 mutations and
overexpression of the tumour necrosis factor pathway genes TRADD, RELB and
TNFRSF1A (a potential consequence of the high overall necrosis associated with this
class) (Lombardi & Assem, 2017; Verhaak et al., 2010). 1.1.3.3. Proneural
In the proneural subtype, both PDGFRA and IDH1 mutations are major features. Although amplification of PDGFRA is frequently seen in all GBM classes, the rates of amplification are much higher in proneural tumours. Curiously, in these tumours it seems that IDH1 and PDGFRA mutations are mutually exclusive events, rarely occurring at the same time. Besides these, TP53 mutations are also common in this GBM sub-type (Verhaak et al., 2010).
12
1.1.3.4 Neural
In neural tumours, the expression of neuronal markers such as NEFL, GABRA1,
SYT1 and SLC12A5 is extremely common (Dunn et al., 2012; Verhaak et al., 2010).
This molecular categorization of GBMs fits into the generic primary and secondary classes with different incidence rates, as shown in Figure 1.8. Indeed, primary GBMs may be associated with any of the four subtypes. However, secondary GBMs are exclusively proneural tumours, being this the only class comprehending
IDH1 mutations (Morokoff, Ng, Gogos, & Kaye, 2015).
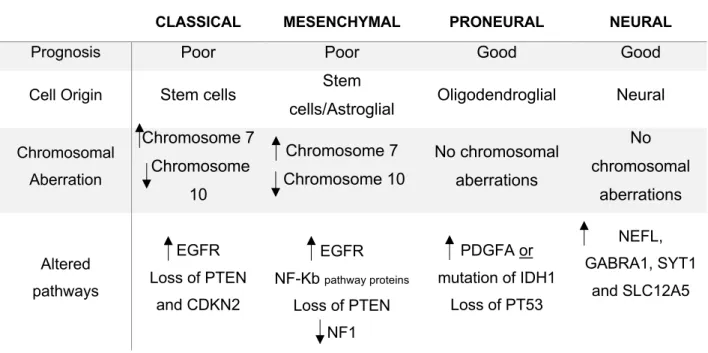
CLASSICAL MESENCHYMAL PRONEURAL NEURAL
Prognosis Poor Poor Good Good
Cell Origin Stem cells Stem
cells/Astroglial Oligodendroglial Neural
Chromosomal Aberration Chromosome 7 Chromosome 10 Chromosome 7 Chromosome 10 No chromosomal aberrations No chromosomal aberrations Altered pathways EGFR Loss of PTEN and CDKN2 EGFR NF-Kb pathway proteins Loss of PTEN NF1 PDGFA or mutation of IDH1 Loss of PT53 NEFL, GABRA1, SYT1 and SLC12A5
Table 1.1. The 4 molecular classifications of Glioblastomas and their respective prognosis, cell of origin,
chromosomal aberration and altered pathways (Verhaak et al., 2010; Lombardi & Assem, 2017). = amplification; = Downregulation
Figure 1.8. The 4 molecular classifications of GBMs, sorted into the primary and secondary categories
and their respective incidence by Verhaak et al. (adapted from Morokoff, Ng, Gogos, & Kaye, 2015). 33% 30% 17% 8% 12% Mesenchymal Classical Neural Proneural Proneural (Primary Glioblastoma) (Secondary Glioblastoma)
13
Recently, a new cluster of tumours has been documented: G-CIMP+. This molecular subgroup identification is based on the CpG island methylator phenotype existent in several GBMs within the four categories previously mentioned, yet predominant in tumours which harbor IDH1 mutations (proneural secondary GBMs) (Malta et al., 2017; Mansouri et al., 2017).
Generally, these tumours tend to relate with a better outcome and improved overall survival translated from the effectiveness of chemotherapy. In G-CIMP+ tumours, the MGMT promoter methylation has been established as a favorable prognostic molecular biomarker. Moreover, patients with triple combined G-CIMP+ tumours, which harbor the co-deletion of 1p/19q chromosomes, IDH mutations and MGMT methylation, have a significantly improved overall survival than those who only carry the MGMT methylation biomarker (Malta et al., 2017).
1.2 Therapeutic strategies
Despite all progresses in broad-spectrum cancer therapies development and diagnostic technologies, GBM shows one of the worst prognosis, with a high mortality rate. Currently, maximal surgical resection followed by concomitant radiotherapy and temozolomide chemotherapy is the standard treatment for newly diagnosed tumours. Still, there is no standard of care for recurrent or progressive GBM, despite the numerous clinical trials. Due to the disease heterogeneity (multiple molecular and histological subtypes) and small control groups (low incidence), it is difficult to identify the effectiveness of therapies in trials. Alternative therapies, in these cases, vary within reoperation, re-irradiation, systemic therapies (new chemotherapies, i.e. Bevacizumab) or combined modality therapies (surgery/radiotherapy/chemotherapy) (Fernandes et al., 2017).
1.2.1 Surgery
Surgery is the first therapeutic approach for GBM treatment, aiming to resect maximal tumour mass as possible within safety parameters in order to extract tissue for pathological diagnosis and delay tumour progression. The more extensive the resection is, the longer is the life expectancy. However, the main barrier this method faces is the fine balance between the tumour tissue removal and the preservation of brain functions and healthy tissue. As a matter of fact, surgeries to tumours located
14
within the eloquent cortex have high risk of postoperative neurological deficits (Fernandes et al., 2017).
Prior to surgery, the candidates are determined as good surgical candidates through the Karnofsky Performance Scale (KPS), shown in table 1.2. Normally, only patients with a KPS index equal or greater to 70 are considered for a surgical intervention. Nonetheless, selected patients with lower indexes may sometimes benefit from surgery, exhibiting improved survival and quality of life after tumour reduction (Young, Jamshidi, Davis, & Sherman, 2015). Marina et al. revealed that patients with preoperative KPS lower than 50, indeed improved their KPS status after surgery increasing their survival time and functional grade (Marina et al., 2011; Young et al., 2015). It is essential to understand that the surgical approach may differ between individuals, taking in consideration the localization of the tumour, pre- and postoperative KPS, survival extension and life quality (Young et al., 2015).
GENERAL RANKING FUNCTIONAL CRITERIA (%)
Able to carry on normal activity and to work; no special care needed
100%: No Complains; No evidence of disease;
90%: Able to carry on normal activities; minor signs or symptoms of disease;
80%: Normal activity with effort; Some signs or symptoms of disease;
Unable to work; able to live at home and care for most personal needs; varying
amount of assistance needed
70%: Cares for self; Unable to carry on normal activity or to do active work;
60%: Requires occasional assistance but is able to care for most personal needs;
50%: Requires considerable assistance and frequent medical care;
Unable to care for self; requires equivalent of institutional or hospital care; disease may
be progressing rapidly
40%: Disabled; Requires special care and assistance;
30%: Severely disable; hospital admission is indicated although death not imminent;
15
1.2.2 Radiotherapy
After surgery and previously to radiotherapy, patients are administered with dexamethasone, a corticosteroid, in order to prevent brain swelling. This is particularly important in patients whose tumour exerts were significant. Also, it may prevent radiotherapy associated brain swelling that can worsen the patient’s symptoms (Kostaras, Cusano, Kline, Roa, & Easaw, 2014).
Currently, the standard radiotherapy is given in concomitance with chemotherapy and may vary between 5.000-6.000 cGy doses fractionated over 30 days, in order to allow healthy cells of the irradiated zone to recover. Postoperative radiotherapy in these doses has been validated as beneficial in terms of survival advantage. However, dose-escalation beyond these values resulted in increased toxicity without being beneficial in terms of survival (Barani & Larson, 2015).
Notwithstanding the standards and what is considered the ideal dose, how radiotherapy is applied may depend on the age of the patient, tumour size and location. Normally, patients up to 70 years old, with a reasonable KPS status receive standard treatment of 6.000 cGy in fractions of 2 Gy. Whereas 70 years old patients should receive a less aggressive treatment of 4.000 cGy in fractions of 2,66 Gy (Cabrera et al., 2016). As a localized treatment, it is crucial to perform imaging diagnostics of the tumour prior to therapy. This helps define the target volume and localization. There are four important notions that help with the radiotherapy planning concerning the volume and localization, as well as the effectiveness and safety: Gross Tumour Volume (GTV); Clinical Target Volume (CTV); Planning Target Volume (PTV) and Organs at Risk (ORs). The first, GTV refers to the volume to be irradiated which can be seen and imaged (primary tumour). Secondly, the CTV means to target the spreading cells surrounding the primary tumour, which cannot be fully imaged.
20%: Very Sick; Hospital admission necessary; Active supportive treatment necessary;
10%: Moribund; Fatal processes progressing rapidly;
16
Following, the PTV contains the CTV irradiated volume with slightly wider margins to account for possible variations in the beam alignment, patient position, organ motion and deformation. Finally, it is important to consider the volumes to be irradiated, in order to protect the ORs from being targeted with a higher-than-safe dose (Burnet, Thomas, Burton, & Jefferies, 2004).
The side effects of radiotherapy usually start in the first week after initiating treatment and include hair loss, nausea and fatigue (“Side effects of radiotherapy | Brain tumour (primary),” 2015). Although rare, patients may also experience side effects that start months or years after treatment, once the brain tissue damage can reduce the blood supply to certain areas of the brain. This effects may vary between impaired memory, confusion and personality changes (“Long term side effects of radiotherapy | Brain tumour (primary),” 2015).
1.2.3 Chemotherapy
Following surgery adjuvant chemotherapy is given in concomitance with radiotherapy. Despite all lines of treatments GBM prognosis remains one of the poorest within all cancer types. Dysregulation of signaling pathways is widely studied nowadays and therapeutic approaches have been made to target proteins within these pathways. Several oncogenic pathways inhibitors have been tested in pre-clinical and clinical trials for this type of cancer. It is assumed that in the future, combinations of these drugs with cytotoxic chemotherapeutic (p.e. Temozolomide) and radiation could improve the prospective survival of GBM patients. However, cytotoxic chemotherapy remains for the moment the standard treatment as the most advantageous in terms of survival, within all approved drugs (Minniti, Muni, Lanzetta, & Enrici, 2009).
1.2.3.1 Temozolomide
Temozolomide is a cytotoxic alkylating agent reportedly discovered by a mix of “intelligence, guesswork, dogged persistence and luck” in 1970 (Newlands, Stevenst, Wedge, Wheelhouse, & Brock, 1997). This orally administrated drug is non-enzymatically hydrolyzed into 5-(3-methyltriazen-1-yl)imidazole-4-carboxamide (MTIC) at physiological pH, its active form. MTIC, once activated, alkylates DNA at N7 position of guanine (most common), O3 position of adenosine and O6 position of guanosine (most critical). The methylation of these residues leads to DNA strand
17
breaks and subsequent cell apoptosis (Temozolomide, DrugBank Database, 2005). The cytotoxic effect of this drug is correlated with the intracellular levels of MGMT. As a critical DNA repair protein, MGMT has the ability to reverse temozolomide’s strand-breaking action. High levels of MGMT are associated with temozolomide resistance. On the other hand, MGMT epigenetic silencing (methylation) is correlated with enhanced temozolomide sensitivity, which predicts a good outcome as benefit from this therapy. It has been reported that the 2-year survival rates for patients treated with radiotherapy and temozolomide with no MGMT methylation was 14%, whereas in patients with MGMT silencing, it was 46%. Nevertheless, it has been demonstrated through clinical trials that temozolomide increases significantly survival rates with minimal additional toxicity, when added to radiotherapy. Indeed, the reported 2-year survival rate for radiotherapy and temozolomide in concomitance was 27%, while radiotherapy by itself was only 10% (Minniti et al., 2009).
1.2.3.2 Carmustine
Carmustine is an alkylating agent which cross-links in the DNA and RNA to inhibit its synthesis and translation, respectively (Carmustine, DrugBank Database, 2005). In addition, Carmustine causes oxidative stress by inhibiting glutathione reductase, leading to activation of caspase-3 and apoptosis (Castaldo, Freitas, Conchinha, & Madureira, 2016). Systemic administration of this drug has demonstrated low efficacy in GBM treatment. However, a different method was developed: Carmustine wafers (Gliadel® wafers). This new method consists in a controlled release of carmustine from biodegradable polymer wafers that are placed in the cavity left by the surgical removal of the brain tumour. This approach not only reduced systemic toxicity, but it also increased the effectiveness of the therapy (Lin & Kleinberg, 2008). Carmustine wafers are approved to treat newly-diagnosed and recurrent GBM as an adjuvant treatment, alone or in combination with temozolomide, when surgical removal of the tumour is possible. Trials have not yet been conducted in order to compare carmustine wafers treatment to temozolomide, as single therapies. Despite the therapeutic benefits of this approach, risks associated with this treatment should not be disregarded. Cerebral edema, healing abnormalities, intracranial infections, seizures, intracranial hypertension and cerebrospinal fluid leaks are among the side effects that may be experienced by the patients who undergo this treatment and should be taken into consideration when prescribing it (Chowdhary,
18
Ryken, & Newton, 2015). Plus, combination of carmustine wafers with the standard treatment may carry the risk of increased secondary events and might not significantly improve the outcome (De Bonis et al., 2012).
1.2.3.3 Targeted therapies
As mentioned above, GBM is characterized by aberrant activation of signaling pathways that lead to tumour progression. Inhibitors for growth factor receptors and pathways such as MAPK/ERK and PI3K/mTOR or cell cycle control were developed and could be adapted as GBM adjuvant therapies, as shown on Table 1.3 (Touat, Idbaih, Sanson, Ligon, & Ligon, 2017).
In addition to these target pathways, in 2009 the Food and Drug Administration (FDA) approved provisionally an anti-angiogenic target drug called Bevacizumab for recurrent GBM treatment (Touat et al., 2017). Angiogenesis, the process of blood vessels growth from the existing vasculature, is a major hallmark of carcinogenesis and a very important feature in GBM invasion. Vascular Endothelial Growth Factor (VEGF) promotes proliferation and migration of vascular endothelial cells, as well as vascular permeability. It is consequently the main player of the angiogenic process. Bevacizumab is a monoclonal antibody that targets VEGF-A to inhibit its assembly with the respective receptor and so inhibits tumour vascularization (Keating, 2014).
GENE ALTERATION CANDIDATE THERAPY
Growth Factor Receptors:
EGFR Amplification Rindopepimut (EGFRvIIi-specific peptide conjugated)
PDGFR Amplification Dasatinib (PDGFR inhibitor)
MAPK and PI3K/mTOR pathways:
PTEN Delection Voxtalisib (mTOR/PI3K inhibitor)
PIK3CA Amplification Buparlisib (PI3K inhibitor)
BRAF Mutation
(phosphomimic)
Trametinib (MEK inhibitor) or Vemurafenib (BRAF inhibitor) Cell Cycle pathways:
MDM2 Amplification AMG232 (MDM2 inhibitor)
CDK4/6 Amplification Ribociclib (CDK4/6 inhibitor)
Others:
IDH1 Mutation AG120 (IDH1 inhibitors)
19
Although it failed to prolong overall survival in newly diagnosed GBM and first recurrence, it is frequently used as a last-line treatment following temozolomide, carmustine and radiotherapy failure (K. J. Wenger et al., 2017).
1.2.3.4 Therapy resistance
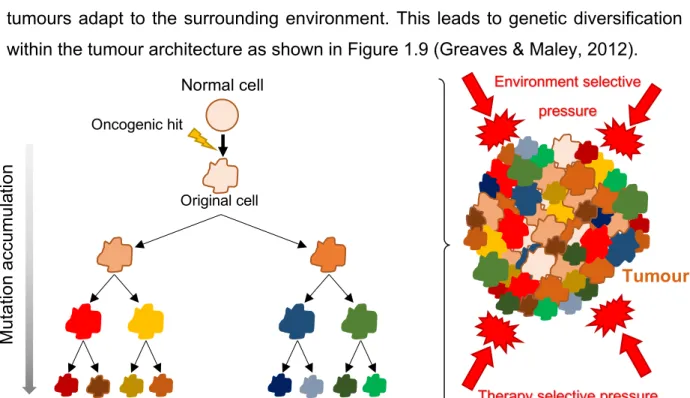
GBM remains a therapeutic challenge being extremely difficult to prevent recurrence. Tumour regrowth typically occurs around the surgical cavity due to the failure of standard and targeted therapies, which do not comprise tumour heterogeneity. GBM cell subgroups are characterized by divergent expression profiles and genetic/epigenetic landscapes, derivative of differences in cell of origin and accumulation of mutations (Osuka & Meir, 2017). The clonal evolution theory states that cancers develop through a process of clonal expansion and selection in which tumours adapt to the surrounding environment. This leads to genetic diversification within the tumour architecture as shown in Figure 1.9 (Greaves & Maley, 2012).
Multiple study findings have shown that the higher the tumour heterogeneity levels, the lower the response of the patients to anticancer therapies (Dagogo-Jack & Shaw, 2017). Some of the tumour cell clones may evade from therapies due to their own ‘resistant’ genomic landscape. Indeed, drugs and radiation may artificially select resistant cell variants with increased malignant potential (Greaves & Maley, 2012). It has been further hypothesized that selection of resistant clones might occur through
Environment selective pressure Oncogenic hit Original cell Normal cell M u ta tio n a ccu m u la tio n Tumour
Figure 1.9. Clonal evolution theory: The clonal expansion leads to cell populations with different
mutational landscapes (different colors) and different levels of mutational accumulation. Also, the tumour environment and external factors (therapy) contribute for the intratumoral heterogeneity.