Technical Note
strategies
Author(s)
Graña AL1
Tavernari FC2
Lelis GR1
Albino LFT3
Rostagno HS3
Gomes PC3
1 Graduate Program in Animal Sciences –
UFV
2 Embrapa Swine and Poultry Researcher 3 Department of Animal Science – UFV
Mail Adress
*Corresponding author e-mail address E-mail: [email protected]
Keywords
Enzyme, phosphorus, organic trace minerals, ideal protein.
Submitted: March/2012 Approved: December/2012
ABSTRACT
An experiment was carried out to evaluate the effects of different nutritional strategies on nitrogen (N), phosphorus (P) and calcium (Ca) balance and on copper (Cu), manganese (Mn) and zinc (Zn) excretion in broilers during the periods of 1 to 21 days and 1 to 46 days of age. Four hundred male Cobb-500 broilers were used. A randomized block experimental design was applied, including five treatments with eight replicates of 10 birds each. A five-phase feeding program was adopted (1-8, 9-21, 22-33, 34-40 and 41-46 days of age). Treatments consisted of a control diet (C) with typical protein level and low amino acid supplementation; a reduced-protein diet supplemented with synthetic amino acids formulated on ideal protein concept (IP); C with phytase (C+PHY) supplementation; C with inorganic-organic mineral supplementation (C+MIN); and a diet formulated on ideal protein (IP) basis, and supplemented with phytase and organic and inorganic minerals (IP+PHY+MIN). IP and IP+PHY+MIN diets reduced nitrogen excretion in 13.6 and 13.1% respectively, and promoted the same nitrogen retention (g/bird) and retention efficiency as compared to the diet with typical crude protein level. C+PHY and IP+PHY+MIN reduced phosphorus, calcium and manganese excretion, and improved phosphorus retention. C+MIN and IP+PHY+MIN reduced manganese excretion, but did not influence copper or zinc excretion.
INTRODUCTION
Brazil is the world’s biggest chicken meat exporter and one of the largest poultry producers. However, a downside to this excellent performance is that poultry waste became a significant environmental issue in regions where there is a high concentration of poultry farms.
Poultry excreta contain significant N, Ca, P, Cu, Mn, and Zn levels, which contribute to environmental pollution, particularly of water sources (Payne, 1998; Paterson, 2002).
Poultry nutritionists have sought alternatives to formulate more efficient feeds, reducing production costs and environmental pollution. The use of nutritional strategies, such as formulation of low-protein diets with synthetic amino acid supplementation and dietary addition of enzymes and organic trace minerals, has helped to reduce the impact of the excretion of potentially polluting elements in the environment (Ferket et al., 2002).
MATERIALS AND METHODS
The experiment was carried out at the Poultry Sector of the Animal Science Department of the Federal University of Viçosa, Brazil. In total, 400 one-day-old male Cobb-500 broilers, with 43.63 g initial body weight. were used. Chicks were vaccinated in the hatchery against fowl pox and Marek’s disease.
During the entire experimental period, birds were housed in metal battery cages arranged in two levels and placed in a room with an area of 68.0m2 and 2.8m height.
The room microclimate was created using polyurethane curtains and one 250w infrared lamp per pen in the aisle. As bird temperature requirement was reduced, lamp height and curtain opening were regulated. Curtains were removed when birds were three weeks old.
Water and feed were supplied ad libitum
during the entire experimental period. House internal temperature and relative humidity were determined using three thermometers and one hygrometer, both with maximum-minimum measurements, placed at different locations inside the house at birds’ height. Average temperature and relative humidity recorded during the experiment were 28.8°C (25.3 and 31.3°C minimum and maximum temperature, respectively) and 71.3% relative humidity (63.5% and 79.2% minimum and maximum relative humidity, respectively) for the period of 1 to 21 days; and 24.7°C (20.8 and 28.7°C minimum and maximum temperature, respectively) and 75.2% relative humidity (57.8% and 92.7% minimum and maximum relative humidity, respectively) for the period of 22 to 46 days of age.
A randomized block experimental design was applied, including five treatments with eight replicates of 10 birds each. For better utilization of cage space, two birds were removed at the end of each experimental phase. Treatments consisted of a control diet (C), with typical protein level and low amino acid supplementation; a reduced crude protein diet supplemented with synthetic amino acids and formulated on the ideal protein concept (IP); C with phytase (C+PHY) supplementation; C with mineral supplementation (C+MIN 40% organic minerals and 50% inorganic minerals) and a feed combining nutritional strategies (formulation based on ideal protein concept,
and supplemented with phytase and organic and inorganic minerals) (IP+PHY+MIN). It was assumed that 40% organic minerals were equivalent to 50% inorganic minerals according to Ammerman et al. (1995).
A five-phase feeding program was applied: pre-starter (1-8 days); starter (8-21 days); grower I (22-33 days); grower II (34-40 days); finisher (41-46 days).
The phytase enzyme was produced by the yeast
Schizosaccharomyces pombe at a concentration of 5000
FTU/g of product, and supplemented at a dose of 100 g/ ton (500 FTU/kg diet). As phytase increases calcium and phosphorus availability in feeds, its nutritional value to supply the requirements of these minerals was considered, and the feed with phytase supplied the same calcium and phosphorus levels as the control feed.
A mineral supplement containing only inorganic minerals was formulated for diets C, IP and C+PHY (Table 1), and an inorganic-organic mineral supplement was formulated for diets C+MIN and IP+PHY+MIN (Table 2).
Table 1 – Composition of the inorganic mineral supplement and amount of mineral in the supplement (g/kg) and in the diets (C, IP and C+PHY) per feeding phase (kg/ton)
Mineral source
(concentration) Source,%
Mineral, g/kg supplement
Pre-st/ starter, mg/
kg 1
Grower mg/ kg 2
Finisher mg/kg 3
Cu sulfate (35%) 2.86 10.00 11.00 10.00 7.50 Fe sulfate (30%) 16.67 50.00 55.00 50.00 37.50
Ca iodate (63%) 0.13 0.80 0.88 0.80 0.60
Mn sulfate (26%) 25.00 65.00 71.50 65.00 48.80 Na selenide (45%) 0.07 0.30 0.33 0.30 0.23 Zn sulfate (35%) 17.14 60.00 66.00 60.00 45.00 Limestone (38.4%) 38.14 146.40 180.40 146.40 109.80
Total 100.00
1 Pre-starter and Starter, 1.1 kg/ton; 2 Grower (1 and 2), 1.0 kg/ton; 3 Finisher, 0.75 kg/ton
Table 2 – Composition of the organic mineral supplement and amount of mineral in the supplement (g/kg) and in the diets (C+MIN and IP+PHY+MIN)
Mineral source
(concentration) Source,%
Mineral, g/kg supplement
Pre-st/starter, mg/kg 1
Grower mg/kg 2
Finisher mg/kg 3
Cu sulfate (35%) 1.43 5.00 5.50 5.00 3.75 Fe sulfate (30%) 16.67 50.00 5.50 50.00 37.50
Ca iodate (63%) 0.13 0.80 0.88 0.80 0.60
Mn sulfate (26%) 12.50 32.50 35.80 32.50 24.40 Na selenide (45%) 0.07 0.30 0.33 0.30 0.23 Zn sulfate (35%) 8.57 30.00 33.00 30.00 22.50 Organic Cu (15%) 1.33 2.00 2.20 2.00 1.50 Organic Mn (13%) 10.00 13.00 14.30 13.00 9.75 Organic Zn (16%) 7.50 12.00 13.20 12.00 9.00 Organic Cu (21%) 0.95 2.00 2.20 2.00 1.50 Organic Mn (21%) 6.19 13.00 14.30 13.00 9.75 Organic Zn (21%) 5.71 12.00 13.20 12.00 9.00 Limestone (38.4%) 28.95 74.10 81.50 74.10 55.60
Total 100.00
The composition of the organic trace minerals used in the inorganic-organic supplements is shown in Table 3.
Table 3 – Composition of the commercial organic trace mineral products used in the experimental diets
Nutrients
Organic Trace Minerals
Zn = 16%
Mn = 13%
Cu = 15%
Zn = 21%
Mn = 21%
Cu = 21%
AME, kcal/kg 3823 3727 3727 286 361 301
Crude protein, % 47.0 45.8 45.8 22.6 28.5 23.8
L-methionine, % 80.0 78.0 78.0 0.0 0.0 0.0
Glycine, % 0.0 0.0 0.0 19.0 24.0 20.0
Sulfur 17.3 16.8 16.8 0.0 0.0 0.0
Feeds were based on corn and soybean meal. In the pre-starter diet, fish meal and corn gluten meal were added. Nutritional requirements in each phase followed the recommendations of Rostagno et al.
(2005). Tables 4 to 8 show the composition of the experimental diets for each feeding phase.
Table 4 – Chemical composition of pre-starter(1-7 days) experimental diets
C IP C+PHY C+MIN IP+PHY+MIN
Crude Protein, % 26.00 24.50 26.00 26.00 24.50
AME, Kcal/Kg 2950 2950 2950 2950 2950
Calcium, % 0.939 0.939 0.829 0.939 0.829
Avail. phosphorus, % 0.470 0.470 0.350 0.470 0.350
Dig. Lysine , % 1.330 1.330 1.330 1.330 1.330
Dig. Met + Cys, % 0.944 0.944 0.944 0.944 0.944
Dig. Threonine, % 0.865 0.865 0.865 0.865 0.865
Dig. Tryptophan, % 0.261 0.242 0.262 0.261 0.241
Dig. Arginine, % 1.575 1.461 1.576 1.575 1.459
Dig. Valine, % 1.061 0.998 1.063 1.061 0.998
Table 5 – Chemical composition of starter(8-21 days) experimental diets
C IP C+PHY C+MIN IP+PHY+MIN
Crude Protein, % 22.06 20.77 22.06 22.06 20.77
AME, Kcal/Kg 3000 3000 3000 3000 3000
Calcium, % 0.884 0.884 0.774 0.884 0.774
Avail. phosphorus, % 0.442 0.442 0.322 0.442 0.322
Dig. Lysine , % 1.146 1.146 1.146 1.146 1.146
Dig. Met + Cys, % 0.814 0.814 0.814 0.814 0.814
Dig. Threonine, % 0.745 0.745 0.745 0.745 0.745
Dig. Tryptophan, % 0.245 0.227 0.245 0.245 0.227
Dig. Arginine, % 1.429 1.329 1.430 1.429 1.327
Dig. Valine, % 0.921 0.865 0.922 0.921 0.865
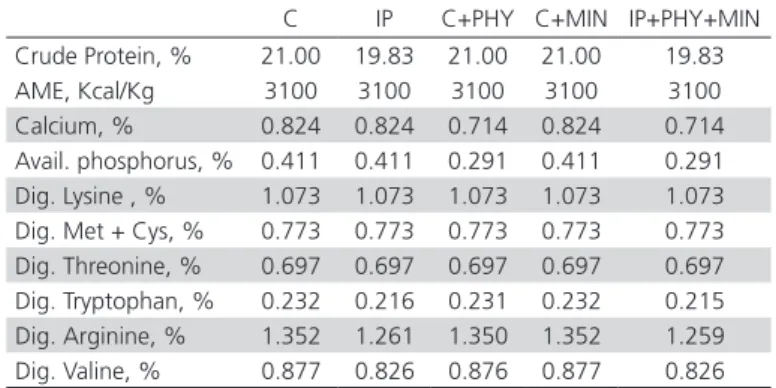
Table 6 – Chemical composition of grower1(22-33 days) experimental diets
C IP C+PHY C+MIN IP+PHY+MIN Crude Protein, % 21.00 19.83 21.00 21.00 19.83 AME, Kcal/Kg 3100 3100 3100 3100 3100 Calcium, % 0.824 0.824 0.714 0.824 0.714 Avail. phosphorus, % 0.411 0.411 0.291 0.411 0.291 Dig. Lysine , % 1.073 1.073 1.073 1.073 1.073 Dig. Met + Cys, % 0.773 0.773 0.773 0.773 0.773 Dig. Threonine, % 0.697 0.697 0.697 0.697 0.697 Dig. Tryptophan, % 0.232 0.216 0.231 0.232 0.215 Dig. Arginine, % 1.352 1.261 1.350 1.352 1.259 Dig. Valine, % 0.877 0.826 0.876 0.877 0.826
Table 7 – Chemical composition of grower 2 (34-40 days) experimental diets
C IP C+PHY C+MIN IP+PHY+MIN Crude Protein, % 20.00 18.81 20.00 20.00 18.81 AME, Kcal/Kg 3150 3150 3150 3150 3150 Calcium, % 0.763 0.763 0.653 0.763 0.653 Avail. phosphorus, % 0.380 0.380 0.260 0.380 0.260 Dig. Lysine , % 1.017 1.017 1.017 1.017 1.017 Dig. Met + Cys, % 0.732 0.732 0.732 0.732 0.732 Dig. Threonine, % 0.661 0.661 0.661 0.661 0.661 Dig. Tryptophan, % 0.219 0.202 0.218 0.219 0.202 Dig. Arginine, % 1.277 1.184 1.275 1.277 1.182 Dig. Valine, % 0.834 0.783 0.834 0.834 0.783
Table 8 – Chemical composition of finisher (41-46 days) experimental diets
C IP C+PHY C+MIN IP+PHY+MIN Crude Protein, % 19.16 17.95 19.21 19.16 17.95 AME, Kcal/Kg 3200 3200 3200 3200 3200 Calcium, % 0.728 0.728 0.618 0.728 0.618 Avail. phosphorus, % 0.363 0.363 0.243 0.363 0.243 Dig. Lysine , % 0.970 0.970 0.970 0.970 0.970 Dig. Met + Cys, % 0.698 0.698 0.698 0.698 0.698 Dig. Threonine, % 0.631 0.631 0.631 0.631 0.631 Dig. Tryptophan, % 0.208 0.191 0.208 0.208 0.191 Dig. Arginine, % 1.215 1.121 1.216 1.215 1.118 Dig. Valine, % 0.799 0.747 0.801 0.799 0.747
Trays lined with plastic were placed under the cage for excreta collection. Excreta were identified, weighed, and stored in a freezer until subsequent nitrogen (N), phosphorus (P), calcium (Ca), manganese (Mn), zinc (Zn) and copper (Cu) analyses .
All analyses were calculated in duplicate at the Animal Nutrition Laboratory of the Department of Animal Science of Federal University of Viçosa, Brazil, using the methodology described by Silva (1990).
Nitrogen, P and Ca balances, and trace mineral excretion (Cu, Mn and Zn) were calculated for 21- and 46-d-old broilers. Nutrient balance was calculated considering the amount of nutrient intake (g/bird), determined considering analyzed nutrient content in the diet, feed intake and nutrient excretion (g/bird) at the end of each phase. Nutrient excretion (g/bird) was determined according to analyzed nutrient content in the excreta produced at the end of each phase. Nutrient retention (g/bird) was calculated as nutrient intake (g/bird) minus nutrient excretion (g/bird). Nutrient retention (%) indicates the percentage of nutrient retained by the bird as a function of nutrient intake, and it was calculated as follows:
Nutrient retention (%) = [nutrient retention (g/bird) / nutrient intake (g/bird)]*100
Nitrogen, P and Ca balance and trace mineral excretion (Cu, Mn and Zn) results were submitted to analysis of variance. Means were compared to the control treatment using the t-test (contrasts) at 5% probability level. Data were processed using SAEG (Sistema de Análises Estatísticas e Genéticas) statistical package (UFV, 2000).
RESULTS AND DISCUSSION
Table 9 shows nitrogen balance results during the period of 1 to 21 days of age of broilers submitted to different nutritional strategies.
Table 9 – Nitrogen balance results of 1- to 21-d-old broilers submitted to different nutritional strategies
Treatments N intake, g/ bird
N excretion, g/bird
N retention, g/bird
N retention, %
Control (C1) 46.4 17.9 28.5 61.5
IP2 43.6* 15.5* 28.1 64.4*
C+PHY3 46.5 16.3* 30.2* 65.0*
C+MIN4 46.9 16.7* 30.3* 64.5*
IP+PHY+MIN 44.3* 15.5* 28.9 65.1*
ANOVA 0.001 0.001 0.013 0.017
CV % 2.6 5.9 5.0 3.5
1C=Typical crude protein levels; 2IP= ideal protein; 3PHY= Phytase; 4Min = 50%
inorganic minerals + 40% organic trace minerals.
Means followed by * in the same column are different from the control treatment by the t test at 5% probability level.
Compared with the control birds (C), broilers fed the IP diet presented 6.0% reduction (p < 0.05) in N
intake, which resulted in 13.2% reduction (p < 0.05) in N excretion. Considering that the average protein reduction between the pre-starter (1 to 8 days) and the starter (8 to 21 days) diets was 1.4%, a 9.4% reduction in N excretion per unit of crude protein was obtained. Similar results were obtained by Rodrigues (2006), who observed 8% reduction in nitrogen excretion in broilers between 1 and 21 days of age.
The excellent digestibility and availability of the synthetic amino acids supplemented to the reduced-protein diet (IP) prevented excessive N excretion, resulting in equal (P>0.05) N retention (g/bird) and increased (P<0.05) N retention efficiency in 4.7% as compared to the broilers fed the control diet.
The diet containing phytase (C+PHY) did not influence (p > 0.05) N intake, but it was better than the C diet because it reduced (p < 0.05) N excretion in 9.1% and increased N retention (g/bird and %) in 6.0% and 5.7%, respectively. Phytase is also known for releasing amino acids chelated with phytate, thereby contributing to increase nitrogen retention and to reduce nitrogen excretion in poultry (Lan et al.,
2002; Viveiros et al., 2002; Rutherfurd et al., 2004). The diet supplemented with inorganic-organic minerals (C+MIN) did not influence (p > 0.05) N intake, but was more efficient than the control diet (C), as it reduced (p < 0.05) N excretion in 6.8% and increased N (g/bird and %) in 6.1% and 4.9%, respectively.
The diet with the combination of different nutritional strategies (IP+PHY+MIN) improved the absorption of amino acids in the gastrointestinal tract, reducing N excretion in 4.5%, and increased the efficiency of N retention (p < 0.05) in 5.9% as compared to C.
Table 10 presents nitrogen balance data of broilers during the period of 1 to 46 days of age, submitted to different nutritional strategies.
Table 10 - Nitrogen balance results of 1- to 46-d-old broilers submitted to different nutritional strategies
Treatment N intake, g/ bird
N excretion, g/bird
N retention, g/bird
N retention, % Control (C1) 171.4 65.4 105.9 61.8
IP2 161.6* 56.9* 104.7 64.7
C+PHY3 173.5 61.8 111.7 64.4
C+MIN4 171.6 61.7 109.9 64.1
IP+PHY+MIN 160.4* 56.5* 103.9 64.7
ANOVA 0.001 0.001 ns5 ns
CV % 3.6 6.3 6.2 3.8
1 C=Typical crude protein levels; 2 IP= ideal protein; 3 PHY= Phytase; 4 Min = 50%
inorganic minerals + 40% organic trace minerals. 5 Non-significant
Broilers fed the diet formulated on the ideal protein concept (IP) reduced (p < 0.05) N intake in 5.7 %, resulting in 13.1% N excretion reduction (p < 0.05) when compared to C.
Average protein reduction in the total period was 1.3%, with 10.3% less N excretion for each unit of dietary crude protein reduction. Similar results were obtained by De Faria & Sakamoto (2008), who observed 9.9% N excretion reduction when feeds based on the ideal protein concepts were used. However, Ferket (2002) reported 8.5% less N excretion for each unit of dietary crude protein reduction.
The reduced-protein diet (IP) did not influence (p > 0.05) N retention (g/bird and %) as compared to C. It was inferred that the feed formulated using the ideal protein concept presented better amino acid balance, as N excretion was reduced and N retention was maintained.
The diets supplemented with phytase (C+PHY) and inorganic-organic minerals (C+MIN) did not affect (p > 0.05) N balance as compared to C.
The diet with the combination of different nutritional strategies (IP+PHY+MIN) resulted in lower N intake and retention, with 6.4 and 13.6% respectively. However, there was no difference (p > 0.05) in N retention (g/bird and %) when compared to C. These results are consistent with the findings of De Faria & Sakamoto (2008), who found that a feed containing a combination of these same nutritional strategies promoted lower N content in the excreta, but did not affect N retention.
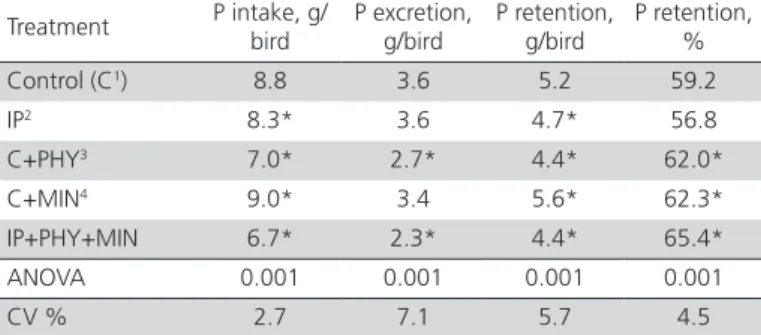
Table 11 shows the results relative to phosphorus balance of broilers during the period of 1 to 21 days of age, submitted to different nutritional strategies
Table 11 – Phosphorus balance results of 1- to 21-d-old broilers submitted to different nutritional strategies
Treatment P intake, g/ bird
P excretion, g/bird
P retention, g/bird
P retention, %
Control (C1) 8.8 3.6 5.2 59.2
IP2 8.3* 3.6 4.7* 56.8
C+PHY3 7.0* 2.7* 4.4* 62.0*
C+MIN4 9.0* 3.4 5.6* 62.3*
IP+PHY+MIN 6.7* 2.3* 4.4* 65.4*
ANOVA 0.001 0.001 0.001 0.001
CV % 2.7 7.1 5.7 4.5
1C=Typical crude protein levels; 2IP= ideal protein; 3PHY= Phytase; 4Min = 50%
inorganic minerals + 40% organic trace minerals.
Means followed by * in the same column are different from the control treatment by the t test at 5% probability level.
Broilers fed the ideal protein diet (IP) presented lower (p < 0.05) P intake and retention, but there were no differences in P excretion (g/bird and %) when compared with those fed the C diet. Relative to the broilers receiving the control diet, those fed the diet with phytase (C+PHY) and with the combination of nutritional strategies (IP+PHY+MIN) presented lower (p < 0.05) P intake (19.7 and 23.7%) and excretion (25.4 and 35.2%), and consequently reduced P retention in g/bird (p < 0.05). This may be explained by the fact that these diets contained less dicalcium phosphate, demonstrating that phytase increased the availability of phosphorus retained as phytate (p < 0.05) as shown by the increase in P retention efficiency (P retention, %) in 5.3 and 10.5%, respectively. The results obtained with the diet containing phytase (C+PHY) are consistent with the findings of Lelis et al. (2007) and De Faria & Sakamoto (2008), who observed lower P excretion when broilers were fed diets with phytase supplementation. Also, Silva (2004) found that, in addition of reducing P excretion, phytase improved the efficiency of P retention. The results obtained with the combination of nutritional strategies (IP+PHY+MIN), agree with those of De Faria & Sakamoto (2008).
There was a reduction (p < 0.05) in P intake when the feed was supplemented with inorganic-organic minerals (C+MIN), but there was no effect (p > 0.05) on P excretion, resulting in higher P retention (g/bird and %) (p < 0.05) when compared to the control diet.
Table 12 shows phosphorus balance of broilers during the period of 1 to 46 days of age submitted to different nutritional strategies.
Table 12 - Phosphorus balance results of 1- to 46-s-old broilers submitted to different nutritional strategies
Treatment P intake, g/ bird
P excretion, g/bird
P retention, g/bird
P retention, % Control (C1) 31.6 14.2 17.4 55.1
IP2 30.9 13.7 16.7 54.2
C+PHY3 24.2* 9.1* 15.1* 62.5*
C+MIN4 30.3* 13.9 16.4 54.3
IP+PHY+MIN 21.3* 8.2* 13.1* 61.4*
ANOVA 0.001 0.001 0.001 0.001
CV % 3.8 9.4 8.1 6.5
1C=Typical crude protein levels; 2IP= ideal protein; 3PHY= Phytase; 4Min = 50%
inorganic minerals + 40% organic trace minerals.
Means followed by * in the same column are different from the control treatment by the t test at 5% probability level.
had the same effect as in the period of 1 to 21 days of age, with lower (p < 0.05) P intake (23.3 and 32.5%), P excretion (36.0 and 42.1%), and retention in g/ bird (13.0 and 24.6%), respectively. However, higher P retention efficiencies were obtained, with 13.5 and 11.4% respectively. The results obtained with the C+PHY diet are consistent with those of Simons et al.
(1990), Munaro (1996), Ferket et al. (2002), and Dari (2004), who found that phytase reduces P excretion between 20 and 60% by increasing P retention, whereas the effect of treatment IP+PHY+MIN are in agreement with the findings of De Faria & Sakamoto (2008). There was a reduction (p < 0.05) in P intake with the diet supplemented with inorganic-organic minerals (C+MIN), but there was no effect (p > 0.05) in P excretion, retention in g/bird or in the efficiency of P retention as compared to the birds fed the C diet.
Table 13 shows calcium balance results of broilers during the period of 1 to 21 days of age, submitted to different nutritional strategies.
Table 13 – Calcium balance results of 1- to 21-d-old broilers submitted to different nutritional strategies
Treatment
Ca intake, g/bird
Ca excretion, g/
bird
Ca retention,
g/bird
Ca retention,
%
Control (C1) 11.9 5.2 6.7 56.0
IP2 12.4* 5.6 6.8 54.6
C+PHY3 10.7* 4.6* 6.1 57.2
C+MIN4 12.9* 5.3 7.6* 59.1
IP+PHY+MIN 10.1* 4.8 5.3* 52.4
ANOVA 0.001 0.001 0.001 0.001
CV % 2.70 8.93 7.90 7.34
LSM 0.3 0.5 0.5 4.2
1C=Typical crude protein levels; 2IP= ideal protein; 3PHY= Phytase; 4Min = 50%
inorganic minerals + 40% organic trace minerals.
Means followed by * in the same column are different from the control treatment by the t test at 5% probability level.
The feed formulated using the ideal protein concept (IP) promoted higher (p < 0.05) Ca intake, but maintained the same (p > 0.05) Ca excretion and retention (g/bird and %) relative to C diet.
As compared to birds fed the C diet, those receiving the diet with phytase (C+PHY) reduced (p < 0.05) Ca intake and excretion in 9.7 % and 12.2% respectively, but there were no differences (p > 0.05) in Ca retention (g/bird or %). These results are in agreement with Quian et al. (1997), according to whom, phytase
supplementation has synergistic effect on Ca and P utilization as it maintains the Ca:available P ratio constant at 2:1 in the feed, reducing excretion, but not their retention by broilers.
Due to the increase in (p < 0.05) Ca intake of broilers fed the diet with inorganic-organic mineral supplementation (C+MIN), these birds presented higher Ca retention in g/bird (p < 0.05), but had the same (p > 0.05) Ca excretion and retention efficiency as compared to C-fed broilers.
Ca intake was lower (p < 0.05) in broilers fed the combination of nutritional strategies (IP+PHY+MIN), resulting in 20.5% lower (p < 0.05) Ca retention in g/ bird relative to C, but the same (p > 0.05) Ca excretion and retention efficiency.
Table 14 presents data relative to calcium balance of broilers during the period of 1 to 46 days of age, submitted to different nutritional strategies.
Table 14 - Calcium balance results of 1- to 46-d-old broilers submitted to different nutritional strategies
Treatment
Ca intake, g/bird
Ca excretion, g/
bird
Ca retention,
g/bird
Ca retention,
%
Control (C1) 45.4 21.4 24.0 52.9
IP2 44.6 21.5 23.1 51.8
C+PHY3 38.0* 17.4* 20.6* 54.2
C+MIN4 45.0 22.0 23.0 51.2
IP+PHY+MIN 35.4* 16.8* 18.6* 52.4
ANOVA 0.001 0.001 0.001 ns5
CV % 3.5 10.2 9.4 8.7
1C=Typical crude protein levels; 2IP= ideal protein; 3PHY= Phytase; 4Min = 50%
inorganic minerals + 40% organic trace minerals. 5Not significant
Means followed by * in the same column are different from the control treatment by the t test at 5% probability level.
Ca balance in broilers fed diets using the ideal protein concept (IP) and with inorganic-organic mineral supplementation (C+MIN) when compared to those fed the control diet (C).
Ca retention efficiency as that obtained with the control diet.
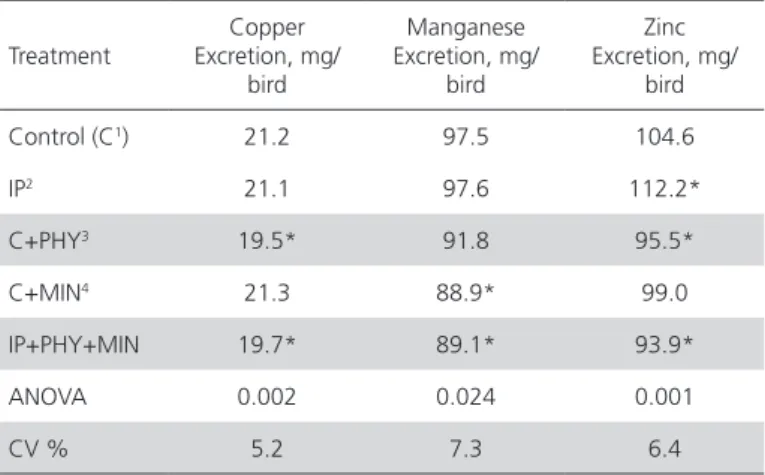
Table 15 shows the results of trace mineral (Cu, Mn and Zn) balance of broilers during the period of 1 to 21 days of age, submitted to different nutritional strategies.
Table 15 – Manganese, copper and zinc contents in the excreta of 1- to 21-d-old broilers submitted to different nutritional strategies
Treatment
Copper Excretion, mg/
bird
Manganese Excretion, mg/
bird
Zinc Excretion, mg/
bird
Control (C1) 21.2 97.5 104.6
IP2 21.1 97.6 112.2*
C+PHY3 19.5* 91.8 95.5*
C+MIN4 21.3 88.9* 99.0
IP+PHY+MIN 19.7* 89.1* 93.9*
ANOVA 0.002 0.024 0.001
CV % 5.2 7.3 6.4
1C=Typical crude protein levels; 2IP= ideal protein; 3PHY= Phytase; 4Min = 50%
inorganic minerals + 40% organic trace minerals.
Means followed by * in the same column are different from the control treatment by the t test at 5% probability level.
The diet formulated according to the ideal protein concept (IP) did not affect (p > 0.05) Cu or Mn excretion. However, higher (p < 0.05) Zn excretion levels were obtained as compared to diet C. Once this feed did not contain enzymes or organic trace minerals, phytate possibly interacted with Zn, making it unavailable.
Although the diet containing phytase (C+PHY) did not affect (p > 0.05) Mn excretion, it reduced (p < 0.05) Cu and Zn excretion in 8.1 and 8.7%, respectively. Phytase hydrolyses phytate-mineral bonds, releasing Zn and Cu, as reported by Ravindran & Bryden (1997). These results are consistent with those obtained by Sebastian et al. (1996) and by Ferket et al. (2002), who observed 8% reduction in Zn excretion when phytase was included in the diet.
The broilers fed the diet with inorganic-organic mineral supplementation (C+MIN) reduced (p < 0.05) Mn excretion in 8.8%, but Cu and Zn excretion was not affected (p > 0.05). Also Nollet et al. (2007) reported reduced Cu, Zn and Mn excretion in broiler fed organic trace minerals, whereas De Faria & Sakamoto (2008) did not obtain any reduction in Cu, Zn and Mn excretion.
The use of the combination of nutritional strategies (IP+PHY+MIN) reduced (p < 0.05) Cu, Mn, and Zn excretion in 7.1, 8.6 and 10.3%, respectively.
Table 16 shows the results of trace mineral (Cu, Mn and Zn) balance of broilers during the period of 1 to 46 days of age, submitted to different nutritional strategies.
Table 16 - Manganese, copper and zinc contents in the excreta of 1- to 46-d-old broilers submitted to different nutritional strategies
Treatment
Copper Excretion, mg/
bird
Manganese Excretion, mg/
bird
Zinc Excretion, mg/
bird
Control (C1) 78.9 406.8 468.3
IP2 78.0 377.1 451.0
C+PHY3 72.2 358.1* 435.6
C+MIN4 75.1 359.7* 436.3
IP+PHY+MIN 71.2 341.4* 412.9
ANOVA ns5 0.005 ns
CV % 8.8 9.0 10.2
1C=Typical crude protein levels; 2IP= ideal protein; 3PHY= Phytase; 4Min = 50%
inorganic minerals + 40% organic trace minerals.
Means followed by * in the same column are different from the control treatment by the t test at 5% probability level.
There was no significant difference in Cu, Mn or Zn excretion in broilers fed the ideal protein diet (IP) relative to the control diet.
Broiler fed the diet containing phytase (C+PHY) reduced (p < 0.05) Mn excretion in 12.0% as compared to those fed the control diet (C). Phytase apparently has higher capacity to release Mn than the other trace minerals. According to Underwood & Suttle (2001), phytase makes Cu, Zn and Mn available by releasing them from phytate, thereby reducing their excretion. However, Ferket et al. (2002) observed only 5 to 8% Zn excretion reduction when phytase was added to the diet.
Broilers receiving the diet with inorganic-organic mineral supplementation (C+MIN) and that with the combination of nutritional strategies (IP+PHY+MIN) reduced (p < 0.05) Mn excretion in 11.6 and 16.1%, respectively, but there was no influence (p > 0.05) on Cu and Zn excretion when compared to the control diet.
(Cu and Zn) present both in the mineral supplement and in the feed were not absorbed due to the lack of intestinal transporters (metallothioneins) or to the antagonism between those elements. Underwood & Suttle (2001) reported that trace mineral absorption is low in monogastric animals due to these factors.
CONCLUSIONS
The diets formulated using the ideal protein concept and the same principle plus inorganic-organic mineral supplementation allowed 13.6 and 13.1% nitrogen excretion reduction, respectively, and the same nitrogen retention (g/bird) and retention efficiency as compared to the diet containing typical crude protein levels. Phytase supplementation reduced phosphorus, calcium, and manganese excretion and improved phosphorus retention. The inorganic-organic mineral supplementation to the diet reduced manganese excretion.
REFERENCES
Ammerman CB, Baker, DH, Lewis, AJ. Bioavailability of nutrients for animals. Amino Acids, Minerals and Vitamins. San Diego: Academic Press; 1995.
Dari RLA. Utilização de fitase na alimentação de aves. Conferencia APINCO de Ciência e Tecnologia Avícolas; 2004; Santos, São Paulo. Brasil. p.127-143.
De Faria DE, Sakamoto MI. Estratégias nutricionais para reduzir a excreção de nutrientes em frangos de corte. 5th Simpósio sobre Manejo e Nutrição de Aves e Suínos; 2008; Cascavel, Paraná. Brasil. p.81-8.
Ferket PR, Van Heugten E, Van Kempen TLTG, Angel R. Nutritional estrategies to reduce environmental emissions from nonruminants. Journal of Animal Science 2002;80(2):168-182.
Lan GQ, Abdullah N, Jalaludin S, Ho YW. Efficacy of supplementation of a phytase-producing bacterial culture on the performance and nutrient use of broiler chickens fed corn-soybean meal diets. Poultry Science 2002;81(10):1522-1532.
Lelis GR, Albino LFT, Borsatto CG, Silva CR, Rostagno HS. Efeito da suplementação de fitase no metabolismo dos nutrientes em rações de frangos de corte. Conferencia APINCO de Ciência e Tecnologia Avícolas; 2007; Santos, São Paulo. Brasil. p.64.
Munaro FA, López J, Teixeira AS, Rutz F. Aumento da disponibilidade do fósforo fítico pela adição de fitase a rações para frangos de corte. Revista Brasileira de Zootecnia 1996; 5(5):921-931.
Nollet L, Van Der Klis JD, Lensing M, Spring P. The Effect of Replacing Inorganic With Organic Trace Minerals in Broiler Diets on Productive Performance and Mineral Excretion. Journal of Applied Poultry Research 2007;16(4):592–597.
Paterson PH. Hen house ammonia: Environmental consequences and dietary strategies. Multi-state poultry meeting; 2002; Pensilvânia, Pensilvânia. United State of America. p.12.
Payne VW. Management, treatment and utilization of poultry litter with respect to environmental protection. Simpósio Internacional sobre Ambiência e Sistemas de Produção Avícola; 1998; Concórdia, Santa Catarina. Brasil. p.182-193.
Quian H, Kornegay ET, Denbow DM. Utilization of phytate phosphorus and calcium as influenced by microbial phytase, cholecalciferol, and the calcium:total phosphorus ratio in broiler diets. Poultry Science 1997;76(7):37-46.
Ravindran V, Bryden WL. Influence of dietary phytic acid and available phosphorus levels on the response of broilers to supplemental natuphos. Short course on feed technology; 1997; Ansung, Korean Society of Animal Nutrition and feedstuffs.
Rodrigues KF. Relação lisina digestível:proteína bruta em dietas para frangos de corte. [tese]. Lavras (MG): Universidade Federal de Lavras; 2006.
Rostagno HS, Albino LFT, Donzele JL, Gomes PC, Oliveira RF, Lopes DC, Ferreira AS, Barreto SLT. Tabelas brasileiras para aves e suínos: composição de alimentos e exigências nutricionais. 2 ed. Viçosa (MG): Universidade Federal de Viçosa; 2005.
Rutherfurd SM, Chung TH, Morel PCH, Moughan PJ. Effect of microbial phytase on ileal digestibility of phytase phosphorus, total phosphorus, and amino acids in a low-phosphorus diet for broilers. Poultry Science 2004;83(1):61- 68.
Sebastian S, Touchburn SP, Chavez ER. Efficacy of supplemental microbial phytase at different calcium levels on growth performance and mineral utilization of broiler chickens. Poultry Science 1996;75(12):1516-1523.
Silva DJ. Análise de alimentos (métodos químicos e biológicos). Viçosa (MG): Universidade Federal de Viçosa; 1990.
Silva YL. Redução dos níveis de proteína e fósforo em rações com fitase para frangos de corte: desempenho, digestibilidade e excreção de nutrientes [tese]. Lavras (MG): Universidade Federal de Lavras; 2004.
Simons PC, Versteegh HA, Jongbloed AW, Kemme PA, Slump P, Bos KD, Wolters MG, Beudeker RF, Verschoor GJ. Improvement of availiability by microbial phytase in broilers and pigs. British Journal of Nutrition 1990;64:525-540.
Underwood DJ, Suttle NF, editor. The Mineral Nutrition of Livestock. 3ed. Washington: CABI Publishing; 2001.
Universidade Federal de Viçosa. Sistema de análises estatísticas e genéticas - SAEG. Versão 8.0. Viçosa (MG); 2000.