ISSN 0101-2061 Food Science and Technology
DI:
D http://dx.doi.org/10.1590/1678-457X.24716
1 Introduction
The consumption of fruit juices and nectars has increased in recent years driven mainly by higher consumer awareness about the importance of choosing healthy foods to reduce the risk of developing diseases and improving quality of life (Carbonell-Capella et al., 2015). Consumers are increasingly concerned about their nutrition and fruit juice can be a great ally for a healthy diet. The fruit juices are sources of vitamins, minerals, organic acids and fiber whose effect on human health is fundamental (Jiménez-Sánchez et al., 2015).
Processing also allows adding economic value to raw materials, transforming perishable products into storable and marketable products (Paula et al., 2015). The processing of pulp and fruit juices is an important agro-industrial activity in that adds economic value to the fruit, avoiding waste and minimizing losses that may occur during the marketing of the fresh product, while also providing the producer with an alternative use for the fruit. The use of fruit species, which are often rich in vitamins, minerals and bioactive compounds, reflects in offering new alternatives of fresh fruits for consumption and raw materials for agro-industry, constituting a precious source of food (Dludemi & Akanbi, 2013).
Industries are always looking to develop differentiated products that meet the changing demands of consumers. In the beverage segment, a new market that is opening up is that of juice originating from mixed fruit (Matsuura et al., 2004). The development of mixed fruit juice or nectar is a resource available to the industry to develop unique drinks such as, for example, those with new flavors, improved color and consistency,
and moreover, mixed-fruit juices are an alternative for adding nutritional value (Sobhana et al., 2015). According to Zotarelli et al. (2008) mixed fruit products join nutritional characteristics of two or more fruits, and provide pleasant sensory characteristics in order to gradually gain prime space in the consumer market. The combination of fruit can also contribute to reducing costs of some products by the addition of cheaper fruits to high cost fruits, fill shortages.
In the preparation of mixed products, the food industry should make use of optimization tools, so that, based on the nutritional and mainly sensory characteristics; they can determine exactly the right proportion of ingredients (Lagrange & Norback, 1987). The mixed design is a very powerful tool, highly used in optimization of products, and briefly, which allows to determine which combinations of factors and levels provide the best responses (De Ketelaere et al., 2011). Experiments involving this methodology are suitable for the study of products involving more than one ingredient, such that the levels and proportions of the components in the mixture are dependent on each other, and the sum of all components always equals 1 or 100% (Cornell, 1983). Experiments involving mixture designs are commonly analyzed using response surface methodology (RSM), which is one of optimization techniques most widely used (Souza et al., 2012; Tahmouzi, 2016).
Persimmon is a highly nutritious fruit and greatly appreciated by many customers because of its taste and pleasant aroma (Chen et al., 2016). The Brazilian production of persimmons has grown in recent years (Brackmann et al., 2013). However,
Optimization of tropical fruit juice based on sensory and nutritional characteristics
Paula Nogueira CURI1, Aline Botelho de ALMEIDA2, Bruna de Sousa TAVARES2, Cleiton Antônio NUNES2, Rafael PID1, Moacir PASQUAL1, Vanessa Rios de SDUZA2*
Received 01 Sept., 2016 Accepted 11 Dec., 2016
1 Department of Agriculture, Universidade Federal de Lavras – UFLA, Lavras, MG, Brazil 2 Department of Food Science, Universidade Federal de Lavras – UFLA, Lavras, MG, Brazil
*Corresponding author: [email protected]
Abstract
The objective of this study was, through mixing design and response surface methodology, to optimize a reduced calorie mixed juice of persimmon, orange and pineapple based the sensory and nutritional characteristics. This study also aimed to carry out the survey of the physicochemical characteristics that are desirable in this product. It was found that juice of these fruits, when combined, have better sensory and nutritional characteristics than when isolated. The consumer has a preference for mixed fruit juices made up of orange, pineapple and persimmon that are sweeter and more acidic and regarding color, consumers prefer a juice with less intense red color. According to evaluation, the most recommended mixed juice formulations are 50% pineapple and 50% persimmon, and 33% pineapple, 33% persimmon, and 33% orange.
Keywords: mixed juice; persimmon; mixture design; response surface.
because the harvest is concentrated in just three months of the year and this fruit is very perishable, this hinders their marketing and consumption throughout the year (Vieites et al., 2012). Thus, one way to increase the availability to the consumer and even add more value to the end product is persimmon processing or industrialization, and the development of mixed juices with traditionally accepted, inexpensive fruits, with low perishability that are offered practically all year round, such as oranges and pineapple, are excellent choice.
Thus, the study aimed, through mixture design and response surface methodology, to optimize a reduced calorie mixed juice of persimmon, orange and pineapple based on sensory and nutritional characteristics. This study also aimed to carry out a survey of the physicochemical characteristics that are desirable in this product, i.e., jointly conduct a consumer profile study.
2 Materials and Methods 2.1 Ingredients
For the preparation of the juices only persimmon, orange and pineapple fruits were used. These fruits were harvested in the state of São Paulo (Brazil), at their physiological maturity and transported to the Post Harvest Laboratory of the Federal University of Lavras.
2.2 Experimental design
In this study, a centroid mixture design (Cornell, 1983) was used to evaluate the effects and to optimize the proportions of orange (X1), pineapple (X2) and persimmon (X3) in the juices based on their nutritional and sensory characteristics. The design and experimental levels for the 3 factors are presented in Table 1.
2.3 Juice processing
Seven fruit juice formulations were prepared in accordance with Table 1. After discarding fruit with physical or microbiological damage and manual removal of the leaves, the fruits were washed in potable water. To obtain the pulp used in the juice preparation, the pineapple and persimmons, properly peeled, were homogenized with around 30% water for about 5 min in a Poly. LS-4 industrial blender with 4.0 L capacity at a speed of 3500 rpm (Metalúrgica Siemsen Ltda, Brusque, Brazil), the orange was cut in half and squeezed into a Mondial E-10 industrial juicer (Mondial, Conceição do Jacuípe, Brazil).
The obtained juice was then finely strained and mixed according to Table 1, subsequently homogenized, subjected to heat treatment at 90 °C/30s and then bottled in 500 mL sterilized glass bottles. The juice was stored under refrigeration from 4-8 °C until analysis (12 to 24 h). The juice formulations obtained were subjected to physicochemical analysis which were performed in the Post Harvest Laboratory in three repetitions and submitted to sensory analysis which was conducted in the Sensory Analysis Laboratory.
2.4 Physicochemical analysis
To characterize the different juice formulations, the analysis of total soluble solids, total acidity, pH and color (L *, a * and b *) were performed. The total acidity, soluble solids and pH values were determined according to the Adolfo Lutz Institute- IAL (2005). The color was determined according to the method described by Gennadios et al. (1996). The L*, a* and b* values were determined using a Minolta CR 400 (Konica Minolta, São Paulo, Brazil) colorimeter with standards and D65 CIELab.
2.5 Bioactive compounds and antioxidant activity
The extracts were obtained according to the method described by Larrauri et al. (1997). The total phenolic content was determined according to the adapted Folin-Ciocalteu method (Singleton et al., 1999). The absorbance was measured at 750 nm against a blank in a spectrophotometer VIS 325–1000 nm (Biospectro SP-22; Biospectro, Curitiba, PR, Brazil) The results are expressed as g gallic acid equivalents (GAE)/100 g. The antioxidant activity was determined using the DPPH and ß-carotene methods. The DPPH free radical-scavenging capacity was estimated using the method of Brand-Williams et al. (1995). The results were expressed as EC50 (g f.w./g of DPPH). The antioxidant activity was also determined by the ß-carotene method, following the procedure described by Marco (1968) with minor modifications. The measurements were performed after 2 min and 120 min at an absorbance of 470 nm using a spectrophotometer VIS 325–1000 nm (Biospectro SP-22; Biospectro, Curitiba, PR, Brazil). The antioxidant activity was calculated as the inhibition percent relative to the control. The vitamin C content of each juice was determined by a colorimetric method with 2,4-dinitrophenylhydrazine (2,4-DNPH) according to Strohecker & Henning (1967). The results are expressed as mg ascorbic acid/100 g of fresh weight.
2.6 Sensory analysis
An acceptance test was conducted with 90 consumers (50 women and 40 men), among them students and office staff between 18 and 40 years of age, where the evaluated attributes were color, taste, texture and overall liking, through a 9-point hedonic scale (1 = extremely dislike, 9 = extremely like). Sensory evaluation of the seven fruit juice formulations was performed in two sessions, in the first session the consumers evaluated 4 fruit juice formulations and in the second session the same consumers evaluated the 3 remaining formulations. The sensory analysis was performed with the approval of the local ethics committee. Each taster assessed, on average, 5 mL of juice, which were served in 50 mL plastic cups coded with
Table 1. Composition of mixed juice samples according to the centroid mixture design.
Formulation Orange (%) Pineapple (%) Persimmon (%)
F1 100 0 0
F2 0 100 0
F3 0 0 100
F4 50 50 0
F5 50 0 50
F6 0 50 50
3 digits in a monadic manner and in a balanced order. The test was carried out in individual booths under white light and with adequate ventilation at 25 °C. The tasters were instructed in the use of the hedonic scale and to drink water between samples.
The sensory analysis was performed according to the Ethics Committee of the Federal University of Lavras, approval number 1.091.594.
2.7 Statistical analysis
Initially, for easy viewing of the juice formulation sensory acceptance and to correlated with the physicochemical parameters, a 3-way external preference map obtained by PARAFAC (Nunes et al., 2012a) was elaborated using the SensoMaker software, version 1.6. A 3-way array was arranged from matrices of i rows (i samples) and j + m columns (j consumers + m physicochemical measurements). These matrices were stacked according to k consumer attributes (color, taste, consistency, and overall liking), resulting in the 3 way array with i, j + m, and k. The individual i × j + m matrices of the consumer acceptance attributes were previously standardized (correlation matrix). The i × m portion was the same for each i × j portion of the individual matrices (Nunes et al., 2012a). The PARAFAC model was optimized using the value of Core Consistency Diagnostics (CDRCDNDIA) to choose the number of factors (Bro, 1997; Nunes et al., 2011). PARAFAC procedures and the construction of a 3-way preference map and 3-way external preference map were previously reported in detail (Nunes et al., 2011, 2012a). For a first view of the nutritional characteristics correlation with the different juice formulations, the physicochemical and texture data were analyzed by principal component analysis (PCA). Data were arranged in a matrix of 7 lines (samples) and 4 columns (bioactive compounds and antioxidant). Data were standardized (correlation matrix) and PCA was applied. Lastly, the predicted equation for the physicochemical characteristics, nutritional parameters and consumer acceptance was obtained using regression analysis. Based on the predicted model equation, a contour plot of the overall liking was generated and the optimum region for sensory acceptance obtained. Also based on nutritional characteristics, the optimized mixed juice formulation was determined. Both the analyses of variance used to examine the significance of the data fit to the model and the triangular contour plots generated from the polynomial
equations for each response were created using the Chemoface software (Nunes et al., 2012b).
3 Results and discussion
3.1 Sensory and physicochemical analysis of fruit juice formulations
Mean scores and mean test for sensory characteristics and physicochemical properties of the mixed fruit juice formulations are shown in Table 2. Figure 1 shows the 3-way external map that represents the distribution of consumers, samples, consumer sensory attributes related to acceptance and physicochemical properties. The PARAFAC was fixed with 2 factors, which led to a concordia value of 77.06% and a variance value of 37.32%.
Figure 1. Three-way external preference map (TWEPM) for sensory attributes (color, taste, consistency and overall liking [DL]) and physicochemical properties (color L∗, a∗, and b∗, pH, total acidity [TA], and soluble solids [SS]) for the mixed fruit juice formulations. F1 - orange; F2 - pineapple; F3 - persimmon; F4 - 50% orange and 50% pineapple; F5 - 50% orange and 50% persimmon; F6 - 50% pineapple and 50% persimmon; F7 - 33% orange, 33% pineapple and 33% persimmon.
Table 2. Sensory and Physicochemical analysis of the mixed fruit juice.
F Sensory attributes Physicochemical parameters
Color Taste Consist. OL SS TA pH L* a* b*
F1 7.74a 5.83a 7.18a 6.44a 5.67c 0.50a 4.87a 33.35d –1.71b 10.53a
F2 6.72b 6.59a 6.76ab 6.60a 12.33a 0.56a 4.00b 67.47a –2.49b 6.72b
F3 6.68b 4.80b 4.93c 5.12b 3.00d 0.12b 4.90a 31.21d 0.19a 10.38a
F4 7.17ab 6.59a 7.06a 6.68a 9.67b 0.56a 4.33b 33.40d –2.22b 8.43a
F5 7.04ab 5.96a 6.47ab 6.21a 6.00c 0.26a 4.43b 36.47c –1.44b 10.10a
F6 5.74c 6.46a 6.13b 6.16a 7.33c 0.30a 4.27b 43.89b –1.12b 4.21b
F7 7.04ab 6.62a 6.87a 6.78a 6.67c 0.34a 4.47b 37.30c –1.81b 9.62a
Through the TWEPM (Figure 1) and the averages table for the sensory and physicochemical parameters (Table 2), it can be seen that the most accepted juice formulations were F1 (orange), F2 (pineapple), F4 (orange and pineapple) and F7 (orange, pineapple and persimmon) followed by F5 formulations (orange and persimmon) and F6 (pineapple and persimmon). These formulations showed good acceptability with average scores located between the hedonic terms “liked slightly” and “liked very much”. The less accepted formulation was F3 (persimmon), with average sensory scores lower than the others, with a mean located between the hedonic terms “disliked slightly” and “liked very much”. It can be clearly seen that the juice prepared with only persimmon has the lowest acceptance, when persimmon is mixed with orange (F3) or pineapple (F4) in equal parts (50% each) the acceptance tends to increase and finally when persimmon is mixed with orange and with pineapple (F7) in equal parts (33.33%) the acceptance tends to be greater, equating to juices made with oranges, pineapple or a combination of both (Table 2 and Figure 1).
It was possible to verify that the persimmon, when combined with other fruits such as oranges and/or pineapple, gives rise to a sensorially acceptable juice, proving that the combination of fruit is extremely interesting and can promote the development of a more sensorially acceptable product than when made with only one fruit. This fact has been observed in several other studies, such as those of Souza et al. (2014) and Pereira et al. (2015). The improvement in sensory quality with the addition of persimmon to orange and pineapple juice was due to the combination of characteristics of fruits. Regarding the physicochemical characteristics, through TWEPM (Figure 1) and the averages table for the sensory and physicochemical parameters (Table 2), it can be seen that the most accepted formulations were characterized by having the highest levels of soluble solids, particularly those juice formulations containing pineapple (F2, F4, F6 and F7) and higher acidity, that is, higher total acidity and lower pH values.
Regarding color, the F3 formulation (persimmon) was characterized by the lowest L* value. It can be seen that the formulations that have 50% persimmon in their composition (F5 and F6) are characterized by the second group with higher red-color intensity followed by the formulation that has 33.33% persimmon (F7) (Table 2 and Figure 1). Thus, the more added persimmon in the juice, the higher the intensity of red color while also promoting browning, these characteristics appear to contribute negatively to the acceptance of the product. Finally, the color parameter b* is situated close to the formulations that have orange and persimmon in their composition, (Figure 1) so that the formulation F1 (orange), F3 (persimmon) and F4 (orange and persimmon) are the formulations with higher intensity of yellow coloration. The formulations that have not persimmon and orange in their composition (F2 and F6) are characterized by a less intense yellow coloration. As orange or persimmon are added it increases the intensity of the yellow color of the juice. Because of the location of the parameter b* in the TWEPM, it was not possible to affirm if the consumer had a greater or lesser preference for yellow color.
From these data we can see that the consumer has a preference for mixed fruit juices (orange, pineapple and persimmon) with
higher soluble solids content and higher acidity. As the sugar concentration is related to sugars and organic acids levels, consumers have a preference for sweeter juices. However, higher acidity may be desirable by the fact that, to some extent, this parameter can contribute to enhance the flavor of the fruit. Regarding the color of mixed fruit juice, the consumer prefers a lighter juice with less intense red color. The consumer does not seem to really like juice that presents a darker and reddish color, coloration typical of persimmon.
3.2 Nutritional characteristics
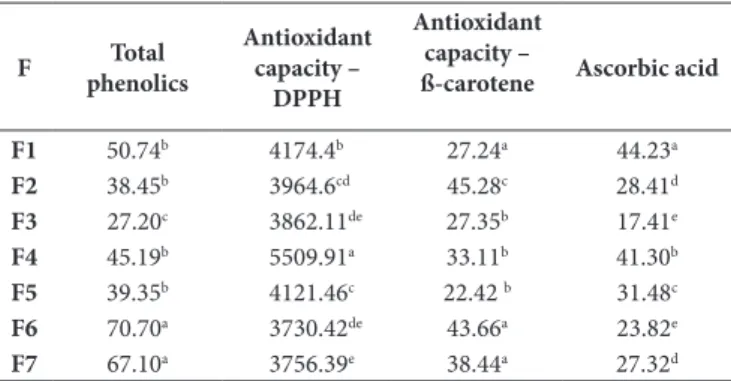
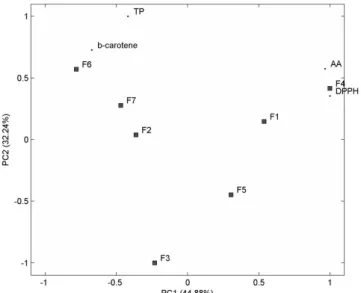
Mean scores and mean test for bioactive compounds and antioxidant activity of the mixed fruit juice formulations are shown in Table 3. The principal component analysis (PCA) was generated to correlate the bioactive compounds and antioxidant activity with mixed fruit juice formulations (Figure 2).
Through the PCA (Figure 2) and the averages table for bioactive compounds and antioxidant activity (Table 3), one can see that the F1 formulations (orange) and F4 (orange and pineapple) characterized by having the highest vitamin C content. The formulations F6 (pineapple and persimmon) and F7 (orange, pineapple and persimmon) characterized by having higher phenol content and antioxidant activity.
In general, as with the sensory acceptance, the combination of fruit seems to give rise to more nutritionally rich juices than those prepared with single fruits. For example, the phenolic compound content in the F6 (pineapple and persimmon) and F7 (orange, pineapple and persimmon) formulations is higher than the phenolic compound content in the juice formulations prepared with one of either of these fruits. According to Sobhana et al. (2015) the development of mixed fruit products is an alternative to add nutritional value since, mixed fruit products unite nutritional characteristics of two or more fruits. The increase or decrease in the content of bioactive compounds or antioxidant activity, when elaborating a mixture of two or more fruits, can be related
Table 3. The total phenolics, antioxidant capacity (dpph and ß-carotene method) and ascorbic acid content of the mixed fruit juices.
F Total
phenolics
Antioxidant capacity –
DPPH
Antioxidant capacity –
ß-carotene Ascorbic acid
F1 50.74b 4174.4b 27.24a 44.23a
F2 38.45b 3964.6cd 45.28c 28.41d
F3 27.20c 3862.11de 27.35b 17.41e
F4 45.19b 5509.91a 33.11b 41.30b
F5 39.35b 4121.46c 22.42 b 31.48c
F6 70.70a 3730.42de 43.66a 23.82e
F7 67.10a 3756.39e 38.44a 27.32d
to chemical reactions (synergistic effect) that can occur among the fruits, which should be better studied.
3.3 Optimization
The sensory and physicochemical data were subjected to response surface methodology analysis using response surface regression (RSREG), and a predicted equation was developed for each attribute (Table 4). The nutritional data of bioactive compounds and antioxidant activity was not adjusted to any model, i.e., the lack of fit for all models tested were significant. Moreover, it was not possible to adjust the sensory data of the attribute color in a satisfactory model.
A complete quadratic model was adjusted to the dependent variables, except for consistency, soluble solids, total acidity and pH, which were adjusted to linear models. All models presented
R2 values greater than 0.8 and significant (p ≤ 0.05) regressions and no significant lack-of-fit (p ≥ 0.05), indicating that they were suitable for predictions (Henika, 1982). In general, one can notice that the orange and pineapple has a major contribution to the sensory acceptance for taste, consistency and overall linking attributes than the persimmon, due to higher values of the coefficients of the predicted models (Table 4). This fact only confirms what had already been seen in the TWEPM, persimmon has a positive contribution to the juice acceptance, but this acceptance tends to decrease as the amount of persimmon increases. As studied by Souza et al. (2012) the three-way internal preference map is an alternative tool for a pre-analysis of the mixture design data. It cannot optimize a formulation, but through it one can clearly see the contribution of the factors studied in sensory acceptance.
Regarding the physicochemical properties, it can be seen through the predicted equations (Table 4) that the pineapple has a major contribution in soluble solids content of the juice, followed by orange and finally the persimmon. Regarding the acidity of the juice, pineapple and orange have a much higher contribution to the acidity than the persimmon. In relation to pH, all the fruit had a significant positive contribution.
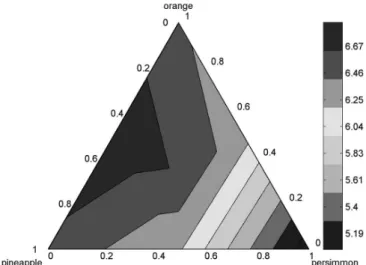
Finally, considering the L* color parameter, due to the higher coefficient the pineapple contributes more to obtaining a clearer juice followed by orange and finally persimmon (Table 4). Regarding the color parameter a*, persimmon fruit is the only one having a positive coefficient, thus, this fruit contributes to the higher intensity of red color (Table 4). Regarding the color parameter b* all fruits contribute to a more intense yellow color, with orange and persimmon having a greater contribution than pineapple (Table 4). Briefly, the addition of persimmon promotes an increase in the intensity of yellow/red and promotes browning of the juice. A contour curve was then plotted (Figure 3) using the equation for predicted overall liking (Table 4). The contour curve shows the optimal region where the average sensory acceptance scores obtained of were between 6.46 and 6.67, containing 0% to 100% orange, 0% to 100% pineapple, and 0% to 40% persimmon. As noted previously, it was expected that the orange, pineapple and a combination of both juice would be within the optimal sensory region, as they are very common fruits, well established and widely accepted by consumers. What was interesting was the fact that the addition of up to 40% persimmon in juice with
Table 4. Predicted models for sensory and physicochemical data from mixed juice samples.
Attribute Predicted model R2
Taste Y = 5.99X1* + 6.54X2* + 4.79X3* + 1.24X1X2 + 2.34X1X3 + 3.24X2X3 83.91
Consistency Y = 7.37X1* + 6.91X2* + 5.15X3* 86.20
DL Y = 6.43X1* + 6.53X2* + 5.08X3* + 1.20X1X2 + 2.10X1X3* + 1.70X2X3 88.86
SS Y = 6.47X1* + 11.80X2* + 2.87X3* 80.18
TA Y = 0.49X1* + 0.55X2* + 0.08X3 * 92.33
pH Y = 4.85X1* + 3.98X2* + 4.88X3* - 0.12X1X2 - 1.52X1X3* – 0,45X2X3 70.01 L* Y = 33.35X1* + 67.37X2* + 31.11X3* - 66.11X1X2 + 18.51X1X3* – 19.87X2X3 98.41 a* Y = - 1.70X1 - 2.48X2 + 0.20X3 - 0.67X1X2 - 2.89X1X3 - 0.07X2X3 83.14 b* Y = 10.35X1* + 6.54X2* + 10.20X3* + 2.74X1X2 + 2.10X1X3 – 13.83X2X3 70.29 * significant coefficient (p≤0.05); Drange (X1), pineapple (X2) and persimmon (X3).
mixed orange and pineapple does not influence the acceptance, thus promoting the integration of persimmon in processed products, such as juice.
As it was not feasible to obtain predictive models and contour curves for bioactive compounds and antioxidant activity, the exact optimization of the best proportions of each fruit which has a higher sensory acceptance and concurrently is the most nutritious was not possible. But from the exploratory analysis of PCA it was found that the specific formulations containing 50% pineapple and 50% persimmon (F6) and 33% pineapple, 33% persimmon and 33% orange (F7) were those that stood out nutritionally (higher levels of phenols and antioxidant activity). As these formulations that have outstanding nutritionally presents persimmon in its composition, which may contribute to increase persimmon availability to consumer and even increase the value of this fruit, and at the same time these formulations are within the optimum sensory acceptance region (Figure 3) these are mixed juice combinations suggested herein.
4 Conclusions
It is perfectly feasible and an interesting alternative to use persimmon in the preparation of a mixed juice combined with orange and pineapple. It has been found that when combined, the juice of these fruits can have better sensory and nutritional characteristics than when used individually. According to sensory and nutritional evaluation, the most recommended mixed juice formulations are 50% pineapple and 50% persimmon, and 33% pineapple, 33% persimmon, and 33% orange. The consumer has a preference for mixed fruit juices composed of orange, pineapple and persimmon, sweeter and more acidic juices and in relation to color, a lighter and less intense red color.
Acknowledgements
To FAPEMIG, CNPq and CAPES for the financial support.
References
Brackmann, A., Schorr, M. R. W., Gasperin, A. R., Venturini, T. L., & Pinto, J. A. V. (2013). Controle da maturação de caqui ‘Fuyu’ com aplicação de aminoetoxivinilglicina e 1 metilciclopropeno. Revista Brasileira de Fruticultura, 35(4), 953-961. http://dx.doi.org/10.1590/ S0100-29452013000400005.
Brand-Williams, W., Cuvelier, M. E., & Berset, C. (1995). Use of a free-radical method to evaluate antioxidant activity. Food Science and Technology (Campinas.), 28(1), 25-30. http://dx.doi.org/10.1016/ S0023-6438(95)80008-5.
Bro, R. (1997). PARAFAC: tutorial and applications. Chemometrics and Intelligent Laboratory Systems, 38(2), 149-171. http://dx.doi. org/10.1016/S0169-7439(97)00032-4.
Carbonell-Capella, J. M., Buniowska, M., María, J., Esteve, M. J., & Friola, A. (2015). Effect of Stevia rebaudiana addition on bioaccessibility of bioactive compounds and antioxidant activity of beverages based on exotic fruits mixed with oat following simulated human digestion. Food Chemistry, 184(1), 122-130. PMid:25872434. http://dx.doi. org/10.1016/j.foodchem.2015.03.095.
Chen, J., Du, J., Ge, Z. Z., Zhu, W., Nie, R., & Li, C. M. (2016). Comparison of sensory and compositions of five selected persimmon cultivars (Diospyros kaki L.) and correlations between chemical components and processing characteristics. Journal of Food Science and Technology, 53(3), 1597-1607. PMid:27570285. http://dx.doi. org/10.1007/s13197-015-2102-y.
Cornell, J. A. (1983). Experiment with mixtures: design, models and analysis of mixtures data. New York: John Wiley.
De Ketelaere, B., Goos, P., & Brijs, K. (2011). Prespecified factor level combination in the optimal design of mixture-process variable experiments. Food Quality and Preference, 22(7), 661-670. http:// dx.doi.org/10.1016/j.foodqual.2011.04.006.
Gennadios, A., Weller, C. L., Hanna, M. A., & Froning, G. W. (1996). Mechanical and barrier properties of egg albumen films. Journal of Food Science, 61(3), 585-589. http://dx.doi.org/10.1111/j.1365-2621.1996. tb13164.x.
Henika, G. R. (1982). Use of response surface methodology in sensory evaluation. Food Technology, 36, 96-101.
Instituto Adolfo Lutz – IAL. (2005). Normas analíticas do Instituto Adolfo Lutz. São Paulo: IAL.
Jiménez-Sánchez, C., Lozano-Sánchez, J., Marti, N., Saura, D., Valero, M., Segura-Carretero, A., & Fernández-Gutiérrez, A. (2015). Characterization of polyphenols, sugars, and other polar compounds in persimmon juices produced under different technologies and their assessment in terms of compositional variations. Food Chemistry, 182(1), 282-291. PMid:25842339. http://dx.doi.org/10.1016/j. foodchem.2015.03.008.
Lagrange, V., & Norback, J. P. (1987). Product optimization and the acceptor set size. Journal of Sensory Studies, 2(2), 119-136. http:// dx.doi.org/10.1111/j.1745-459X.1987.tb00192.x.
Larrauri, J. A., Ruperez, P., & Saura-Calixto, F. (1997). Effect of drying temperature on the stability of polyphenols and antioxidant activity of red grape pomace peels. Journal of Agricultural and Food Chemistry, 45(4), 1390-1393. http://dx.doi.org/10.1021/jf960282f.
Marco, G. I. (1968). Rapid method for evaluation of antioxidants. Journal of the American Oil Chemists’ Society, 45(9), 594-598. http://dx.doi. org/10.1007/BF02668958.
Matsuura, F. C. A. U., Folegatti, M. I. D., Cardoso, L., & Ferreira, D. C. (2004). Sensory acceptance of mixed nectar of pa paya, passion fruit and acerola. Scientia Agricola, 61(6), 604-608. http://dx.doi. org/10.1590/S0103-90162004000600007.
by means of Folin-Ciocalteu reagent. Methods in Enzymology, 299, 152-178. http://dx.doi.org/10.1016/S0076-6879(99)99017-1. Sobhana, A., Mathew, J., Ambili Appukutan, A., & Mredhula Raghavan,
C. (2015). Blending of cashew apple juice with fruit juices and spices for improving nutritional quality and palatability. Acta Horticulturae, 1080(1), 369-375. http://dx.doi.org/10.17660/ActaHortic.2015.1080.49. Souza, V. R., Pereira, P. A. P., Pinheiro, A. C. M., Nunes, C. A., Silva, T. L. T., Borges, S. V., & Queiroz, F. (2012). Multivariate approaches for optimization of the acceptance: optimization of a brazilian Cerrado fruit jam using mixture design and Parallel factor analysis. Journal of Sensory Studies, 27(6), 417-424. http://dx.doi.org/10.1111/joss.12005. Souza, V. R., Pereira, P. A. P., Pinheiro, A. C. M., Nunes, C. A., Pio, R., & Queiroz, F. (2014). Evaluation of the jelly processing potential of raspberries adapted in Brazil. Journal of Food Science, 79(3), 407-412. PMid:24467459. http://dx.doi.org/10.1111/1750-3841.12354.
Strohecker, R., & Henning, H. M. (1967). Analisis de vitaminas: metodos comprobados. Madrid: Paz Montalvo.
Tahmouzi, S. (2016). Dptimization of oxidative stability, color and sensory properties of uncured (nitrite-free) Asian hot dogs (Jigo) using response surface methodology (RSM). Journal of Food Science and Technology, 53(1), 381-390. PMid:26787957. http://dx.doi. org/10.1007/s13197-015-1970-5.
Vieites, R. L., Picanço, N. F. M., & Daiuto, E. R. (2012). Radiação Gama na conservação de caqui ‘Giombo’, destanizado e frigoarmazenado. Revista Brasileira de Fruticultura, 34(3), 719-726. http://dx.doi. org/10.1590/S0100-29452012000300010.
Zotarelli, M. F., Zanatta, C. L., & Clemente, E. (2008). Avaliação de geleias mistas de goiaba e maracujá. Revista Ceres, 55(6), 562-567. Nunes, C. A., Bastos, S. C., Pinheiro, A. C. M., Pimenta, C. J., & Pimenta,
M. E. S. G. (2012a). Relating consumer acceptance to descriptive attributes by three-way external preference mapping obtained by parallel factor analysis (PARAFAC). Journal of Sensory Studies, 27(4), 209-216. http://dx.doi.org/10.1111/j.1745-459X.2012.00387.x. Nunes, C. A., Freitas, M. P., Pinheiro, A. C. M., & Bastos, S. C. (2012b). Chemoface: a novel free user-friendly interface for chemometrics. Journal of the Brazilian Chemical Society, 23(11), 2003-2010. http:// dx.doi.org/10.1590/S0103-50532012005000073.
Nunes, C. A., Pinheiro, A. C. M., & Bastos, S. C. (2011). Evaluating consumer acceptance tests by three-way internal preference mapping obtained by parallel factor analysis (PARAFAC). Journal of Sensory Studies, 26(2), 167-174. http://dx.doi.org/10.1111/j.1745-459X.2011.00333.x.
Dludemi, F. D., & Akanbi, C. T. (2013). Chemical, antioxidant and sensory properties of tomato-watermelon-pineapple blends, and changes in their total antioxidant capacity during storage. International Journal of Food Science & Technology, 48(7), 1416-1425. http:// dx.doi.org/10.1111/ijfs.12104.
Paula, F. J. A., Guiné, R. P. F., Cruz-Lopes, L., Duarte, A. C., Fragata, A. D. S., & Reis, M. A. L. (2015). Effects of pre- and post-parvest factors on the selected elements contents in fruit juices. Czech Journal of Food Sciences, 33(4), 384-391. http://dx.doi.org/10.17221/531/2014-CJFS. Pereira, A. C. S., Wurlitzer, N. J., Dionísio, A. P., Soares, M. V. L.,
Bastos, M. D. S. R., Alves, R. E., & Brasil, I. M. (2015). Synergistic, additive and antagonistic effects of fruit mixtures on total antioxidant capacities and bioactive compounds in tropical fruit juices. Archivos Latinoamericanos de Nutricion, 65(2), 119-127. PMid:26817384. Singleton, V. L., Drthofer, R., & Lamuela-Raventos, R. M. (1999). Analysis
![Figure 1. Three-way external preference map (TWEPM) for sensory attributes (color, taste, consistency and overall liking [DL]) and physicochemical properties (color L∗, a∗, and b∗, pH, total acidity [TA], and soluble solids [SS]) for the mixed fruit jui](https://thumb-eu.123doks.com/thumbv2/123dok_br/15926318.676284/3.892.462.829.364.721/figure-external-preference-sensory-attributes-consistency-physicochemical-properties.webp)