Repositório ISCTE-IUL
Deposited in Repositório ISCTE-IUL: 2018-12-12Deposited version: Post-print
Peer-review status of attached file: Peer-reviewed
Citation for published item:
Pestana, M. H., Wang, W.-C. & Moutinho, L. A. (2018). Global affective computing research in the period 1997-2017: a bibliometric analysis. International Journal of Multivariate Data Analysis. 1 (4), 348-370
Further information on publisher's website: 10.1504/IJMDA.2018.096076
Publisher's copyright statement:
This is the peer reviewed version of the following article: Pestana, M. H., Wang, W.-C. & Moutinho, L. A. (2018). Global affective computing research in the period 1997-2017: a bibliometric analysis. International Journal of Multivariate Data Analysis. 1 (4), 348-370, which has been published in final form at https://dx.doi.org/10.1504/IJMDA.2018.096076. This article may be used for
non-commercial purposes in accordance with the Publisher's Terms and Conditions for self-archiving.
Use policy
Creative Commons CC BY 4.0
The full-text may be used and/or reproduced, and given to third parties in any format or medium, without prior permission or charge, for personal research or study, educational, or not-for-profit purposes provided that:
• a full bibliographic reference is made to the original source • a link is made to the metadata record in the Repository • the full-text is not changed in any way
The full-text must not be sold in any format or medium without the formal permission of the copyright holders.
Serviços de Informação e Documentação, Instituto Universitário de Lisboa (ISCTE-IUL) Av. das Forças Armadas, Edifício II, 1649-026 Lisboa Portugal
Phone: +(351) 217 903 024 | e-mail: [email protected] https://repositorio.iscte-iul.pt
1
Global Affective Computing Research in the Period 1997-2017: A Bibliometric Analysis
ABSTRACT
Notable fallouts in marketing and financial market prediction have raised the interest by the scientific
community and the business world in Affective Computing (AfC). Automatically recognizing and responding to a user’s affective states, AfC shows a great potential to improve companies capabilities of customer relationship management. The aim of this study is to evaluate this filed of research during the last twenty years, identifying for one side its evolution, by the major publications, citations, journals, authors, productive countries,
productive institutions, and collaboration patterns; and for another side, identifying its trends through the analysis of research hotspots, burst keywords and areas of research done so far. This bibliometric analysis is based on the science citation index expanded (SCI-E), from the Institute of Scientific Information Web-of-Science, which is now firmly established as an integral part of research evaluation methodology especially within the scientific and applied fields. The results show a significant 4.19 rate of growth in AfC, doubling the number of publications in 4.02 years time. This field of interest is paving the way for creativity and innovation, and provides opportunities for its greater development. The authors expect to contribute to the theory, supplying researchers with new tools and enabling practitioners to improve their marketing strategies, constantly interested in collecting and predicting the attitudes of the consumers toward their products, brands or services.
Keywords: Affective Computing, bibliometric analysis, Scientific outputs, Collaboration network, Research
2
1. Introduction
Affective Computing (AfC), is a computational system that aspires to respond to the affective states of the user, narrowing the communicative gap between the highly emotional human and the emotionally challenged computer (Calvo & D’Mello 2010). Its relevance can be seen in various scenarios in which there is a benefit from knowing information about user’s emotions. This is the case of persuasive technologies, which aim to explore how to obtain behavioral changes (cognitive or emotional) in its users (Fogg, 1998; Torning & Oinas-Kukkonen, 2009), or to detect several affective states, such as frustration, inducing consumers to have
appropriate positive responses (Kappor, Burleson, & Picard, 2007). Automatically recognizing and responding to a user’s affective states during interactions with a computer enables companies to enhance the quality of the interaction. In this way, AfC shows a great potential to improve companies capabilities of customer relationship management in order to increase their marketing strategies, constantly interested in collecting and predicting the attitudes of the general public toward their products and brands (Rukavina et al. 2016).
Emotions are composed of behavioral, expressive, physiological, and subjective reactions, or feelings (Desmet, 2005), and influence the way a person appropriates a product and its use in the long term (Holbrook, 1986). Emotions modulate almost all modes of human communication (Picard, Vyzas and Healey, 2001), signaling when events are favourable or harmful (Frijda, 1986), playing an important role not only in successful and effective human-human communication, as well as in human’s rational learning (Cambria, 2016). They may be monitored through several techniques, like computing systems (objective) and by asking users to self-report their own emotions (Lopatvoska & Arapakis, 2011). There have been relatively few attempts to develop applications in marketing specifically to support the evaluation of emotions using computer-based tools, namely through affective computing (AfC), which requires collaboration between brand researchers and skilled
engineers and psychologists. The measurement of emotions is critical for commercial purposes (Lang, 2014). We present a bibliometric analysis of research work done on AfC during 1997 till November 2017, using data from the science citation index expanded database (SCI-E), from Web-of-Science. To obtain a more accurate trajectory, we identify the most productive publications, authors, institutes, journals, countries (e.g. Sakai et al. 2011), citations (e.g. Wen and Huang 2012; Piryani et al. 2017), keywords distribution (e.g. Li et al. 2009; Mao et al. 2010; Wang et al. 2013), research hotspots,and areas of research (e.g. Zhou & Zhao 2015). The study’s outcomes will provide researchers with all-around insights into the current state and will establish where further research is required. The analytical mapping can answer the following research questions about AfC:
• What are the main areas and documents of research? • How research publications have grown over time?
• In which countries and institutions most of the research work has been done? • What are the top publication sources?
• Who are the most productive and more cited authors?
• What are the collaboration of authors, countries and institutions? • What are the hot issues and trends observed?
Bibliometric analysis is now firmly established as an integral part of research evaluation methodology especially within the scientific and applied fields (Ellegaard & Wallin, 2015). Following the same authors, the use of bibliometric methods is obviously driven by a need to evaluate scientific production and making the
3 results available to policymakers, scientists or other stakeholders. Researchers become aware of the new trends, competing groups and possibilities for scientific cooperation (Barth, Haustein, & Scheidt, 2014).
Our paper identifies the course of development and analyze different aspects of AfC research. The results obtain a useful overview and understanding of this field from 1997 to the current state of art. To the best of our knowledge, this work is the first of its kind. The rest of the paper is organized as follows: Section 2 describes the material and methods used. Section 3 presents the analytical results and discussion. Finally, Section 4 concludes with a summary of the work, its usefulness and limitations.
2. Material and methods
The following dimensions were selected as a basis to measure the global research in AfC: publications, citations, journals, keywords, countries, authors, institutions, research areas, and trends. The underlying data originate in the tabulation of each dimension came from the online version of science citation index expanded the database, from the Institute of Scientific Information Web-of-Science database (WoS). The WoS is a leading and frequently used metric of scientific accomplishment in most fields of human creativity (Li et al. 2009). Since January 1997 until November 2017, there were 2,239 documents with keywords affective computing, in the topic field, distributed through 94 areas, where the top 14, corresponding to 87.2% of all AfC research are represented in Fig 1. The two major areas are Computer Science (37.2%) and Engineering (17.5%), totalizing 54.7% of all research.
Fig.1: Percentage of research areas of Affective Computing extracted from SCI_E
Within the WoS references obtained, the focus of the present research is proceedings paper (48.97%) and articles (45.36%), which constitute 94.37% of the document type (Fig.2).
37.2 17.5 7.9 7.3 4.9 2.8 2.4 1.9 1.4 1.0 1.0 0.9 0.9 0.0 5.0 10.0 15.0 20.0 25.0 30.0 35.0 40.0 Computer Science Engineering Neurosciences Neurology Psychiatry Psychology Telecommunications Education Educational Research Robotics Automation Control Systems Mathematical Computational Biology Medical Informatics Imaging Science Photographic Technology Acoustics
4
Fig.2: Document type extracted from Web-of-Science during 1997-2017 on Affective Computing
To provide more scientific and accurate information about our research, only documents with the search keywords in the front page were searched out for further analysis (Fu et al. 2012). The most cited documents should have at least a total of 100 citations in the surveyed period (Chuang et al. 2013), originating for the present research 94 highly cited documents. Similarly, amongst 5,922 authors in AfC, there are 48 authors highly cited.
The global scientific outputs were generated using CiteSpace (http://cluster.cis.drexel.edu/~cchen/citespace/), Carrot (http://search.carrotsearch.com/carrot2-webapp), CitNetExplorer (http://www.citnetexplorer.nl/), and Vosviewer (http://www.vosviewer.com/). The method to evaluate the global research in AfC is shown in Fig.3.
CiteNetExplorer CiteSpace Carrot VOSviewer Scientific outputs
Web-of-Science Documents Documents 94 More cited documents Science Citation Index Expanded 2,239 2,121 48 More cited authors
Areas: Top 13 (Fig. 1) Articles and Citations >= 100 Year Published: 1997-2017 Proceedings during 1997- 2017 Papers
Fig.3: Method to evaluate the global research in Affective Computing
The scientific output includes publications, citations, journals, keywords, countries, authors, institutions, research areas, and trends. Collaboration and contributions of different countries and institutions were estimated by the affiliation of at least one author to the publication.
3. Results and Discussion
48.97 45.36 3.57 1.37 0.34 0.26 0.09 0.04 0.00 10.00 20.00 30.00 40.00 50.00 60.00 Proceedings Paper Article Review Editorial Material Meeting Abstract Book Review Note Reprint
5
3.1 Year-wise publication and growth pattern
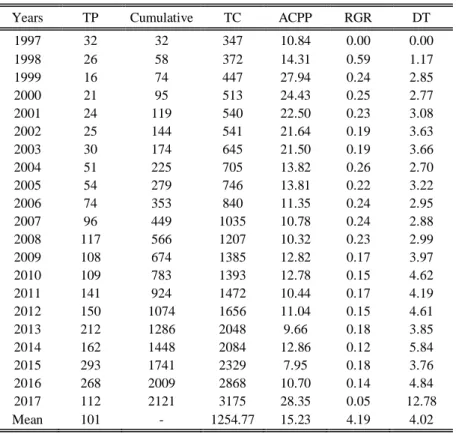
The analytical methodology used by the authors involve computing different indicators as defined in standard bibliometric literature. The main indicators include TP (total number of publications), TC (total number of citations), Average Citations Per Publication (ACPP), Relative Growth rate (RGR) and Doubling Time (DT), which measure the time required for the number of publications in a particular year to become double. ACPP is defined as: 𝐴𝐶𝑃𝑃 = 𝑇𝐶/𝑇𝑃. According to Mahapatra (1985), the rate of growth with respect to time and doubling time are defined as follow, where Ni and Ni-1 are the number of publications in the years 𝑖 and 𝑖 − 1:
𝑅𝐺𝑅𝑖 = ln( 𝑁𝑖) − ln (𝑁𝑖−1) 𝐷𝑇𝑖 = 𝑙𝑛2/𝑅𝐺𝑅𝑖
The authors have computed the parameters RGRi, DTi and ACPP (Table 1). Over the past 20 years the average number of publications (101) and citations (1254.77), indicate that on average each publication was read 15.23 times. AfC has now emerged as is a wide research area, with applications into different domains.
The results show that RGR between 1999-2001 and 2004-2008 almost double to values in 2014 and 2016. The mean RGR and mean DT are also calculated for the all period. It can be seen that as RGR increases, DT
decreases. The mean of RGT indicates that the relative rate of growth for the period is 4.19. A DT value of 4.02 indicates that the number of research publications is doubling in 4.02 years time, which is an indicator of some slow growth in amount of research work being done on this domain.
Table 1: Year-wise output and growth pattern.
Years TP Cumulative TC ACPP RGR DT 1997 32 32 347 10.84 0.00 0.00 1998 26 58 372 14.31 0.59 1.17 1999 16 74 447 27.94 0.24 2.85 2000 21 95 513 24.43 0.25 2.77 2001 24 119 540 22.50 0.23 3.08 2002 25 144 541 21.64 0.19 3.63 2003 30 174 645 21.50 0.19 3.66 2004 51 225 705 13.82 0.26 2.70 2005 54 279 746 13.81 0.22 3.22 2006 74 353 840 11.35 0.24 2.95 2007 96 449 1035 10.78 0.24 2.88 2008 117 566 1207 10.32 0.23 2.99 2009 108 674 1385 12.82 0.17 3.97 2010 109 783 1393 12.78 0.15 4.62 2011 141 924 1472 10.44 0.17 4.19 2012 150 1074 1656 11.04 0.15 4.61 2013 212 1286 2048 9.66 0.18 3.85 2014 162 1448 2084 12.86 0.12 5.84 2015 293 1741 2329 7.95 0.18 3.76 2016 268 2009 2868 10.70 0.14 4.84 2017 112 2121 3175 28.35 0.05 12.78 Mean 101 - 1254.77 15.23 4.19 4.02
Search results from SCI-E and from the authors (2017)
The number of published documents for each of the years 1997 to November 2017 are represented on a year-wise plot (Fig.4). This curve, with a 4.19 RGR, show a steep rise after 2014. The lesser number in 2017 is understandable since many of publications from 2017 are yet to be indexed in WoS database.
6
Fig.4: Year-wise publications in Affective Computing.
Search results from SCI-E
3.2 Country-wise distribution and international collaboration
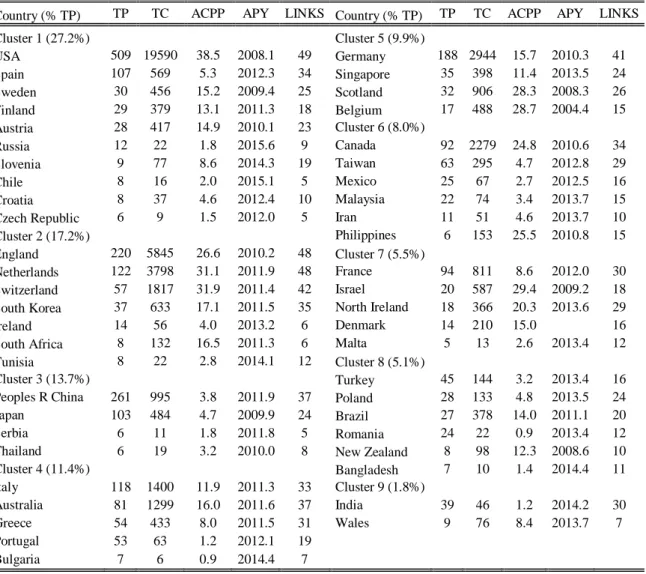
The country-wise distribution of AfC research publications (e.g. Wang et al. 2012) during the full 20 years period, allow understanding the places where the research work was originated and progressed during the 1997-2017 period. Moreover, the metadata of publications records was analysed to extract those instances which contain authors from at least two different countries. VOSviewer was used to represent the collaboration
between countries that have produced more than 5 documents. Amongst a total of 76 countries from SCI-E, there are 50 that have published more than 5 publications in this domain, during 1997-2017, which have been
aggregated into 9 homogeneous clusters of research collaboration. Table 2 list those countries, analysed according to the total number of publications (TP), the total number of citations (TC), the average number of citations per publication (ACPP), the average mean year of publication (APY), and their links(LINKS), which represent the citations received and those given to other countries. It can also be seen the percentage of the collaboration of each cluster to the total publications (% TP), where the major cluster is 1, contribute in 27.2%, to the research development while the smallest one is cluster 9, contribute in 1.8%.
The most productive countries in AfC, with more than 100 publications (Chuang et al. 2013), are USA (509), Peoples R China (261), England (220), Germany (188), Netherlands (122), Italy (118), Spain (107) and Japan (103). Domination in the publication is not surprising from these mainstream countries since this pattern occurred in most scientific fields, showing a correlation between investigation and Gross Domestic Product (Zhou and Zhao 2015).
A strong core of research (TP) comes from the USA, followed by England, Netherlands and Germany. According to each cluster link strength, four groups with strong collaborations on this research occurs between the USA, Spain and Sweden; between England, Netherlands, Switzerland and South Korea; between Peoples R China and Japan; and between Italy, Greece, Portugal and Australia.
The proportion of citations per publication were also calculated.In the USA, each paper is on average cited 38.5 times, flowed by Switzerland with 31.9 times and Netherlands with 31.1 times.
0 500 1000 1500 2000 2500 1997 1998 1999 2000 2001 2002 2003 2004 2005 2006 2007 2008 2009 2010 2011 2012 2013 2014 2015 2016 2017
7 Moreover, it can be observed that most of the initial papers also come from the USA, with the average year of 2008.1 for publications (APY), followed by Scotland with 2008.3 (APY). The more recent countries in the topic research, with an average year of publication 2015, are Chile and Colombia.
In general, a total of 82.9% research publications involve international collaboration. Only 13 of 76 countries work isolated in terms of AfC research. Table 2 identify the countries that have at least one international
collaboration, and therefore the isolated countries are not represented.
Table 2: Country-wise Affective Computing contribution and
international research collaboration.
Country (% TP) TP TC ACPP APY LINKS Country (% TP) TP TC ACPP APY LINKS Cluster 1 (27.2%) Cluster 5 (9.9%) USA 509 19590 38.5 2008.1 49 Germany 188 2944 15.7 2010.3 41 Spain 107 569 5.3 2012.3 34 Singapore 35 398 11.4 2013.5 24 Sweden 30 456 15.2 2009.4 25 Scotland 32 906 28.3 2008.3 26 Finland 29 379 13.1 2011.3 18 Belgium 17 488 28.7 2004.4 15 Austria 28 417 14.9 2010.1 23 Cluster 6 (8.0%) Russia 12 22 1.8 2015.6 9 Canada 92 2279 24.8 2010.6 34 Slovenia 9 77 8.6 2014.3 19 Taiwan 63 295 4.7 2012.8 29 Chile 8 16 2.0 2015.1 5 Mexico 25 67 2.7 2012.5 16 Croatia 8 37 4.6 2012.4 10 Malaysia 22 74 3.4 2013.7 15 Czech Republic 6 9 1.5 2012.0 5 Iran 11 51 4.6 2013.7 10 Cluster 2 (17.2%) Philippines 6 153 25.5 2010.8 15 England 220 5845 26.6 2010.2 48 Cluster 7 (5.5%) Netherlands 122 3798 31.1 2011.9 48 France 94 811 8.6 2012.0 30 Switzerland 57 1817 31.9 2011.4 42 Israel 20 587 29.4 2009.2 18 South Korea 37 633 17.1 2011.5 35 North Ireland 18 366 20.3 2013.6 29 Ireland 14 56 4.0 2013.2 6 Denmark 14 210 15.0 16 South Africa 8 132 16.5 2011.3 6 Malta 5 13 2.6 2013.4 12 Tunisia 8 22 2.8 2014.1 12 Cluster 8 (5.1%) Cluster 3 (13.7%) Turkey 45 144 3.2 2013.4 16 Peoples R China 261 995 3.8 2011.9 37 Poland 28 133 4.8 2013.5 24 Japan 103 484 4.7 2009.9 24 Brazil 27 378 14.0 2011.1 20 Serbia 6 11 1.8 2011.8 5 Romania 24 22 0.9 2013.4 12 Thailand 6 19 3.2 2010.0 8 New Zealand 8 98 12.3 2008.6 10 Cluster 4 (11.4%) Bangladesh 7 10 1.4 2014.4 11 Italy 118 1400 11.9 2011.3 33 Cluster 9 (1.8%) Australia 81 1299 16.0 2011.6 37 India 39 46 1.2 2014.2 30 Greece 54 433 8.0 2011.5 31 Wales 9 76 8.4 2013.7 7 Portugal 53 63 1.2 2012.1 19 Bulgaria 7 6 0.9 2014.4 7
Search results from SCI-E and VoSViewer
3.3 Institution Analysis
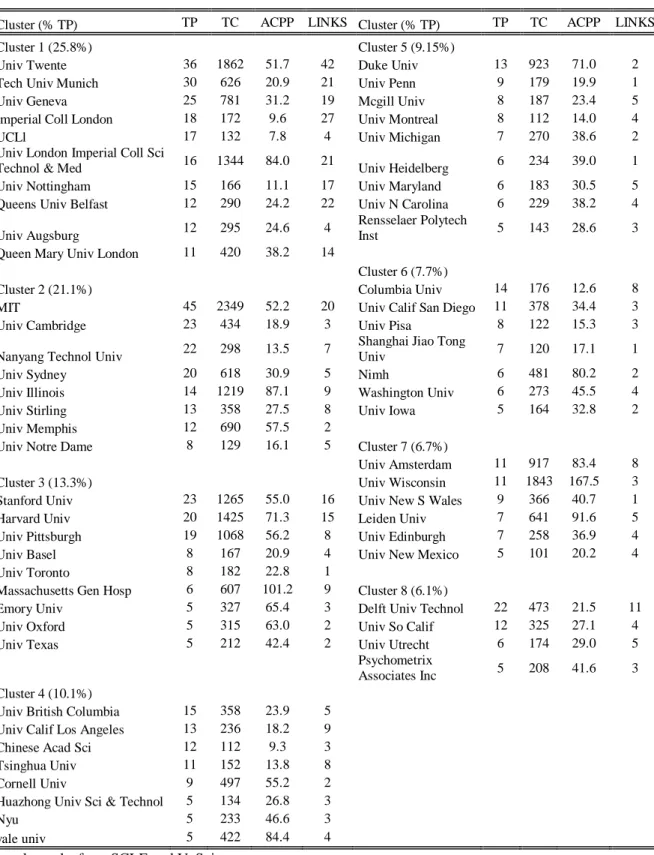
To understand the institution-level research output share and dynamics, the authors have tried to identify the highest cited institutions (citations >= 100) contributing significantly to AfC research, and the collaboration between them. Through SCI-E, were identified 1,825 institutions that have published scholarly publications related to this research. There are 68 highly cited institutions. However, only 61 institutions or 3.3% of the total, are connected to each other in the network. Table 3 list those institutions aggregated in 8 clusters of
collaboration, all playing an important role in the research activities. The most productive collaboration comes from cluster 1, contributing with 25.8% of the total publications, until cluster 8, contributing with 6.1% of the
8 total publications in AfC. There is the predominance of institutions of USA. MIT perform the best, with the highest number of publications (45) and citations (2349), followed by Univ Twente, with 36 TP and 1862 TC. This last university have the highest number of links with other institutions (42 LINKS). On the other hand, on ACPP indicator, Univ Wisconsin (167.5) and Massachusetts Gen Hosp (101.2) have the best performance.
Table 3: Most productive institutions on Affective Computing research.
Cluster (% TP) TP TC ACPP LINKS Cluster (% TP) TP TC ACPP LINKS Cluster 1 (25.8%) Cluster 5 (9.15%) Univ Twente 36 1862 51.7 42 Duke Univ 13 923 71.0 2 Tech Univ Munich 30 626 20.9 21 Univ Penn 9 179 19.9 1 Univ Geneva 25 781 31.2 19 Mcgill Univ 8 187 23.4 5 Imperial Coll London 18 172 9.6 27 Univ Montreal 8 112 14.0 4
UCLl 17 132 7.8 4 Univ Michigan 7 270 38.6 2
Univ London Imperial Coll Sci
Technol & Med 16 1344 84.0 21 Univ Heidelberg 6 234 39.0 1 Univ Nottingham 15 166 11.1 17 Univ Maryland 6 183 30.5 5 Queens Univ Belfast 12 290 24.2 22 Univ N Carolina 6 229 38.2 4 Univ Augsburg 12 295 24.6 4
Rensselaer Polytech
Inst 5 143 28.6 3
Queen Mary Univ London 11 420 38.2 14
Cluster 6 (7.7%)
Cluster 2 (21.1%) Columbia Univ 14 176 12.6 8 MIT 45 2349 52.2 20 Univ Calif San Diego 11 378 34.4 3 Univ Cambridge 23 434 18.9 3 Univ Pisa 8 122 15.3 3 Nanyang Technol Univ 22 298 13.5 7
Shanghai Jiao Tong
Univ 7 120 17.1 1
Univ Sydney 20 618 30.9 5 Nimh 6 481 80.2 2
Univ Illinois 14 1219 87.1 9 Washington Univ 6 273 45.5 4 Univ Stirling 13 358 27.5 8 Univ Iowa 5 164 32.8 2
Univ Memphis 12 690 57.5 2
Univ Notre Dame 8 129 16.1 5 Cluster 7 (6.7%)
Univ Amsterdam 11 917 83.4 8
Cluster 3 (13.3%) Univ Wisconsin 11 1843 167.5 3 Stanford Univ 23 1265 55.0 16 Univ New S Wales 9 366 40.7 1 Harvard Univ 20 1425 71.3 15 Leiden Univ 7 641 91.6 5 Univ Pittsburgh 19 1068 56.2 8 Univ Edinburgh 7 258 36.9 4 Univ Basel 8 167 20.9 4 Univ New Mexico 5 101 20.2 4
Univ Toronto 8 182 22.8 1
Massachusetts Gen Hosp 6 607 101.2 9 Cluster 8 (6.1%) Emory Univ 5 327 65.4 3 Delft Univ Technol 22 473 21.5 11 Univ Oxford 5 315 63.0 2 Univ So Calif 12 325 27.1 4 Univ Texas 5 212 42.4 2 Univ Utrecht 6 174 29.0 5
Psychometrix
Associates Inc 5 208 41.6 3
Cluster 4 (10.1%)
Univ British Columbia 15 358 23.9 5 Univ Calif Los Angeles 13 236 18.2 9
Chinese Acad Sci 12 112 9.3 3
Tsinghua Univ 11 152 13.8 8
Cornell Univ 9 497 55.2 2
Huazhong Univ Sci & Technol 5 134 26.8 3
Nyu 5 233 46.6 3
yale univ 5 422 84.4 4
Search results from SCI-E and VoSviewer
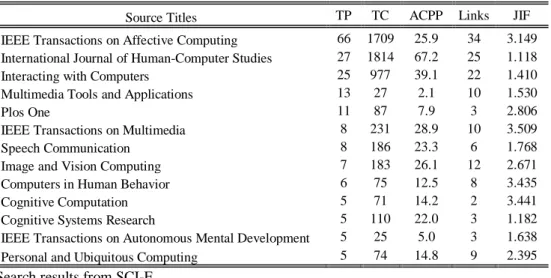
9 Research articles on AfC appear in 1270 journals included in WoS. The 13 major journals are represented in Table 4. The journal impact fact (JIF), based on Science Citation Index (SCI), is defined as the yearly average number of citations to recent articles published in that journal, and is used as a proxy for the relative importance of a journal withing its field. Therefore, JIF based on 2016, is the number of citations received in that year, of articles published in that journal during the two preceding years, divided by the number of articles published in that journal during the two preceeding years:
𝐽𝐼𝐹2016= 𝑇𝐶2015+ 𝑇𝐶𝑦2014 𝑇𝑃𝑦2015+ 𝑇𝑃𝑦2014
Journals with higher impact factors are often deemed to be more important than those with lower ones. IEEE Transactions on Affective Computing, with JIF of 3.149 in 2016, published the largest number of high-quality papers in this domain, with 66 papers receiving 1709 citations in other publications. IEEE Transactions on Multimedia has the highest impact factor (3.509), while International Journal of Human-Computer Studies, has the lower impact factor (1.118) of these top journals. The International Journal of Human-Computer Studies have the highest ACPP value for the research publications.
Table 4: The most active 13 journals in Affective Computing research.
Source Titles TP TC ACPP Links JIF IEEE Transactions on Affective Computing 66 1709 25.9 34 3.149 International Journal of Human-Computer Studies 27 1814 67.2 25 1.118 Interacting with Computers 25 977 39.1 22 1.410 Multimedia Tools and Applications 13 27 2.1 10 1.530
Plos One 11 87 7.9 3 2.806
IEEE Transactions on Multimedia 8 231 28.9 10 3.509
Speech Communication 8 186 23.3 6 1.768
Image and Vision Computing 7 183 26.1 12 2.671 Computers in Human Behavior 6 75 12.5 8 3.435
Cognitive Computation 5 71 14.2 2 3.441
Cognitive Systems Research 5 110 22.0 3 1.182 IEEE Transactions on Autonomous Mental Development 5 25 5.0 3 1.638 Personal and Ubiquitous Computing 5 74 14.8 9 2.395
Search results from SCI-E
3.5 Most productive and most cited authors
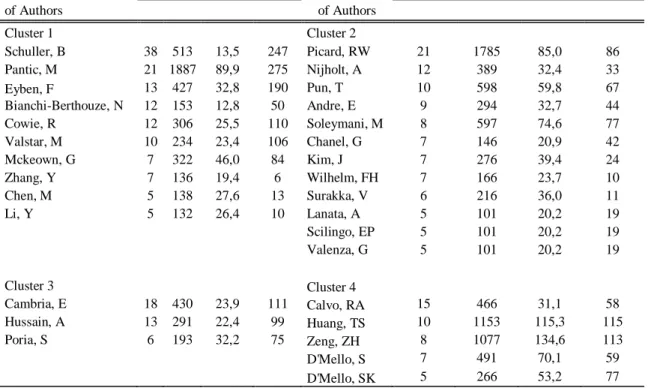
High productive authors are those who produce a high amount of research publications during the given period. Similarly, high cited authors are those whose research work published during a given period is cited the most (Piryani, Madhavi & Singh 2017), corresponding to a minimum of 100 citations in the surveyed period (Chuang et al. 2013). Overall 5,922 authors have published scholarly publications related to AfC, and 48 or 0.8% of them are highly cited, contributing 20.5% to the TP. SCI-E and VOSviewer were used to represent these authors aggregated into homogenous clusters of research collaboration. Table 5 shows the highly productive 25 authors, which are aggregated into 4 clusters of co-collaboration, displayed by decreasing order of PT research. The top five more productive authors (according to TP) in AfC research are Schuller B, Pantic M, Picard RM, Cambria E, and Calvo RA. Pantic M, Picard RW, Huang TS and Zeng ZH, are the author more cited. Clearly, according to link strength, Schuller B, Pantic M., Cowie R. and Valstar M., stand up by their production and collaboration in AfC research.
Table 5: Co-authorship network of highly productive authors in Affective Computing.
10 of Authors of Authors Cluster 1 Cluster 2 Schuller, B 38 513 13,5 247 Picard, RW 21 1785 85,0 86 Pantic, M 21 1887 89,9 275 Nijholt, A 12 389 32,4 33 Eyben, F 13 427 32,8 190 Pun, T 10 598 59,8 67 Bianchi-Berthouze, N 12 153 12,8 50 Andre, E 9 294 32,7 44 Cowie, R 12 306 25,5 110 Soleymani, M 8 597 74,6 77 Valstar, M 10 234 23,4 106 Chanel, G 7 146 20,9 42 Mckeown, G 7 322 46,0 84 Kim, J 7 276 39,4 24 Zhang, Y 7 136 19,4 6 Wilhelm, FH 7 166 23,7 10 Chen, M 5 138 27,6 13 Surakka, V 6 216 36,0 11 Li, Y 5 132 26,4 10 Lanata, A 5 101 20,2 19 Scilingo, EP 5 101 20,2 19 Valenza, G 5 101 20,2 19 Cluster 3 Cluster 4 Cambria, E 18 430 23,9 111 Calvo, RA 15 466 31,1 58 Hussain, A 13 291 22,4 99 Huang, TS 10 1153 115,3 115 Poria, S 6 193 32,2 75 Zeng, ZH 8 1077 134,6 113 D'Mello, S 7 491 70,1 59 D'Mello, SK 5 266 53,2 77
Source SCI-E, CitNetExplorer and VOSviewer
Further, by using CiteSpace, it can be observed the top references with strongest burst citations in AfC research publication data obtained. Burst detection can identify documents emerging over time, having statistically significant fluctuations on the citation count, during a short period of time. The time interval is depicted as a blue line. The period time in which a document was found to have a burst is shown as a red line segment, indicating the beginning year and the ending year of the duration of the burst. The results give an idea about the initial research papers on AfC which are being cited often by researchers during recent times as well. As can be seen, many of these papers with strong bursts are published during the 1997-2003 period. This is easy to understand that since many of these works were the initial pioneering research works in the area, they have been cited a lot by later papers. The emerging references in AfC research with influence nearby 2017 are Calvo and D'Mello, Chang and Lin, Koelstra, and Kim and Elizabeth. Table 6 shows the top 13 documents, identified through the 20 years span, their authors, sources of publication, year of publication, and burst strength.
Table 6: Top 10 references with strongest citations burst in Affective Computing.
Authors Source Year Strength Begin End 1997 - 2017
Picard Affective Computing 1997 21.680 2000 2005 ▂▃▃▃▃▃▃▂▂▂▂▂▂▂▂▂▂▂ Cowie et al. IEEE Signal Proc Mag 2001 15.039 2005 2009 ▂▂▂▂▂▂▃▃▃▃▃▂▂▂▂▂▂▂ Picard, Vyzas & Healey IEEE T Pattern Anal 2001 14.436 2003 2009 ▂▂▂▂▃▃▃▃▃▃▃▂▂▂▂▂▂▂ Calvo & D'Mello IEEE T Affect Comput 2010 10.694 2013 2017 ▂▂▂▂▂▂▂▂▂▂▂▂▂▂▃▃▃▃ Chang & Lin ACM T Intel Syst Tec 2011 8.262 2013 2017 ▂▂▂▂▂▂▂▂▂▂▂▂▂▂▃▃▃▃ Koelstra IEEE T Affect Comput 2012 8.257 2013 2017 ▂▂▂▂▂▂▂▂▂▂▂▂▂▂▃▃▃▃ Pantic & Rothkrantz P IEEE 2003 8.175 2005 2011 ▂▂▂▂▂▂▃▃▃▃▃▃▃▂▂▂▂▂ Zeng, Roisman & Huang IEEE T Pattern Anal 2009 7.701 2013 2017 ▂▂▂▂▂▂▂▂▂▂▂▂▂▂▃▃▃▃ Picard Int J Hum-Comput St 2003 7.442 2006 2008 ▂▂▂▂▂▂▂▃▃▃▂▂▂▂▂▂▂▂ Kim & André IEEE T Pattern Anal 2008 5.698 2012 2017 ▂▂▂▂▂▂▂▂▂▂▂▂▂▃▃▃▃▃ Source SCI-E and CiteSpace
11
3.6 Research Hotspots
There are 4,775 keywords identified by SCI-E in AfC research, where the top 34 keywords with at least 10 occurrences are analysed. The total number of keywords (TP), the average year of publication (APY), average number of citations (ANC), and links strength are shown in Table 7, which are displayed by APY.
Except for affective computing, which is the search word in the study, a keywords analysis revealed that the top five research hotspots of the study are: i) emotion/affect, pattern recognition and feature selection; ii) human-computer interaction (HCI), machine learning and intelligent tutoring systems; iii) sentiment analysis; iv) physiological signal processing; and v) and user interface.
Table 7: Research hotspots and trends of Affective Computing
Keywords TP APY ANC LINKS Keywords TP APY ANC LINKS
affective computing 1025 2012.1 107.268 1059 feature extraction 15 2013.0 87.333 37 emotion recognition 368 2012.0 147.771 292 classification 15 2012.8 36.667 32 facial expression
recognition 102 2013.5 5.907 57 skin conductance 15 2010.7 272.667 48 human-computer interaction 90 2012.4 22.500 131 emotion classification 14 2013.8 23.000 21 machine learning 54 2013.4 45.926 120 physiological computing 14 2013.3 202.143 26 sentiment analysis 38 2014.5 38.684 63 pervasive computing 14 2010.1 152.143 16 affect 38 2010.1 412.368 58 affect recognition 14 2009.7 257.143 31 intelligent tutoring systems 27 2013.6 74.074 44 speech 13 2012.8 200.769 40 pattern recognition 25 2009.5 8.720 58 data mining 13 2011.8 88.462 26 social signal processing 21 2013.4 108.095 25 cognition 13 2009.6 55.385 22 physiological signals 20 2014.4 20.400 48 user experience 12 2014.9 5.000 22 feature selection 20 2012.1 41.300 39 music 12 2013.8 69.167 33 human-robot interaction 20 2010.5 5.400 24 affective states 11 2012.3 359.091 17 artificial intelligence 19 2012.3 54.737 29 wearable computing 11 2011.8 56.364 8 ubiquitous computing 18 2011.9 8.500 16 facial expression analysis 11 2009.9 29.091 14 hci 17 2012.2 23.529 25 multimodal fusion 10 2014.1 13.300 23 sentic computing 16 2012.8 209.375 17
speech emotion
recognition 10 2013.9 14.100 11 support vector machine 16 2012.4 4.250 21
Source form SCI-E and Vosviewer
The visualization in a foam tree, through Carrot, offers an innovative non-rectangular tree map, where the size of each one represents the frequency of the topic (Fig. 5). Although there are some discrepancies between the frequencies obtained with VOSviewer and Carrot, the similarity between top keywords makes it a useful point of reference about the main trends (Chen et al., 2014) on AfC research. The discrepancy is explained by the difference in sources working on SCI-E and PubMed.
It can be seen that the core issue is emotions, including the dimensions of detection, expressions, feelings, moods, sentiments, technology, interactions, devices, machines. The pioneering paper in AfC of Rosaline Picard, the relevance of IEEE journals, Human-Computer Interaction (HCI), Affect Sensing, and Sentiment analysis (e.g.Youtub) are considered relevant areas of research in AfC.
12
Fig.5 Major topics in Affective Computing.
Results from PubMed extracted by Carrot
3.6.1 Emotion recognition. Emotions are central to several human processes, may enhance system effectiveness
(Picard, 2003), and are identified in our bibliometric analysis as the central core of research in AfC. Emotion recognition depends on the way emotions are measured. Research in psychology consider three major approaches to affect modelling: categorical, dimensional and appraisal-based (Grandjean, Sander, & Scherer, 2008). The most commonly adopted in research on automatic measurement of human affect, is the categorical which considers the existence of a small number of basic emotions, hard-wired in our brain and recognised universally (Ekman & Friesen, 1975). However, this approach has been criticised by several researchers who consider that in everyday interactions people exhibit rather complex affective states, like embarrassment, thinking, depression, which can be expressed via several of anatomically possible facial and bodily expressions, audio or physiological signals (e.g. Russell, 1980). Hence, other researchers advocate the use of dimensional description of human affect, where affective states are not independent from one another; rather, they are related in a systematic manner (e.g., Grandjean, Sander, & Scherer, 2008). The more known applications in this approach are the Circumplex of Affect (Schweitzer & Garcia, 2010), and the 3D emotional space of pleasure/ displeasure, arousal/ nonarousal and dominance/submissiveness (Mehrabian, 1996), at times referred to as the PAD emotion space (Jia et al.,2010). The 3D dimension has been improved with the inclusion of expectation, defined as the degree of anticipating or being taken unaware (Fontaine et al., 2007), or by the inclusion of intensity, defined as how far a person is away from a state of pure, cool rationality (e.g., McKeown et al., 2010). Finally, the appraisal-based approach emotions are generated through continuous, recursive subjective evaluation of both our own internal state and the state of the outside world (relevant concerns/needs) (e.g. Fridja, 1986). The initial applications in this 3D approach was the componential models of emotion (Scherer et al., 2001), but did not have much success because it requires complex, multicomponent and sophisticated measurements of change. A standard cognitive appraisal model for emotions, known as OCC (Ortony, Clore, & Collins, 1988), and is the most used in affect synthesis in embodied conversational agent design (Bartneck, 2002). All these approaches explain the relevance and complexity of emotion recognition to be manage by humans and computers alike.
13 3.6.2. Human-computer interaction (HCI), machine learning and intelligent tutoring systems. This hotspot can be explained in human-centred computing, and AfC. Human-centred computing is a research field which aims at bridging the existing gaps between human science and computer science (Sebe, 2010), and is a reimagining of HCI in which some researchers consider that understanding people with their concerns and activities should be the first consideration in technology design (Bannon, 2011). Moreover, AfC is the research area that focuses on computing’s relationship to emotions- how it influences them and is influenced by them (Picard, 1997). The interaction must become two-sided which can be accomplished if computers learn the emotions of its user, since humans have emotional experiences when interacting with their computers (Polzin & Waibel, 2000).
3.6.3. Sentiment analysis. Also known as opinion mining, is a computational method to extract emotional content of a written text and to classify this content according to a set of possible dimensions. It is gaining a lot of attention from industry and academia alike, due to the phenomena of Web 2.0, which led to an unprecedented increase in the amount of on-line content generated by regular users, rather than web-site owners or publishers (Thelwall, Wilkinson, & Uppal, 2010). The information contained in user-generated content could be of pivotal importance to firms and institutions, which need to identify whether a text is objective or subjective (ie, containing facts or opinions/emotions), and to determine its subjective polarity, identifying how positive/negative it is.
3.6.4 Physiological signal. Emotion recognition can be summarized into non-physiological and physiological
signals. Non-physiological signals, includes text, facial expression, speech and gesture (Calvo & D’Mello, 2010). Physiological signals includes pupillary diameter, electroencephalography, electromyogram, and
electrocardiogram, and are considered more effective and reliable, inspite of needing more expensive techniques (Soleymani, Pantic, & Pun 2012). The accuracy of human emotion recognition as been improved by utilizing advanced analysis methods and techniques including voice recognition (e.g.Wang, Chien & Moutinho, 2015), natural language processing, image processing and electroencephalography devices (Cambria, 2016).
3.6.5 User interface. A user interface is the representation of a system with which a user can interact (Jacko,
2012). As examples, we have natural user interface, which allows the user to interact using body language and gestures (Wigdor & Wixon, 2011); ubiquitous computing which is technology that “disappears” with the goal of designing computers that fit the human environment (Weiser, 1995), having high embeddedness and mobility, while pervasive computing has low mobility (Lyytinen & Yoo, 2002). Ubiquitous and pervasive technologies may be represented by different types of interfaces, like tangible user interfaces, which allow users to manipulate digital information and physically interact with it (Ishii, 2008).
3.7 Research Trends
To track the advancement of the collective knowledge of AfC, burst keywords are used as indicators of emerging trends with statistically significant fluctuations on the citation count, during a short period of time (Table 8). Prior to 2006, some topics with high frequency of burst were performance, avatar, pattern recognition, artificial psychology, and Human-Computer Interaction (HCI). Topics between 2007-2011 were biosignal, pervasive computing, affect, sentic computing and social signal processing. The trend in AfC research after 2011 until nowadays include music, facial expression recognition, support vector machine, meta-analysis, recognition, sentiment analysis, multimodal, context analysis, and brain computer interface.
14 The majority of models use standardized descriptions of emotions to be used in any context, where the most common standard approach is Russell’s circumplex model of affect (Russell, 1980), possibly because it defines a large set of adjectives to categorize emotions, which allows flexibility and covering a large range of emotions. There are several factors that may affect the self-report of emotions using technology: the interface
characteristics, as shape, design and interaction style may impact motor and cognitive processes (Lottridge & Chignell, 2009b); the users’ own cognitive abilities and digital skills; the interest, enjoyment, and motivation to use an interface; and the user’s context when is doing the experiment.
Table 8: Top keywords with strongest citation burst
Keywords Strength Begin End 1997 - 2017 Performance 63.594 2004 2009 ▂▂▂▂▂▂▂▃▃▃▃▃▃▂▂▂▂▂▂▂▂▂ Avatar 35.535 2005 2009 ▂▂▂▂▂▂▂▂▃▃▃▃▃▂▂▂▂▂▂▂▂▂ Pattern Recognition 37.760 2006 2011 ▂▂▂▂▂▂▂▂▂▃▃▃▃▃▃▂▂▂▂▂▂▂ Artificial Psychology 42.066 2006 2009 ▂▂▂▂▂▂▂▂▂▃▃▃▃▂▂▂▂▂▂▂▂▂ Human-Computer Interaction 42.606 2006 2008 ▂▂▂▂▂▂▂▂▂▃▃▃▂▂▂▂▂▂▂▂▂▂ Biosignal 33.218 2008 2010 ▂▂▂▂▂▂▂▂▂▂▂▃▃▃▂▂▂▂▂▂▂▂ Pervasive Computing 33.218 2008 2010 ▂▂▂▂▂▂▂▂▂▂▂▃▃▃▂▂▂▂▂▂▂▂ Affect 43.816 2009 2011 ▂▂▂▂▂▂▂▂▂▂▂▂▃▃▃▂▂▂▂▂▂▂ Psychophysiology 43.283 2011 2012 ▂▂▂▂▂▂▂▂▂▂▂▂▂▂▃▃▂▂▂▂▂▂ Sentic Computing 39.996 2011 2012 ▂▂▂▂▂▂▂▂▂▂▂▂▂▂▃▃▂▂▂▂▂▂ Social Signal Processing 33.884 2011 2012 ▂▂▂▂▂▂▂▂▂▂▂▂▂▂▃▃▂▂▂▂▂▂ Music 55.392 2012 2015 ▂▂▂▂▂▂▂▂▂▂▂▂▂▂▂▃▃▃▃▂▂▂ Facial Expression Recognition 51.967 2013 2017 ▂▂▂▂▂▂▂▂▂▂▂▂▂▂▂▂▃▃▃▃▃▃ Support Vector Machine 61.097 2013 2015 ▂▂▂▂▂▂▂▂▂▂▂▂▂▂▂▂▃▃▃▂▂▂ Metaanalysis 73.601 2013 2014 ▂▂▂▂▂▂▂▂▂▂▂▂▂▂▂▂▃▃▂▂▂▂ Recognition 45.218 2013 2014 ▂▂▂▂▂▂▂▂▂▂▂▂▂▂▂▂▃▃▂▂▂▂ Sentiment Analysis 90.086 2014 2017 ▂▂▂▂▂▂▂▂▂▂▂▂▂▂▂▂▂▃▃▃▃▃ Physiological Signal 61.356 2014 2017 ▂▂▂▂▂▂▂▂▂▂▂▂▂▂▂▂▂▃▃▃▃▃ Machine Learning 64.062 2014 2016 ▂▂▂▂▂▂▂▂▂▂▂▂▂▂▂▂▂▃▃▃▂▂ Multimodal 71.363 2015 2017 ▂▂▂▂▂▂▂▂▂▂▂▂▂▂▂▂▂▂▃▃▃▃ Context Analysis 57.957 2015 2017 ▂▂▂▂▂▂▂▂▂▂▂▂▂▂▂▂▂▂▃▃▃▃ Brain Computer Interface 44.032 2015 2017 ▂▂▂▂▂▂▂▂▂▂▂▂▂▂▂▂▂▂▃▃▃▃
Source CSI-E and CiteSpace
4. Conclusions
This study has performed a comprehensive bibliometric analysis of research outputs in AfC published in SCI-E journals since 1997 until November 2017. The research publication dataset has been computationally analyzed to map the AfC research landscape during last 20 years. The bibliometric analysis helped in identify year-wise number and rate of growth of publications, types of authorship of papers on AfC, collaboration patterns in publications on AfC, most productive countries, institutions, journals, authors, citation patterns, research hotspots, burst keywords, and trends in publications during the period. The analysis has successfully provided an analytical account of progress of AfC from 1997 to state of art today, and a map of major areas of research and keywords.
15 This computational analysis provided the answer to various research questions stated in Section 1. First of all, year-wise growth pattern indicates that there is a significant rate of growth in research output on AfC, with the number of publications is doubling in 5.9 years time. The country-wise distribution of AfC research shows that AfC research is now geographical widespread, though USA and Spain still produce most of the research papers. In terms of international collaborative papers USA, England, Netherlands and Germany stand at the top, as well as the strongest collaboration link during the period. This study also identifies that the most productive
institutions on AfC are MIT and Univ Twente, having the highest TP and TC, and Uni Wisconsin with the highest ACPP. The collaboration between authors indicates a greater globalization, with complex and articulated research networks where the distance has some interesting explanation but the main factor seems to be a positive correlation with the income of the countries. These networks could also be explained by the increased number of communication technologies, which allows more international collaboration and more share of ideas and workloads. The authors also observe that the top publications sources are IEEE Transactions on Affective Computing, with the highest TP; IEEE Transactions on Multimedia with the highest impact factor, and International Journal of Human-Computer Studies with the highest ACPP value for research publications. The analysis identifies Schuller B and Pantic M as the most productive authors, and Pantic M, Picard RW and Huang TS as the most cited authors. On authorship pattern, all highly productive authors have multi-author publications. The analysis further identifies that AfC publications are in a wide variety of hotspot areas. The analysis of keywords publications, citations, average year of publications and links strength, identifies as hotspots emotion recognition, human-computer centred, sentiment analysis, physiological signal processing, and user interface, which are further elaborates by burst detection algorithm. Burst detection shows that the focus of AfC research before 2006 was related to performance, pattern recognition and HCI. Between 2007 and 2011 the focus was directed at signal processing and affect detection. After 2011 was born a different focus directed to new applications, a research interest in sentiment analysis and meta-analysis, and the use of multimodal signals. Besides, the development of multimodal systems that includ the context appeared to be considered a necessary technological development to obtain a more precise and real recognition of emotions. The computationsl results present a first of its kind analytical view of the AfC research area. Researhers from the scientific community, marketing, and business world can benefit from these results. SCI-E analysis helped to understand that more AfC research output is based on the use of computer science, and the document type are mainly proceedings papers and articles. Overall, this paper presents a detailed analytical account of AfC research from 1997 until Novembre 2017 by computational analysis of research publication data in AfC. The paper helps in understanding the broad landscape of AfC research and presents results useful for researchers in the area. Bibliometric analysis has helped to characterize qualitatively and quantitatively the AfC research in terms of its development, hotspots, and trends of the investigation, supplying the researchers and marketers with new tools in this domain.
Our research spans 20 years of scientific literature. In order to create a representative corpus of documents for investigation, we set up the following profile in WoS: topic: “affective computing”, indexed SCI-Expanded; timespan 1997-Nov 2017. This profile, although not exhaustive, produces a comprehensive number of
documents to have been analysed. If we had analysed the JIF based not only on the results obtained in 2016, as we did, but based on previous years, we could have followed tendencies in the change of impact of AfC journals over time. The data chosen is WoS which has the oldest and most comprehensive records of citation indexes,
16 assumed to have a sufficient amount of high quality literature. Nevertheless, it doesn’t necessarily index the totality of journals and then not all research of interest can be examined using this data (Li et al., 2010).
References
Ambady, N., & Rosenthal, R. (1992). Thin slices of expressive behavior as predictors of interpersonal consequences: A meta-analysis.
Bannon L (2011). Reimagining HCI: toward a more human-centered perspective. Interactions 18:50–57. doi:10.1145/1978822.1978833
Barth, M., Haustein, S. & Scheidt, B. (2014). The life science in German-Chinese cooperation: an institutional-level co-publication analysis. Scientometrics, 98(1), 99-117, doi: 10.1007/s11192-013-1147-9.
Bartneck, C. (2002). Integrating the OCC model of emotions in embodied characters. Proceedings of the Workshop on Virtual Conversational Characters, 39–48.
Calvo, R.A., & D’Mello (2010). Affect Detection: An Interdisciplinary Review of Models, Methods, and Their Applications, IEEE Transactıons on Affectıve Computing, 1(1), 18-37.
Cambria, E. (2016). Affective Computing and Sentiment Analysis. IEEE Intelligent Systems, 1541-1672. Chang, C.C., & Lin, C.J. (2011), LIBSVM: A Library for Support Vector Machines. ACM Transactions on
Intelligent Systems and Technology, 2(3) Article 27, http://www.csie.ntu.edu.tw/∼cjlin/libsvm.
Chuang, K. Y., Wang, M. H., & Ho, Y. S. (2013). High-impact papers published in journals listed in the field of chemical engineering. Malaysian Journal of Library and Information Science, 18(2), 47–63.
Cowie, R., Douglas-Cowie, E., Tsapatsoulis, Votsis, G., Kollias, S., Fellenz,W. & Taylor, J.G. (2001) Emotion Recognition in Human-Computer Interaction, IEEE Signal Processing Magazine, (18), 32-80.
Desmet P (2005), “Measuring emotion: development and application of an instrument to measure emotional responses to products”, In: Blythe M, Overbeeke K, Monk A, Wright P (eds) Funology. Springer, The Netherlands, pp. 111–123.
Ekman, P. & W.V. Friesen, W.V., (1975). Unmasking the face: a guide to recognizing emotions from facial clues. Prentice Hall, New Jersey.
Ellegaard, O. & Wallin, J.A., (2015). The bibliometric analysis pf scholarly production: How great is the impact? Scientometrics, 105(3), 1809-1831.
Fogg BJ (1998), “Persuasive computers: perspectives and research directions”, In: Proceedings of the SIGCHI conference on human factors in computing systems, pp. 225–232.
Fontaine, J.R., et al. (2007). The world of emotion is not two-dimensional. Psychological Science, 18, 1050– 1057.
Frijda, N.H., (1986), “The emotions”, Cambridge: Cambridge University Press.
Fu, H. Z., Wang, M. H., & Ho, Y. S. (2012). The most frequently cited adsorption research articles in the Science Citation Index (Expanded). Journal of Colloid and Interface Science, 379(1), 148–156.
Grandjean, D., Sander, D. & Scherer, K. R (2008). Conscious emotional experience emerges as a function of multilevel, appraisal-driven response synchronization. Consciousness & Cognition, 17 (2), 484 – 495, 2008. Holbrook, M.B., (1986), “Emotion in the consumption experience: toward a new model of the human
consumer”, In: R.A. Peterson, W.D. Hoyer and W.R. Wilson, eds. The role of affect in consumer behavior:
17 Jacko JA (2012). Human computer interaction handbook: fundamentals, evolving technologies, and emerging
applications. CRC Press, Boca Raton.
Jia, J. et al. (2010). Emotional audio-visual speech synthesis based on pad. IEEE Trans. on Audio, Speech, & Language Processing, PP (9), 1–1.
Kappor, A., Burleson, W.& Picard,R.W.(2007), “Automatic prediction of frustration”, International Journal of Human-Computer Studies, Vol. 65, No. 8, pp.724-736.
Kim, J., & André, E. (2008), Emotion Recognition Based on Physiological Changes in Music Listening, IEEE Trans. Pattern Analysis and Machine Intelligence, 30(12), 2067-2083.
Koelstra, S., Muhl, C., Soleymani, M., Lee, J. S., Yazdani, A., Ebrahimi, T., & Patras, I. (2012), Deap: A database for emotion analysis; using physiological signals, IEEE Transactions on Affective Computing, 3(1), 18-31.
Lang, P. J. (2014). Emotion and motivation: Toward consensus definitions and a common research purpose.Emotion Review. 6 (2), 93–99. Doi: 10.1177/1754073913512004.
Lemos, J, Sadeghnia, G.R., Ólafsdóttir, I., & Jensen, O. (2008). Measuring emotions using eye tracking. Proceedings of Measuring Behavior. Maastricht, The Netherlands, August 26-29.
Li, J., Burnham, J.F., Lemley, T., & Britton, R.M (2010). Citation analysis; Comparison of Web of Science, Scopus, SciFinder, and Google Scholar. Journal of electronic resources in medical libraries, 7 (3), 196-217, doi: 10.1080/15424065.2010.505518.
Li, L. L., Ding, G. H., Feng, N., Wang, M. H., & Ho, Y. S. (2009). Global stem cell research trend: Bibliometric analysis as a tool for mapping of trends from 1991 to 2006. Scientometrics, 80(1), 39–58.
doi:10.1007/s11192-008-1939-5.
Lopatovska I, Arapakis I (2011), “Theories, methods and current research on emotions in library and information science, information retrieval and human-computer interaction”, Inf Process Manag, Vol. 47, 575–592. Lottridge D, Chignell M (2009a) Emotional majority agreement a psychometric property of affective self-report
instruments. In:Science and technology for humanity (TIC-STH), 2009 IEEE Toronto international conference, 795–800.
Lyytinen, K., & Yoo, Y. (2002). Ubiquitous computing. Commun ACM, 45:63–96.
Mahapatra, M. (1985). On the validity of the theory of exponential growth of scientific literature. In Proceedings
of the 15th IASLIC conference, December, 61–70.
Mao, N., Wang, M. H., & Ho, Y. S. (2010). A bibliometric study of the trend in articles related to risk assessment published in science citation index. Human and Ecological Risk Assessment, 16(4), 801–824. doi:10.1080/10807039.2010.501248.
Mehrabian, A. (1996). Pleasure-arousal-dominance: A general framework for describing and measuring individual differences in temperament. Current Psychology: Developmental, Learning, Personality, Social, 14, 261–292.
Ortony, A., Clore, G.L., & Collins, A. (1988). The cognitive structure of emotions, Cambridge Univ. Press, Oxford.
Pantic, M., & Rothkrantz, L.J.M., (2003). Towards Emotion Recognition in Human Computer Interaction, Proceedings of the IEEE, 91(9), 1370-1390.
18 Picard, R.W., Vyzas, E., & Healey, J. (2001). Toward Machine Emotional İntelligence: Analysis of Affective
Physiological State, IEEE Transactıons on Pattern Analysıs And Machine Intelligence, 23(10),1175-1191. Picard, R. W. (2003). Affective computing: challenges, International Journal of Human-Computer Studies,
59(1), 55-64.
Piryani, R., Mashavi, D. & Singh, V.K. (2017). Analytical mapping of opinion mining and sentiment analysis research during 2000-2015. Information Processing and Management 53, 122-150.
Polzin TS, Waibel A (2000) Emotion-sensitive human–computer interfaces. In: ISCA tutorial and research workshop (ITRW) on speech and emotion.
Russell, J.A. (1980). A circumplex model of affect. J. of Personality & Social Psychology, 39, 1161–1178. Rukavina, S.; Sascha, G., Holder, H., Jun-Weng, T., Walter,S., & Traue, H. (2016). Affective Computing and the
Impact of Gender and Age. PLOS ONE | DOI:10.1371/journal.pone.0150584
Sakai, S., Yoshida, H., Hirai, Y., Asari, M., Takigami, H., Takahashi, S., et al. (2011). International comparative study of 3R and waste management policy developments. Journal of Material Cycles and Waste
Management, 13(2), 86–102. doi:10.1007/s10163-011-0009-x.
Scherer, K.R., Schorr, A., & Johnstone, T., (2001). Appraisal Processes in Emotion: Theory, Methods, Research, Oxford Univ. Press, Oxford/New York, 2001.
Schuller, B., Batliner, A., Steidl, S., & Seppi, D. (2001). Recognising realistic emotions and affect in speech: State of the art and lessons learnt from the first challenge, Speech Communication, 53(9), 1062-1087. Schuller, B; Valstar, M; Cowie, R; & Pantic, M (2012). Avec 2012-The Continuous Audio/Visual Emotion
Challenge - An İntroduction. İCMİ '12: Proceedings of the Acm İnternational Conference on Multimodal. Schweitzer, F., & Garcia, D. (2010). An agent-based model of collective emotions in online communities. The
European Physical Journal B: Condensed Matter and Complex Systems, 77(4), 533-545.
Sebe, N. (2010). Human-centered computing. In: Nakashima H, Aghajan H, Augusto JC (eds) Handbook of ambient intelligence and smart environments. Springer US, Boston, 349–370.
Soleymani, M., Pantic, M., & Pun, T. (2012). Multimodal emotion recognition in response to videos. IEEE Transactions on Affective Computing, 3 (2), 211–223.
Thelwall, M., Wilkinson, D., & S. Uppal, S. (2010). Data mining in social network communication: gender differences in MySpace. Journal of the American Society of Information Science and technology, 61 (1), 190-199.
Torning K, Oinas-Kukkonen H (2009), “Persuasive system design: state of the art and future directions”, In: Proceedings of the 4th international conference on persuasive technology. ACM, New York, pp. 30:1–30:8
Valstar, M; Gratch, J; Schuller, B; Ringeval, F; Cowie, R; & Pantic, M (2016). Summary for AVEC 2016-Depression, Mood, And Emotion Recognition Workshop And Challenge. MM'16: Proceedings of the 2016 ACM Multimedia Conference. Doi: 10.1145/2988257.2988258.
Wang, W.C., Chien, C.S. & Moutinho, L. (2015), “Do you Really Feel Happy? Some İmplications of Voice Emotion Response in Mandarin Chinese”, Marketing Letters, 26(3), 391-409.
Wang, F., Qiu, J., & Yu, H. (2012). Research on the cross-citation relationship of core authors in scientometrics.
19 Wang, L. H., Wang, Q. H., Zhang, X., Cai, W. W., & Sun, X. H. (2013). A bibliometric analysis of anaerobic
digestion for methane research during the period 1994–2011. Journal of Material Cycles and Waste Management, 15(1), 1–8. doi:10.1007/s10163-012-0094-5.
Weiser, M. (1995). The computer for the 21st century: specialized elements of hardware and software, connected by wires, radio waves and infrared, will be so ubiquitous that no one will notice their presence. In: Baecker RM, Grudin J, Buxton WAS, Greenberg S (eds) Readings in human-computer interaction, 2nd edn. Morgan Kaufmann Publishers Inc., San Francisco, 933–940.
Wen, H., & Huang, Y. (2012). Trends and performance of oxidative stress research from 1991 to 2010. Scientometrics, 91(1), 51–63. doi:10.1007/s11192-011-0535-2.
Wigdor D., & Wixon, D. (2011). Brave NUI world: designing natural user interfaces for touch and gesture. Morgan Kaufmann, San Francisco.
Wurm, L. H., Vakoch, D. A., Strasser, M. R., Calin-Jageman, R., & Ross, S. E. (2001). Speech perception and vocal expression of emotion. Cognition & Emotion, 15(6), 831-852.
Zeng, Z.H., Riisman, G.I; & Huang, T.S., (2009), A Survey of Affect Recognition Methods: Audio, Visual, and Spontaneous Expressions, IEEE T Pattern Anal. 31 (1),39-58.
Zheng, W.L., Dong, B.N, & Lu, B.L. (2014). Multimodal Emotion Recognition using EEG and Eye Tracking Data. Conf Proc IEEE Eng Med Biol Soc:5040-3. doi: 10.1109/EMBC.2014.6944757.
Zhou, X., & Zhao, G. (2015). Global liposome research in the period of 1995-2014: a bibliometric analysis. Scientometrics, 105:231-248, doi: 10.1007/s11192-015-1659-6.