EXPANDING MARKET STRATEGIES FOR LOGON
Pia-Maria Hauschild
Project submitted as partial requirement for the conferral of Master in International Management
Supervisor:
Prof. Dr. Jürgen Janovsky, Hochschule Pforzheim, Department Chair Marketing
- Spine -
EX
PA
N
D
IN
G
M
A
R
K
ET
ST
R
A
T
E
G
IE
S
FO
R
L
O
G
O
N
Pi
a-M
ar
ia
Ha
us
ch
ild
Acknowledgements
I want to thank Prof. Dr. Jürgen Janovsky, my supervisor, mentor and creator of my topic. He enabled the connection to the German consulting company LogOn. I want to thank its director Mr. Peter Kolb for the extraordinary cooperation, active support and over all the opportunity to dedicate my master thesis to LogOn. I do express my gratitude to both, who guided, helped and taught me along the creation of this thesis. I hope that its results will support LogOn´s goal attainment.
Table of Contents
1. Executive Summary ... 7
2. Exposition of the Context of the Issue ... 10
2.1. LogOn ... 11
2.2. LogOn´s Business Model ... 11
3. Literature Reviews ... 12 3.1. Innovation Management ... 12 3.1.1. Service Innovation ... 14 3.1.2. Adoption Models ... 15 3.1.3. Diffusion Theory ... 15 3.1.4. Technological Assessment ... 16 3.1.5. Criticism ... 17 3.2. Digital Advertising ... 17 3.2.1. User Satisfaction ... 18 3.2.2. Advertising Avoidance ... 19
3.3. Online Market Entry Strategy ... 20
3.3.1. Industry Analysis ... 20 4. Conceptual Framework ... 22 5. Methodology ... 25 5.1. Research Design ... 26 5.2. Research Analysis ... 28 6. Analysis ... 28 6.1. Idea Generation ... 29 6.2. Idea Assessment ... 32 6.2.1. Survey Analysis ... 33 6.2.2. Industry Analysis ... 47 6.2.3. Summary ... 51 6.3. Business Models ... 52
6.3.1. Software Licensing Models ... 52
6.3.2. Online Market Entry Strategy ... 54
6.3.3. Digital Marketing ... 55
6.3.5. Business Model 2: Paid App ... 65
6.3.6. Business Model 3: Pre-installed App ... 66
6.3.7. Business Model 4: SaaS with Subscription ... 68
6.3.8. Business Model 5: SaaS with Pay-per-use ... 71
6.3.9. Business Model 6: SaaS with Package Deals ... 72
6.3.10. Business Model 7: Permanent Licensing ... 72
7. Conclusions ... 73
8. Bibliography ... 77
9. Appendices ... 83
9.1. Questionnaire in English ... 83
Table of Figures
Figure 1: Phases of dissemination and innovation (Janovsky 1012: 8) ... 13
Figure 2: Conceptual Framework ... 24
Figure 3: Dimensions and categories representing the questions of the questionnaire ... 26
Figure 4: Internet users in Germany (Frees and Koch, 2015: 367; Tippelt and Kupferschmitt, 2015: 442, 444) ... 27
Figure 5: Triangle relationship of target group ... 32
Figure 6: Gender frequencies (SPSS) ... 33
Figure 7: Age frequencies ... 34
Figure 8: Residence frequencies (SPSS) ... 35
Figure 9: Education frequencies (SPSS) ... 36
Figure 10: Occupation frequencies (SPSS) ... 36
Figure 11: Age distribution (SPSS) ... 40
Figure 12: Means of question 2 (numbers are rounded) ... 41
Figure 13: Question 4 (SPSS) ... 42 Figure 14: Question 5 (SPSS) ... 43 Figure 15: Question 6 (SPSS) ... 44 Figure 16: Question 7 (SPSS) ... 45 Figure 17: Question 8 (SPSS) ... 46 Figure 18: Question 9 (SPSS) ... 47
Figure 19: Interconnection between target groups in case of a free app ... 62
Figure 20: Interconnection between target groups in case of a paid app ... 65
Figure 21: Interconnection between target groups in case of a pre-installed app ... 66
Figure 22: Interconnection between target groups in case of SaaS with subscription .... 69
1. Executive Summary
This company project provides an analysis and evaluation of market expansion possibilities of the German company LogOn. The company offers an innovative and intuitive online matching technology originally designed for online recruiting in the field of human resources. Innovation plays an increasingly important role to be competitive in times of globalization, both in small businesses and general economic growth. Current success with the matching technology raises expansion plans into the area digital advertisement, focusing on an increasingly dramatic situation: on one hand digital advertising spend is constantly growing in Western Europe. On the other hand
dissatisfaction with digital advertisement, by reason of low quality and clutter is simultaneously increasing. As a matter of fact advertising is getting less effective. Linking the current situation of digital advertising with the concept of Innovation Management, a new challenge and market expansion into digital advertisement appears possible: can LogOn’s online matching technology expands into the field of digital and media advertising in order to create added value? Following the framework of Innovation Process, the idea generation process delivers a concrete product idea. The matching technology is able to intuitively create a profile of a user. It looks at the motivation of information, estimates possible consequences and generates additional information intuitively. The matching technology serves as an intelligent spam filter, which is able to exclude irrelevant content from a user’s mobile or desktop device. The technology offers a better customer experience and increases customer satisfaction. This benefit can be used in the B2C and B2B sector by offering users a more enjoyable advertisement experience and adding value by making advertisement more effective and successful in general. LogOn´s matching technology has three target groups: users, publisher and vendors. Users download the technology on their devices to receive less spam and a personalized offer of advertisement. By installing the technology on their online space, publishers are able to offer a better user experience, increase traffic and sell advertising spots at a higher cost. Vendors buy advertisement space on publisher’s websites. The idea assessment is made with an analysis of the company presentation, literature review, industry outlook and quantitative online survey. The online survey measures users evaluation of digital and media advertisement and demand for personalized advertisement. It consists of 280 interviews of German users of social networks between 15 and 70 years old. The results show that people want to see
quality, the relevance to personal interests, possibility to control and situation adequateness. In order to make advertisements successful, advertisers should deliver the right message suiting these standards, at the right time, to the right person. This is where the matching technology finds its use and application. Even though the industry analysis reveals strong positions of well-established technologies and companies, the novelty and innovativeness of LogOn´s technology relativizes the threat of entry. Rivalry among existing competitors exists, but can be bypassed to a certain extend by differentiation. As a conclusion, analysis reveals positive demand, trend and industry circumstances for LogOn´s market entry.
The positive answer leads to the second research question: how can the market of digital advertisement be reached and developed? This question enables a closer look into the micro perspective of the final product and alternative ways to successfully launch it. Therefore a variety of business models will be presented followed by a suggestion of online market entry and marketing strategies. In regard to the product and target groups seven most suitable business models with different delivery models (app and software as a service) were created: Free app, paid app, pre-installed app, SaaS with subscription, SaaS with pay-per-use, SaaS with package deals and permanent licensing. In combination with all information generated an evaluation of the business models can be made. The decision between app and SaaS is not mutually exclusive. Both delivery options can be implemented simultaneously as two different products. While the app targets the end user (B2C), SaaS works for companies (B2B). The idea assessment including reveals a high market potential for both products. As a result, LogOn should consider the implementation of an app as conceptualized in the free app. The pre-installed app remains an idea of high potential even though its realisation depends on LogOn´s future performance. LogOn should additionally consider the implementation of SaaS on subscription basis. Timely restricted subscriptions, pay-per-use and package deals are only three different delivery options of the same product. They also do not exclude each other. In the end it is the working methodology of the target group deciding which option is the most efficient and effective one. This flexibility can be used to try all options and measuring demand to finally find out which option is the most wanted and most profitable.
When it comes to implementation, research shows the usefulness of innovation practices within the company to increase the general probability of sustainable success of an innovative product. Acknowledging the inherent change of business environment and society coupled with values of persistency and consistency within the companies’ philosophy and structure is an essential factor of success and makes it more resilient for present as well as future impacts. A strong and integrated innovation culture in the company LogOn builds the essential pillar of success for the development of a new innovative product. The surveyed demand for personalization of digital and media advertisement creates a market. The business model creation and evaluation develops a final product and marketing as well as online market entry strategies deliver the communication tools to reach customers. All in all, it is a comprehensive product launch strategy ready to get implemented to revolutionize digital and media advertising and reach a new stage of business.
2. Exposition of the Context of the Issue
The world economy finds itself currently at the edge of a new cycle of economic development, which increases the general relevance of innovation management. Higher competition causes shorter and shorter product life cycles and forces companies to reduce the time to market. Globalization increases the relevance of inter-company networks, the sensitivity of the social environment and merges different technologies. As a result, many companies operating in both sectors have to install new structures for a more systematic innovation management (Janovsky, 2012: 19).
“Innovation appears to be playing an increasingly important role in driving economic growth; those countries that have fared best in recent years tend to be those that have successfully adapted their S&T [Science and Technology] systems to evolving patters of innovation” (OECD, 2001: 116).
E-Business and Internet marketing are increasingly important fields of business. They allow digital advertisement to enter into an intimate customer area, which is even closer and more private than any other customer area. Internet marketing is able to create and dictate tastes. But as everybody can use the Internet for his own business, the perception, acceptance and usefulness of digital advertisement is at stake. Marketing strategies have to target more specifically to overcome customer’s dissatisfaction, which arises from irrelevant and high amounts of advertisement. When linking the current situation of digital advertising with the concept of Innovation Management, a new challenge and possible market niche appears in connection with the following question: Does the dissatisfaction with digital advertisement appear to be an opportunity for LogOn? The successful use of LogOn´s matching technology in the recruitment industry leads to the assumption that this technology is able to revolutionize other markets as well. The matching technology is new, innovative and unique. No other similar matching technology in the recruitment sector exists, which reinforces the revolutionizing component of LogOn´s innovation. Concluding current circumstances and trends, LogOn wants to adapt the existing matching technology to the field of digital advertising.
2.1. LogOn
Founded in 2014, the Germany based company LogOn offers a unique and intuitive online matching technology originally designed for online recruiting in the field of human resources. This technology enables job seekers and employee seeking companies fast, easy and high quality matching. Both job seekers and employee seekers can advertise on LogOn´s online platform or other job platforms to receive most suitable job or employee suggestions made by LogOn´s online matching technology.
2.2. LogOn´s Business Model
The key product of LogOn is an automatic matching and screening function called eRecruiter, which benefits job seekers, employers and job portals. Job seekers are able to upload CV´s in combination with the eRecruiter on LogOn´s or other job platforms to automatically establish a transparent candidate profile. Employers can use the technology to make the recruitment process faster and more efficient. Job portals benefit from the technology as well, since it’s supporting differentiation from industry competitors. The eRecruiter identifies and interprets data from a CV to deliver an extensive profile- and match-report as well as interview preparation. The technology is able to determine whether or not the hard and soft skills of a candidate match with the individual requirements of a company. This is possible because the logic deposited in the technical system analyses and combines data from the CV intuitively to a candidate profile, which serves as decision base and recommendation. The final decision if a candidate fits to a company is made in a personal interview.
The companies’ business model requires a close working-together with customers and partners since the latter have online offers and the reach deep into a certain relevant market. LogOn´s partners are German job portals such as stellenanzeigen.de, Monster and StepStone. LogOn implements its technology on partner websites and thereby adds value to them by increasing competitive advantage. Thus, the partner is able to sell his offer at a higher price and simultaneously increasing his market share. Customers can choose between modularly designed job advertisements and individually adaptable posting products.
Looking at financial aspects, LogOn participates on the obtained surplus turnover of its partners. Generally, the invoicing is made with a yearly flat fee for the license of the
following an invoicing-example of an online job portal will be presented. A single job advertisement on a job portal featuring the eRecruiter matching technology cost €89 more then a conventional one. On a monthly basis, an online portal visualizes 30.000 job advertisements. Thereof 20% with the eRecruiter technology, giving the job portal a surplus turnover of €534.000 per month and €6.4 million per year. LogOn is participating with 30% on the surplus turnover, accounting for €1.3 million: €600.000 as license fee and €700.000 as success dependent fee.
3. Literature Reviews
The literature review is a tool to accumulate a pool of scientific knowledge, which provides an essential foundation pillar to support the investigation.
3.1. Innovation Management
Innovation management historically bases on ideas of the Austrian economist Joseph Schumpeter who identified innovation as a significant factor in economic growth during the 1930s. The authors Crossan and Apaydin define Innovation as
“[...] production or adoption, assimilation, and exploitation of a value-added novelty in economic and social spheres; renewal and enlargement of products, services, and markets; development of new methods of production; and establishment of new management systems. It is both a process and an outcome" (Crossan and Apaydin, 2009: 1155).
Following Schumpeter, the management of innovation helps organizations to grasp an opportunity and use it to create and introduce new ideas, processes or products (Kelly and Kranzburg, 1978). Innovation gives organizations, industries and nations an advantage in the highly competitive world of business. It does not solely refer to the creation of new products. It also applies effectively on refining what already exists. Although products are mostly in the focus of innovation, markets, suppliers, production methods and processes can also be important areas to innovate. The combination of both, product and process innovation might be one of the most favourable advantages and also extremely difficult to replicate. A study conducted by Little identifies innovation as the most relevant factor determining competitiveness of a company, even
before cost cutting and international expansion (Little, 2005: 1). Innovation is important in both service and manufacturing organizations, whereas the importance of the first is, although often overlooked, of significant importance. The service sector is not just constantly growing; manufacturing organizations are increasingly including services in their offer to be more competitive.
Innovations can be classified in incremental or radical innovations, technical or socio-technical innovations and improvement or basic innovations (Janovsky, 2012: 15). Looking at the place where innovation occurs, product-, process-, marketing- and structural innovations can be distinguished (Vacek, 2009). The innovation process can be pushed or pulled through development. A pushed process bases on existing or recently invented technologies that a company wants to find profitable applications for. A pulled process wants to find innovative solutions for appearing customer needs. Both processes require a broad understanding of the market and its technical problems. Innovation research essentially tries to answer three questions: Which factors determine the reaction of the target group to a new product? Which perspectives of further diffusion processes are to expect? Which consequences can be expected (in terms of technology assessment)? The multi-dimensional innovation process begins with the recognition of a problem or idea, then to problem-solving, the creation of productive capacity and leads to the market introduction of a newly created product or service. The innovation process happens simultaneously with the dissemination process, which defines an active spread of new innovations to the target audience using planned strategies. When an innovation is accepted and individuals adopted, the outcome of the dissemination process is diffusion, a passive, untargeted and unplanned spread of new innovations. Both processes effect and revise institutional, individual and socio-economical structures.
3.1.1. Service Innovation
Following Van Ark et al., service innovation is a new or changed service concept, client interaction channel, service delivery system or technological concept that individually or in combination, leads to one or more new or renewed service functions. They are new to the company and change the offer on the market as well as require structurally new technological, human or organizational capabilities of the service organization. When talking about service innovation, the innovation does not necessarily relate to the novelty of a technology itself. It often lies in the non-technological areas instead. Technological based innovations in services, service processes and service companies can be also innovated (Van Ark et al., 2003).
Service innovation has a reversed product cycle in comparison to the classical innovation process. Instead of placing the productivity of improvements on the last stage, service innovation starts with it on first stage. Solely the outcome of the service innovation process is a new service product. The classical innovation process launches the new product on the first stage instead (Pilat, 2005: 28). The services role is to closely align manufactured products with service products „[...] to offer the consumer not the manufactured product itself but rather the goal that the purchase of the manufactured product would ultimately fulfil“ (Howells, 2005: 62). In some cases, the interactivity between company and client turns even into a coproduction. Innovation must focus on providing more for the customer and this can require revising the existing as much as developing the new (Goffin and Mitchell, 2005). As long as perceived quality of a service and customers expectations do not match, the customer will be dissatisfied. “In order to truly innovate, firms must expand their focus beyond existing services and service capabilities to address the fundamental needs of their customers, including the jobs and outcomes those customers are trying to achieve“ (Bettencourt, Brown and Sirianni, 2013: 13). According to Bettencourt et al. true service innovation lies in the shift back to the customer by asking: “How is the customer doing?” (Bettencourt, Brown and Sirianni, 2013: 13). If companies want to innovate, they must address the fundamental needs of the customer by understanding, which jobs customers try to get done. Finally, shared solutions for customers will result in a value co-creation: It is meaningful to the customer and differentiates from competitive offerings (Gummesson, 1995).
3.1.2. Adoption Models
Adoption Models are tools to understand or predict the reasons for the acceptance and use of a (new) technology at individual, organizational and society level. These models specify a number of acceptance determinants that influence the users decision on how or when to buy or use an innovation (Tatnall, 2007: 1067). Following Daecke, the adoption capacity of a company consists of four parts: the acquisition of external knowledge, the internal information processing, the combination with already existing knowledge (transformation) and the use of it through innovations (exploitation) (Daecke, 2009: 26). To analyse adoption, a range of adoption models was created. Although approaches are different they are based on common, interwoven adoption elements: Adoption subjects, objects and context. Adoption models are created on the assumption that individual adoption mostly does not happen voluntarily, instead through rules and norms of employers, institutions and society. In extreme cases adoption can be forced. Many models confront the user with high requirements towards operationalization of highlighted areas. Others are precise enough for direct application. The models of Kollmann (1998) as well as Wehrmann and Amberg (Amberg, 2003) can be shown as contrasting examples for both extremes: Kollmann´s Dynamic Adoption Model divides adoption attitude, adoption activity and adoption application to receive a rather general result for overall adoption. In contrast, the Dynamic Acceptance Model for Reevaluating Technologies (DART) analyses individual user acceptance, such as perceived benefit, costs, network effects and usability to derive improving actions. Several other models can be situated in between both extremes: Davis’s (1986) Technology Acceptance Model, Degenhart (1986), Goodhue´s (1995) Task Fit Model, Herrmann´s (1999) Process Model, Silberer´s (2002) Customer Satisfaction Model and Lin´s (2003) ICTAM model. However, space restrictions do not allow in depth presentations of the models at this point.
3.1.3. Diffusion Theory
While adoption refers to the customers’ decision to accept, buy or use an innovation, diffusion explains the extent and time frame of innovations dissemination on the market. The idea of Rogers Diffusion of Innovations Theory suggests that change can be promoted rather easily in a social system through a domino effect: “Diffusion is the process by which an innovation is communicated through certain channels over time
among the members of a social system” (Rogers, 2003: 5). It explains more precisely how, why and at what rate new ideas and technology spread through cultures. He states that diffusion of innovation contains four main elements: the type of innovation, communication channels, nature of the social system, time and extend of the change agents promotion effort (Rogers, 2003: 222ff).
The way members of a social system perceive characteristics of an innovation (e.g. advantage, complexity, observability), determines its rate of adoption or rejection (Rogers, 2003: 16). The rate of adoption is defined as the relative speed at which members of a social system adopt to an innovation (Rogers, 2003: 221). The greater the characteristics perceived, the faster an innovation gets adopted. The novelty of an idea brings a high degree of uncertainty, what is a lack of predictability, structure and information. An individual only adapts to an innovation if it offers some relative advantage to the idea it supersedes. In that sense, each member of a social system faces its own innovation decision-making process that follows a 5-step diffusion process: knowledge, persuasion, decision, implementation, and confirmation. Each individual’s innovation-decision is framed by personal characteristics. This diversity is what makes diffusion possible (Orr, 2003). Rogers illustrates the successful adoption process with a bell-shaped diffusion curve, representing categories of individuals who adopt innovations with different speeds: innovators, early adopters, early majority, late majority and laggards (Rogers, 2003: 37). The curve shows a stepwise social process where innovation-decisions depend highly on decisions of other members. The tipping point is marked by opinion leaders (early adopters) adoption whereon the majority responds by following rapidly. To self-sustain an innovation it must be widely adopted until it reaches critical mass. Innovation adoption can be seen rather as a consequence of structural conditions (leading to social change) than as a result of the application of a particular technique applied during the innovation process.
3.1.4. Technological Assessment
An assessment of technology should be executed to forecast (potential) consequences of new technologies in respect to the company and its environment. Technology assessment runs through the following steps: analysis, forecast, identification of potentials, assessment of consequences and finally the product configuration (Bonnet, 1994: 38). Fulfilled requirements and tasks lead to potential benefits such as discovery
of new areas, learning effects, new networks, maintained competitiveness or transition from imitation to innovation (Bürgel et al., 2008: 55). Scenario writing, brainstorming, content analysis, cost-benefit analysis, simulations and group discussions are the most frequently applied tools for technology assessment (Bonnet, 1994: 45).
3.1.5. Criticism
Even though Rogers diffusion of innovations theory found wide reach, its development in a very specific industry sector is often criticised. There is a large number of works published on diffusion theory, but only a few changes to Rogers´ theory have been done so far. Both factors increase concerns of subjectivity and missing cohesion make the theory difficult to apply to new problems. Over more, the complexity of individuals and social systems increase the difficulty to measure diffusion extremely (Katz, Levin and Hamilton, 1963: 237–252). Attitudes are less profoundly analysed than activities and diffusion is many times simply perceived as a consequence of a successful adoption. Research on adoption is weakened by a pro-innovation bias, individual-blame bias, recall problem and issues of equality (Rogers, 2003: 126ff). In terms of communication, one-way information flow, directed from the innovation developer to the customer is in complex environments highly insufficient. Instead, multiple communication flows are required (Robertson, Swan and Newell, 1996). In conclusion, there is indeed a mismatch between methods and complexity of consequences, underlining the assumption of a too generic approach (Wilde et al., 2009).
3.2. Digital Advertising
Digital advertising uses the Internet to deliver marketing messages to consumers. It includes several methods such as email marketing, social media marketing, search engine marketing or display advertising. Digital advertising involves a publisher, who integrates advertisements into online content and an advertiser (working for a vendor), who provides the advertisements displayed on the publisher's content.
Looking at the market, digital advertising spend continues to grow rapidly. The global broadband expansion will drive overall digital spending over the next years (McKinsey & Company, 2015: 17). According to a forecast by PWC, Internet advertising will
of 12.1%. Global total Internet advertising should grow from $135.42 billion in 2014 to $239.87 billion in 2019 (PricewaterhouseCoopers, 2015). Digital advertising was the fastest-growing category in 2014 with an increase of 6.1% (McKinsey & Company, 2015: 7). It will overtake TV advertising revenue to become the largest single advertising category by 2019 (PricewaterhouseCoopers, 2015). This pattern reflects the underlying market transition from traditional to digital media. A report by McKinsey & Company shows a spending growth of 2.2% in 2014 in Western Europe (including Germany). The Internet advertising is forecast to expand from $397.449 million in 2014 to $455.831 million in 2019. Still, Western Europe will be the slowest growing area of the EMEA countries with a CAGR of 2.8% over the next five years (McKinsey & Company, 2015: 8f). Compared with a 5.1% CAGR global consumer spending over the next five years, Western Europe will increase consumer spending by only 2.8% CAGR (McKinsey & Company, 2015: 7ff). As advertising spending grows, it also shifts to mobile: Media access through mobile devices is the fastest-growing sector of global media spending. It will become the principal digital platform with Internet advertising revenue’s growth of 23.1% and overtake display advertising by the end of 2018 (McKinsey & Company, 2015: 18; PricewaterhouseCoopers, 2015). eMarketer forecasts mobile advertising to account for 69.9% of the total digital advertising spending in 2019 (eMarketer, 2015: 2). As the advertising industry gets more fragmented, companies need more efficient techniques to communicate. Programmatic advertising is one of several techniques promising more efficiency by automating the decision-making process of buying, selling and placing advertisement using artificial intelligence and real-time bidding. In 2019, 50% of all display ads will be purchased programmatically (Magna Global, 2015).
3.2.1. User Satisfaction
Satisfaction and dissatisfaction with advertisement is a common subject along this thesis. To understand what dissatisfaction actually means it is necessary to define the term satisfaction. According to Oliver, satisfaction is understood as “the consumer’s fulfilment response. It is a judgment that a product/service feature, or the product and service itself, provided (or is providing) a pleasurable level of consumption-related fulfilment, including levels of under- or overfulfilment” (Oliver, 2010: 8). Most researchers confirm that the essential determinant of satisfaction is the confirmation or disconfirmation of pre-use or pre-consumption expectations. In summary, users or
customers evaluate product performance by comparing what they expected with what they believe they received (Oliver, 2010: 100f).
3.2.2. Advertising Avoidance
In academic research surrounding advertising avoidance, several factors such as attitudes towards advertisement, advertising clutter and advertisement related communication problems affect on advertising avoidance. Privacy concerns and the physical presence of others such as friends and family members can further strengthen advertising avoidance.
Researchers focus on the quantity of messages as well as on the importance of quality and relevance of an advertisement to the user as an explanation factor for advertising clutter (Ha and McCann, 2008: 575). When exposed to clutter, negative advertising effects occur such as advertising memory reduction, perception of low-quality advertising and finally advertising avoidance. Researchers found a correlation between perceived advertising clutter and advertising avoidance: Ha and McCann explain advertising avoidance as an outcome of advertising clutter. Both see the decision on resistance and avoidance of clutter as a negative response to advertising: Hence, attention to the advertisement message has to be earned with perceived interest, relevance and non-intrusive advertising (Ha and McCann, 2008: 574). Speck and Elliott believe the responses to advertisements are learned processes, which base on beliefs and attitudes towards advertisements. Both researchers identify types of communication problems, which correspond positively with advertising avoidance: Advertisements hinder user´s search for content, distract while processing content and disrupt the media processing process (Elliott and Speck, 1997: 63ff). Cho and Cheon conclude, as more negative beliefs are associated with advertisements, the higher is the risk of a cognitive and later physical action of avoidance: “Consumers who intensely dislike Internet ads are likely to increase their negative attitude toward Internet ads and avoid the source of their displeasure” (Cho and Cheon, 2004: 91). To satisfy users, Cho and Cheon recommend delivering the right message to the right people at the right time (Cho and Cheon 2004: 94).
3.3. Online Market Entry Strategy
A market entry strategy is defined as a planned method of delivering goods or services to a new target market and its distribution. LogOn´s target market, the digital advertising industry has a range of special features: The Internet is a universal open standards system with global reach and therefore available to all players. This fact lowers entry barriers and simplifies the marketplace entry of new competitors, which tends to intensify competition. Because everyone can excess the same information, the Internet shifts power to buyers who generally prefer lowest-cost providers (Porter, 2008).
“[...] the Internet cuts costs, increases competition and improves the functioning of the price mechanism. It thus moves the economy closer to the textbook model of perfect competition, which assumes abundant information, zero transaction costs and no barriers to entry” (The Economist, 30.03.2000).
An online market entry strategy needs to overcome general barriers of entry, identify the specific characteristics of the target market that affect the online search process and the contingent upon the enabling effects and role of the Internet channel. The possibility to research online as well as the high level of price dispersion encourages consumers to be more active. An adapted marketing strategy has to exploit the specific characteristics of the online channel and recognize how the characteristics of the target market affect the consumers search process. It is necessary “to position the Internet within the context of a firm´s overall marketing strategy, including the timing of market entry, the product offer, and partnership arrangements with other companies and branding” to archive a successful implementation (Holland and Mandry, 2012: 17).
3.3.1. Industry Analysis
The premise for the creation of a comprehensive market entry strategy is a deep insight into and knowledge about the specific industry. Porters Five Forces is a framework developed by Michael E. Porter to analyse the level of competition and business strategy development within the microenvironment of an industry. Following his theory, the structure of an industry is characterized by five forces: Threat of entry, bargaining power of suppliers, bargaining power of buyers, threat of substitutes and rivalry among existing competitors (Porter, 2008: 4). The extended rivalry resulting from the five
forces defines an industry’s structure and shapes the nature of competitive interaction in the same way. In that way the five forces determine competitive intensity and attractiveness of an industry, whereas attractiveness refers to the overall industry profitability. In contrast, an unattractive industry is one where the combination of these five forces drives down overall profitability. As an example serves the approach to the state of pure competition, where available profits for all firms are driven to normal profit. While a large number of factors may affect industry profitability in the short run, industry structure (the competitive forces) sets industry profitability in the medium and long run.
Even though the configuration of the five forces differs by industry, they exist in every industry: The threat of entry refers to new industry entrants who bring new capacities and desires to gain market share, putting pressure on prices and the rate of investment necessary to compete. It also depends on the height of entry barriers and the expected retaliation, the assumption of entrants on how incumbents may react. Barriers can be supply-side economies of scale, demand-side benefits of scale, customer switching costs, capital requirements, incumbency advantages independent of size, unequal access to distribution channels or restrictive government policy (Porter, 2008: 3ff).
The power of suppliers lies in capturing more of the value for themselves by charging higher prices, limiting quality or services or shifting costs to industry participants. They are able to squeeze profitability out of an industry, which is then unable to pass on cost increases in its own prices. Every company depends on a large number of different supplier groups for inputs. A supplier group is powerful if: It is more concentrated than the industry it sells to; it does not depend heavily on the industry for its revenues; the supplier group can credibly threaten to integrate forward into the industry; there is no substitute for what the supplier group provides; industry participants face switching costs in changing suppliers or suppliers offer products that are differentiated.
The power of buyers lies in capturing more value by demanding better service or better quality, forcing down prices and playing industry participants off against one other. The higher the power of buyers, the lower the profitability of an industry. Buyers are powerful if they have negotiating leverage relative to industry participants: If the customer amount is low and the sellers’ amount high, switching costs or product diversity is low. On the contrary, a buyer group is price sensitive if it is purchasing
consequences and are expensive relative to their incomes. Intermediate customers gain bargaining power when they manage to influence purchasing decisions of customers downstream.
The threat of substitutes decides how easy it is for customers to switch from a product or service to that of a competitor. A substitute basically performs the same or a similar function as an industry’s product. When the threat of substitutes is high, industry profitability suffers and substitute products or services limit an industry’s profit potential by placing a ceiling on prices. Substitutes are always present, but they are easy to overlook since they might be found in another industry. As long as an industry does not distance itself from substitutes through product performance or marketing, it will suffer in terms of profitability and sometimes growth potential. The threat of a substitute is high if the buyer’s cost of switching to the substitute is low or if it offers an attractive price-performance trade-off to the industry’s product.
Rivalry among existing competitors limits the profitability of an industry. The degree to which rivalry drives down an industry’s profit potential depends on the basis and intensity at which companies compete. The intensity of rivalry is greatest if exit barriers are high, competitors are numerous or roughly equal in size and power, rivals are highly committed to the business and have aspirations for leadership or if firms cannot read each other’s signals well. Rivalry is especially destructive to profitability if it gravitates solely to price because price competition transfers profits directly from an industry to its customers.
To sustain long-term profitability it is necessary to respond strategically to competition. By understanding how the five competitive forces influence profitability in an industry, a strategy can be developed to enhance a company’s long-term profit. Therefor Porter suggests positioning a company where the forces are weakest to exploit changes in the forces and reshape the forces in ones favour (Porter, 2008: 1).
4. Conceptual Framework
A conceptual framework “explains, either graphically or in narrative form, the main things to be studied—the key factors, concepts, or variables—and the presumed relationships among them” (Miles and Huberman, 1994: 18). It is a conception of the subject of a study and related questions on “what” and “why”. Looking through a macro
perspective the purpose of this thesis is a suggestion on expanding market strategies for LogOn´s matching technology. It focuses, more specifically on the field of digital advertisement by asking:
A. Can LogOn’s online matching technology expands into the field of digital advertising in order to create added value?
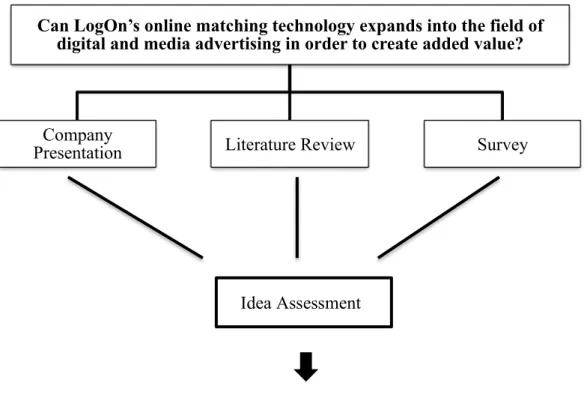
To answer this question, deeper research and investigation is necessary to identify first the current situation as well as the demand within the digital advertising market and second to evaluate LogOn´s chances for success in it. In the centre of attention stands an quantitative online survey investigating current market demand in Germany. The evaluation and analysis is packed into the comprehensive framework of Innovation Process. For that reason, the answer is subject to an idea assessment based on the extensive information generated with a company presentation, literature review, industry- and survey analysis.
Summing up all information available makes it possible to draw a conclusion on whether or not LogOn is able to expand into the market of digital advertising by creating added value. Added value describes a rather holistic value apart from company profit. It is a value of which LogOn and a greater community, industry or even society benefits. A positive answer will lead into the next research question by asking:
B. How can the market of digital advertisement be reached and developed?
This question enables a closer look into the micro perspective of the final product and alternative ways to successfully launch it. Instead of focussing on a single business model suggestion it appears more legitimate to investigate and present a variety of business models due to the range of different delivery and revenue-creation options. Every business model is followed by a suggestion of online market entry and marketing strategies. Finally, an evaluation of the business models can be made in combination with all information generated along this thesis. A final conclusion will support LogOn´s decision on whether or not to implement the product´s launch. However, the limited space of this master thesis and the constantly changing industry environment do not allow in-depth research, annotation and explanation of every single topic. This fact suspends a claim on completeness. Instead, it is an open and incomplete attempt to deliver a helpful suggestion on expending market strategies for LogOn.
Figure 2: Conceptual Framework
Can LogOn’s online matching technology expands into the field of digital and media advertising in order to create added value?
Company
Presentation Literature Review Survey
How can the market of digital and media advertisement be reached and developed? Business Models Business Strategy Digital Marketing Idea Assessment Final Conclusion
5. Methodology
To answer the research question presented in the chapter above, an empirical investigation has to be conducted to complete the theoretical fundament, obtained with the literature review. The combination of both allows statements and further conclusions about the potential success of the matching technology. The research’s objective is to test the technologies´ market potential in regard to research question A. Therefore a quantitative online survey was chosen as the most suitable method for data collection. It seems most convenient since the sample size has to be big enough to quantify the research objective by generating numerical data. This data has to be transformable into usable statistics as the survey attempts to be significant. The survey aims to identify the users perception of existing digital and media advertisement, test the individual demand for its personalization and thus demand for the technology in general.
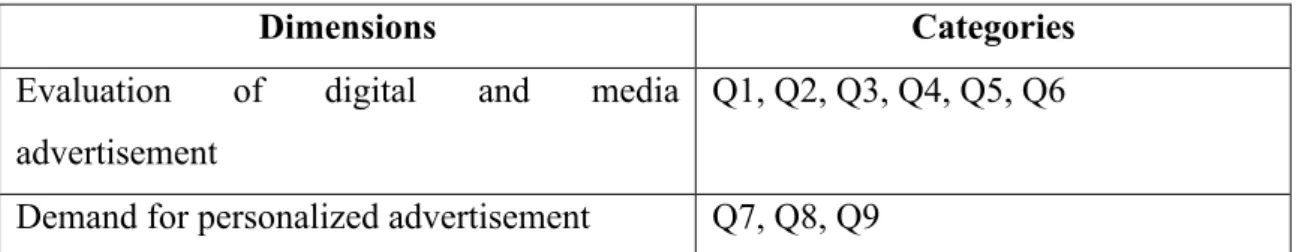
The development of the research instrument follows the Instrument Design Model suggested by Cooper and Schindler (Cooper and Schindler, 2014: 296). This model divides the instrument design process in three phases: The first phase starts by revisiting the research question to develop an instrument design strategy. The survey is lead by two questions: How does the user evaluate existing digital and media advertisement and does this perception increase the individual demand for personalized advertisement? Both survey questions correspond positively with research question A, since the survey questions result will provide information about existing demand. To guarantee that the survey measures what is wished to be measured and thus ensures validity, it requires a well-understood connection between research question A and the survey questions. Cooper and Schindler suggest the creation of a Preliminary Analysis Plan, which displays the data one expects to secure. It is a helpful tool to structure relations: In this perspective every survey question represents a dimension, which can be further divided into categories representing the questions of the questionnaire. The logical connection between the research questions, the dimensions of the survey question and corresponding categories ensure a correct operationalization.
Dimensions Categories Evaluation of digital and media
advertisement
Q1, Q2, Q3, Q4, Q5, Q6
Demand for personalized advertisement Q7, Q8, Q9
Figure 3: Dimensions and categories representing the questions of the questionnaire
After dimensions and corresponding categories are defined, measurement questions can be constructed and refined. Looking at the micro perspective, the generation of specific measurement questions requires high attention to detail: The content, the wording and a response strategy have to be defined for each single question. Viewed from a macro perspective, the questions have to be structured into categories such as target (investigative questions of the specific study) and socio-demographic questions. Eichhorn recommends, other then Cooper and Schindler, the use of an introduction and a final sentence (Eichhorn, 2004: 18). If applicable, Kromrey suggests to structure investigative target questions into sub-categories to simplify understanding and reading (Kromrey, 2010: 361). This practice also avoids the halo-effect, a cognitive bias in which an observer's overall impression influences its feelings and thoughts (Kahneman, 2011: 82). The third step concentrates on drafting and refining the instrument in terms of topic and question sequencing. Question design and sequence base on selected theories about advertising avoidance from Ha and McCann (2008), Cho and Cheon (2004) as well as Elliot and Speck (1997). The questionnaire was pretested several times to improve content validity (Flynn et al., 1990). The result of this instrument design process is finally a valid and functional questionnaire.
5.1. Research Design
To meet the criteria of reliability, the questionnaire is fully standardized, meaning that every respondent receives identicall questions in the same sequence and under the same circumstances (Kromrey, 2010: 365). The questionnaire consists of fourteen structured and undisguised questions, which are open, nominal, ordinal and balanced five-level Likert-scaled. Answer possibilities are either neutral exclusive, multiple-choice or open. The first section of nine main questions is followed by a second section of five socio-demographic questions referring to personal data. The questionnaire design was agreed with and adapted to the requirements of LogOn and the supervising professor. Since
digital advertisement lies in the focus of attention, it appears natural to use the Internet as the research medium: The list-based survey is conducted online and distributed by e-mail using unpaid and paid services in social media networks such as Xing, LinkedIn and Facebook. The survey is developed with the online research software tool Qualtrics, which enables online data collection and analysis. The sample receives an email with an invitation to answer the questionnaire anonymously.
To ensure validity in terms of precision and accuracy, the target population has to fulfil specific criteria: The sample has to use the Internet as well as social media (Facebook, Xing, LinkedIn) on regular basis. It is a behaviour, which allows assumptions about potential demand for the technology. Looking at socio-demographics, population elements of mixed genders have to be between 15 and 70 years old as well as resident in Germany. The technologies target groups cover B2C users as well as B2B publishers and vendors (see chapter 7.1). Here, the demand of end users is the deciding factor for the success of the technology: it is only successful if end users demand, accept and use the product. It is the user for that reason, who is the target of the survey.
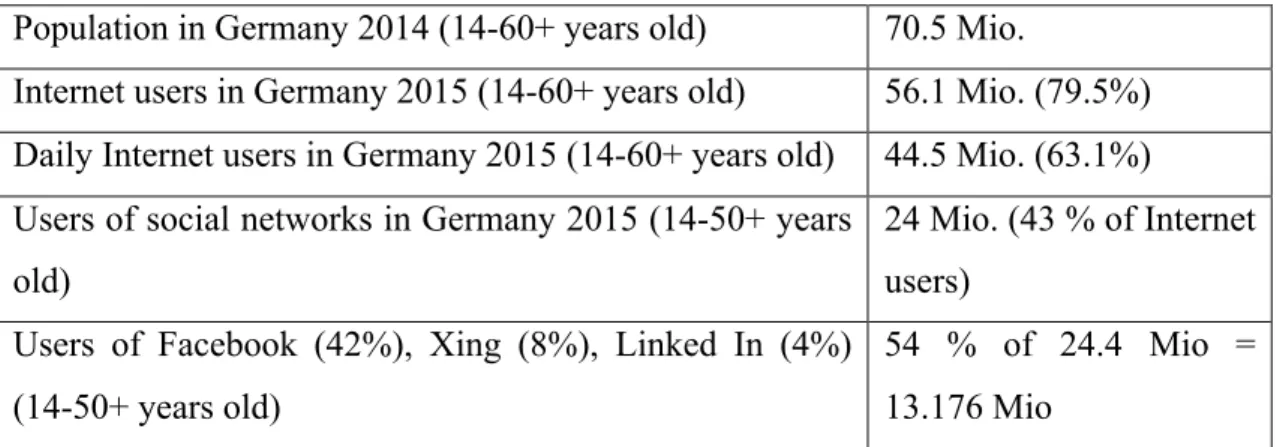
Several details have to be considered when it comes to sample size: To ensure representativeness (in terms of precision, narrow error margin and higher confidence level), the sample size is chosen in respect to the target population and to research resources available. 24 Million German users of social networks represent the surveys target population. The survey result can be generalized to the users of social networks in Germany, but not to Internet users in general.
Population in Germany 2014 (14-60+ years old) 70.5 Mio.
Internet users in Germany 2015 (14-60+ years old) 56.1 Mio. (79.5%) Daily Internet users in Germany 2015 (14-60+ years old) 44.5 Mio. (63.1%) Users of social networks in Germany 2015 (14-50+ years
old)
24 Mio. (43 % of Internet users)
Users of Facebook (42%), Xing (8%), Linked In (4%) (14-50+ years old)
54 % of 24.4 Mio = 13.176 Mio
Figure 4: Internet users in Germany (Frees and Koch, 2015: 367; Tippelt and Kupferschmitt, 2015: 442, 444)
The bigger a sample, the more complicated is the implementation, because more resources in terms of cost and time are needed. Considering the budget, available resources, the research objective and the survey´s time frame of 4-6 weeks, the sample should contain a minimum of 250 elements. This number appears realistically feasible since enough time and resources are available to survey 250 individuals. The research´s objective is to gain understanding of the current market demand. Already the number of 250 elements can give a strong impression whether or not demand for the technology exists. The sample will be selected using a non-random sample or convenience sample, since respondents voluntarily decide whether or not to answer the questionnaire. If the sample was simple random, the sample dimension of 250 would assure an error margin of ±6.2% for a confidence level of 95%. If the error margin is whished to be smaller ( ±5%) a sample of 385 would be needed. The survey software Qualtrics saves all responses of the sample during 8 weeks of surveying. Once the survey is concluded, the analysis can be initiated.
5.2. Research Analysis
The data analysis is made with the statistic program SPSS. To insert the data of the questionnaire into SPSS two questions, namely city of residence and occupation, have to be classified into categories in order to be operational. Therefor cities of residence are categorised in the states of Germany and occupations into the occupation category system suggested by ILO (International Labor Organization, 2012: 14). In the centre of attention lays the calculation of Cronbach's alpha, factor analysis, one-sample t-test and chi-square. The nature of the questionnaire and due to the analysis is oriented on frequencies. The result of the survey will finally allow further considerations surrounding the implementation of the product.
6. Analysis
In this chapter all information generated with literature review and empirical research will be collated and analysed in reference to the research questions. The analysis is structured after the framework of Innovation Process (see p. 14), which offers a clearly arranged step-by-step approach. The logical structure of this thesis allowed the
elaboration of the innovation processes first step of strategic planning and problem definition at an earlier stage in the chapters 4 and 5. That reason legitimates the start of the analysis at the second step of idea generation. The market launch, as the last step of the innovation process, requires the elaboration of business models. To highlight the business models importance, the last step market launch is renamed to business models.
6.1. Idea Generation
The second step, idea generation, requires organizational creativity, what means the promotion of individual creativity through decentralisation and creativity techniques such as brainstorming.
The idea generation process starts by examining Gassmann and Sutter´s three motives for service innovations to find out what the final product should deliver: The customer perspective monitors changes of customer needs and expectations. The strategic perspective finds new competitive advantages and creates market entry barriers. The financial perspective activates additional growth potentials (Gassmann and Sutter, 2008: 222). As a result, all three perspectives are relevant for LogOn, since the product aims to create new competitive advantage, satisfy new customer needs and activate additional competitive advantage. The final product must therefore satisfy each perspective.
Following the customer perspective, Bettencourt, Brown and Sirianni suggest four steps to approach service innovation: the first step requires an active partnership with customers by asking which jobs they are trying to accomplish. This process includes asking the right questions, learning and investigating answers to uncover blind spots to finally develop a company-wide peripheral vision. The second step suggests identifying if these jobs are part of a larger process. As soon as the beginning and end point of a customer job can be identified, the metrics by which customers judge how well the job is done can be revealed and measured. Now it is key to develop offers that help customers to improve the execution of their job. As the third step, it is important to investigate existing opportunities to get customers jobs done. The focus lies on the outcomes that customers use to measure success with, regardless of the method of achieving it at each step in the entire customer job. As a next step, they have to be prioritized by determining what customers consider as important. The fourth and last
customer as well as for the company (Bettencourt, Brown and Sirianni, 2013: 15–20). In summary, the early inclusion of the customer into the innovative process of product (or service) creation will benefit both the customer as well as the company.
After using brainstorming coupled with general research and a sense for windows of opportunities created by business encounters, a concrete product idea could be generated. LogOn´s matching technology is able to filter information in regard to a certain topic or profile (see p. 13). That means it can be used to organise or break down complex and big amounts of information. By that way the area of digital advertisement moved into the centre of attention: here, the matching technology is able to intuitively create a profile of a user while he is visiting a website, online shopping, watching TV or posting on social media sites. The profile consists of expected individual interests and preferences relying on a specific behavioural pattern identified with 2,3 clicks taking approximately 30 seconds. The algorithm works intuitively, what means that depending on where the user clicks, the algorithm investigates why a user is clicking on a specific field. It looks at the background or motivation of an information or action and estimates the possible consequence of that information or action. What differentiates the technology from common matching technologies is the ability to generate additional information intuitively by combining existing information. By that way the final result will be more precise and suitable, what increases the technologies competitive advantage. The algorithm establishes connections of information where initially non-existent and avoids wrong connections. As a result, the technology solely shows the customer advertising content, which is relevant to him and to his current situation. The matching technology serves practically as an intelligent spam filter, which is able to exclude irrelevant content from a user’s computer, tablet and smart phone. Regular spam filters, in compare, only filter on the base of IP-addresses and domains, what works only superficial, less efficient and irrelevant. The technology can be designed as a background app for mobile and desktop devices. It can be also used directly by companies as a plug into their own website, to optimize direct mailing campaigns and digital advertisement. Here, the technology can offer a better customer experience and increase customer satisfaction. Looking through a strategic perspective: because the use of the Internet is constantly increasing, an innovative technology offering a personalized reduction of everyday-complexity has big market potential, especially as it creates competitive advantage and added value: by offering users a more enjoyable
advertisement experience it makes advertisement more effective and successful. That in the next step increases sales volume of advertisers, who are able to sell advertising spots more expensive. In fact, the target groups create a long and strong value chain. Many e-commerce business models show, in compare to traditional e-commerce, a characteristic structure of two target groups: one target group is the main beneficent of the service, while the other one pays for it. The paying target group carries different benefits from it.
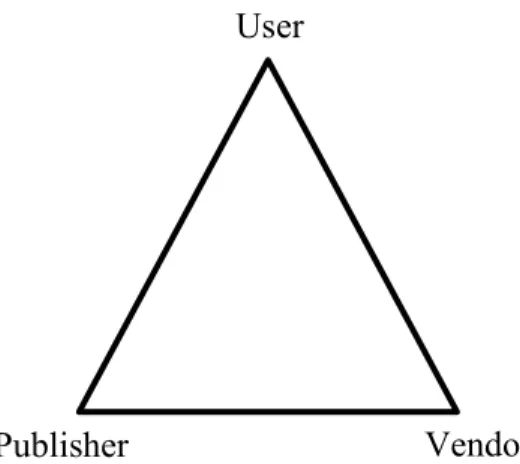
LogOn´s matching technology has three target groups: users, publishers and vendors. The first group consists of users (private persons), who downloaded the technology on their devices to receive less spam and a personalized offer of advertisement. Users navigate in the Internet on a regular basis and are approximately between 14 and 70 years old. Besides of being active users of the technology, they watch or even demand to watch advertisement of vendors on publisher websites, which is already linked with the technology. Their incentive to use the technology is a better user experience. The user is the main carrier of benefits and the final consumer in any case. Both vendors and publishers are advertisers.
The second group consists of publishers (owners) of websites, platforms, portals or devices such as Amazon, Hotels.com or Apple. Publishers can also be TV channels or hardware producer. By installing the technology on their online space, they are able to offer a better user experience and increase traffic. With the use of the technology publishers can attract vendors (who advertise on publishers websites) with increased traffic and user satisfaction on one hand and with target specific advertisement, which increases the advertisements click through rate (CTR) on the other hand. As a result, publishers use the technology to sell advertising spots at a higher cost.
The third group consists of vendors (e.g. Adidas, Audi, etc.), who buy advertisement space on publishers websites. They can rather use the technology offered by the publisher (indirectly) or purchase and integrate the technology into their advertisement campaign (directly) even before it goes to the publishers website. Vendors benefit from the increased amount of satisfied users, a better segmentation of their audience by targeting specific advertisements to specific users and more efficient and effective advertisement in total.
A look at the distribution of pressure shows the importance of the user: as the end users, they are the deciding factor as to whether the technology gets sold. Publishers and vendors will only implement the technology when users are accepting or demanding it. That is why this target group is of special importance and the target group for the survey. The three target groups can be visualized in a triangle relationship: the user is the general target of advertisement. The publisher owns the media channel where advertisement is placed on. The vendor is advertising products or services on this media channel.
Figure 5: Triangle relationship of target group
6.2. Idea Assessment
This chapter will merge derived information and survey results to a final assessment of the product idea and tests its market adequacy. The survey analysis will give a closer insight into user behaviour to understand the reasons for the adoption and use of the product. Following the framework of Innovation Process, idea assessment includes a technological assessment. At this point of the product development process and in regard to the information available no further statement about technology can be made. Nevertheless, it remains open for further research and considerations to deliver a comprehensive product assessment. For that reason an introduction into technological assessment was made in chapter 3.1 (see p. 18).
Vendor s User
6.2.1. Survey Analysis
The survey took place between 2 of May 2016 and 5 of July 2016 with an average responding time of 7 minutes per questionnaire. In total 280 questionnaires were filled out, but all questionnaires with less then 50 % answered were eliminated. After the elimination process 266 valid questionnaires remained. A descriptive analysis of the frequencies of socio demographics is a requirement for a comprehensive understanding of the results (Behnke and Behnke, 2010: 53).
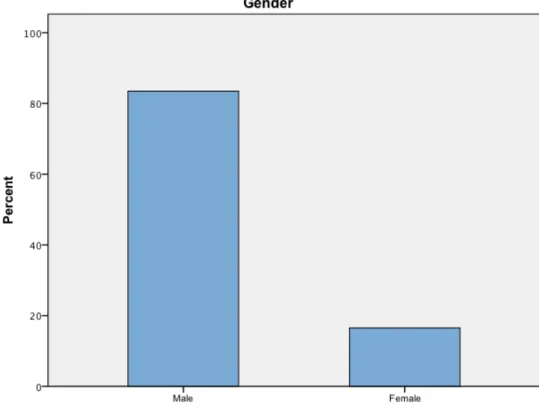
The sample contains 77.8% men and 15.4% women. The unproportionally high amount of men in the sample limits representative conclusions about preferences of women.
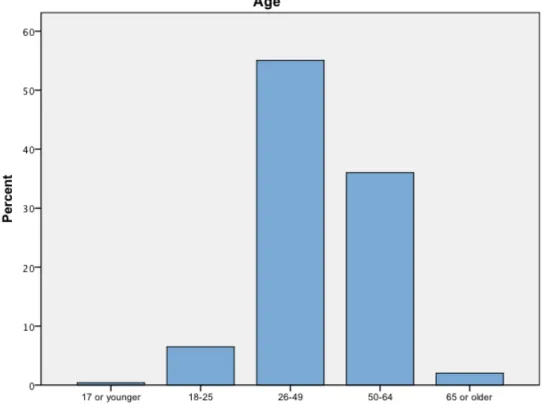
The majority (51.1%) of the sample is between 26-and 49-years-old. 0.4% are 17 or younger, 6% between 18-and 25-years-old, 33.5% between 50-and 64-year-olds as well as 1.9% 65 and older. The distribution of age follows a normal distribution.
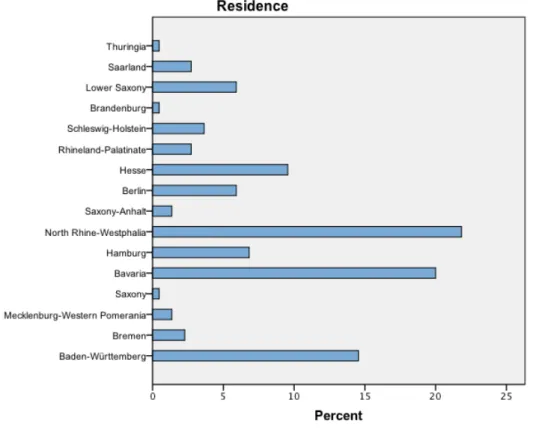
The sample majority comes from the German states of North Rhine-Westphalia (21.8%), Bavaria (20%) and Baden-Württemberg (14.5%).
Figure 8: Residence frequencies (SPSS)
When it comes to education level 31.2% of the respondents have a university degree, 25.5% a polytechnic degree and 21.5% a completed formation. Less represented are high school education (10.9%), postgraduate degree (9.3%) and 8th grade graduates (1.6%).
Figure 9: Education frequencies (SPSS)
The most frequent occupation categories are professionals (37.2%), managers (14.7%) and clerical support workers (15%).
As a result, the sample is on average male, between 26-and 64-years-old, situated in southwest Germany, highly educated and in higher professional positions.
Cronbach's alpha
Cronbach's alpha is a measure of internal consistency that describes the extent to which all items (dimensions and corresponding categories) in a test measure the same concept or construct (Bryman, 2016: 158). Testing dimension 1 gives a value of 0.475 for Cronbach´s alpha with 29 items (N=29). To increase the reliability coefficient it is necessary to eliminate all items represented in the “corrected item-total correlation”. In that case eliminating all items that are smaller then zero appears to be the appropriate rule. As a result, Cronbachs alpha has a higher reliability coefficient of 0.530 (N=22). Comparing the value with the rule for describing internal consistency (0.70 or higher is considered acceptable) the value 0.530 turns out to be rather poor. Calculations for dimension 2 show the value of 0.328 (N=4) and after correction 0.533 (N=2). Also for dimension 2 internal consistency is rather poor.
Factor Analysis
Factor analysis describes the variability among observed and correlated variables in terms of a potentially lower number of unobserved, underlying variables. It reduces the information by grouping similar variables into dimensions and thus reduces the dimensions of the observations (Bryman, 2016: 168). The factor analysis of 32 items shows 13 components with initial eigenvalues higher then one. Looking at the screen plot a second reduction to four components seems accurate. As a result, 29.913 % of items are explained by 4 components (factors): The first factor shows the highest values at question 4 (0.869) and question 5b (-0.660). The value of the second question is negative because it is questioning negative memory. This factor can be interpreted as the level of familiarity and ability of retrospection, since former perceived feelings towards advertisement are extremely important for the construction of current attitudes towards it. Since analysis underlines the importance of this factor it can be interpreted as a seal of quality, because it is exactly what the questionnaire is supposed to survey: The factor is corresponding with the input-oriented dimension 1 focussing on the evaluation of digital and media advertisement.
The second factor shows highest values at question 2.1 (0.692) and question 2.6 (0.612). The factor can be interpreted as underlying importance, requirements and demand. It investigates what people are wishing for, what they want and what they need. Just where demand exists the market for a product exists.
Just like factor three, interpreted as open-mindedness, willingness and openness based on highest values at question 1.6 (0.857) and question 1.7 (0.836), factor two is corresponding with the output-oriented dimension 2 focussing on demand for personalized advertisement. The factor explains the fundamental requirements needed to make diffusion happen.
Factor four revealed underlying needs of security, privacy and intimacy with highest values at question 2.10 (0.793) and question 2.11 (0.804). If the product manages to respect these intimate requirements, chances to succeed are higher, because users feel understood in their needs.
Also factor analysis shows the importance of customer satisfaction: Just a product that appeals to customers needs and make them feel understood in their pain points will be not just accepted and purchased but most importantly retained.
Chi-Square Test
The chi-square test is used to determine significance, which is used to compare observed frequencies with expected frequencies (Jupp, 2006: 26). It is a test of the null-hypothesis, which states the independence of variables. By comparing p-value and significance level the null hypothesis gets rejected when the p-value is less than or equal the significance level.
One sample T-Test
The one sample t-test examines the mean difference between the sample and the known value of the population mean or some other theoretically derived value (Singh, 2007: 164). As a result, population means are statistically significantly different with a high significance level of p < 0.0005 for all questions. This result can stand in connection with a sufficiently large sample size.