1
2
Conjugated linoleic acid reduces permeability and fluidity of adipose plasma
3
membranes from obese
Zucker
rats
4
Ana P. Martins
a, Paula A. Lopes
b, Susana V. Martins
b, Ana Madeira
a,c, Nuno C. Santos
d, José A.M. Prates
b,
5Teresa F. Moura
a, Graça Soveral
a,e,*6 aREQUIMTE, Dep. Química, FCT-UNL, 2829-516 Caparica, Portugal
7 bCIISA, Faculdade de Medicina Veterinária, TULisbon, 1300-477 Lisboa, Portugal
8 cInstitute for Research in Biomedicine (IRB, Barcelona), C/Baldiri Reixac 10, Barcelona, Spain
9 dInstituto de Medicina Molecular, Faculdade de Medicina, Universidade de Lisboa, 1649-028 Lisboa, Portugal
10 eFaculdade de Farmácia, Universidade de Lisboa, 1649-003 Lisboa, Portugal
11 12 13 1 5
a r t i c l e i n f o
16 Article history: 17 Received 10 June 2010 18 Available online xxxx 19 Keywords:20 Conjugated linoleic acid 21 Adipose plasma membrane 22 Glycerol permeability 23 Water permeability 24 Membrane fluidity 25 Obese Zucker rats 26
2 7
28 Abstract:Conjugated linoleic acid (CLA) is a dietary fatty acid frequently used as a body fat reducing
29 agent whose effects upon cell membranes and cellular function remain unknown. Obese Zucker rats were
30 fed atherogenic diets containing saturated fats of vegetable or animal origin with or without 1% CLA, as a
31 mixture of cis(c)9,trans(t)11 and t10,c12 isomers. Plasma membrane vesicles obtained from visceral
adi-32 pose tissue were used to assess the effectiveness of dietary fat and CLA membrane incorporation and its
33 outcome on fluidity and permeability to water and glycerol. A significant decrease in adipose membrane
34 fluidity was correlated with the changes observed in permeability, which seem to be caused by the
incor-35 poration of the t10,c12 CLA isomer into membrane phospholipids. These results indicate that CLA
supple-36 mentation in obese Zucker rats fed saturated and cholesterol rich diets reduces the fluidity and
37 permeability of adipose membranes, therefore not supporting CLA as a body fat reducing agent through
38 membrane fluidification in obese fat consumers.
39 ! 2010 Published by Elsevier Inc.
40 41
42 1. Introduction
43 Increased consumption of highly energetic food with high levels
44 of saturated fats have led to a threefold increase of obesity rates in
45 industrialized societies contributing to human premature
morbid-46 ity and mortality[1]. Facing this worldwide health problem, new
47 compounds that might prevent or even reverse such scenario have
48 attracted scientific attention. One of the natural compounds most
49 studied in the last decades as a body fat reducing agent is the
con-50 jugated linoleic acid (CLA). CLA is a generic term for a mixture of
51 geometrical and positional isomers of linoleic acid (18:2n ! 6)
52 with conjugated double bonds in either cis (c) or trans (t)
configu-53 ration, found mainly in ruminant-derived foods[2]. Being a dietary
54 fatty acid, CLA reveals an impressive range of promising health
55 benefits including reduction of body fat mass[2]but the
mecha-56 nisms by which CLA elicits its promising effects remain unknown.
57 It is known that CLA isomers rapidly incorporate into cell
mem-58 brane lipids [3,4], but their outcome on cell membranes and
59 changes in cellular function is still unexploited. Due to the
poten-60 tial anti-adipogenic effect attributed to CLA, it would be interesting
61
to gain insights on its effect on adipose tissue and specifically on
62
adipose membrane composition, permeability and fluidity. It has
63
been reported that incorporation of polyunsaturated fatty acids
64
(PUFA) into cellular membranes increases fluidity and permeability
65
[5]. Moreover, the effect of diet supplementation with CLA has
66
been shown to modify lipid composition and glycerol permeability
67
of rat kidney membranes[4]. Glycerol is a key substrate involved in
68
lipogenesis and lipolysis of adipose tissue; glycerol release and
69
uptake from the adipocyte is mediated by aquaporin 7 (AQP7), a
70
glycerol-channel that regulates glycerol accumulation[6].
71
The present study aimed at assessing the effect of dietary CLA
72
on adipose membrane lipid composition and further correlate it
73
with changes in permeability and fluidity. In order to reproduce
74
the most frequent human group consuming CLA as a promoter of
75
body fat mass reduction, our experimental design included obese
76
Zucker rats fed atherogenic diets containing saturated fats of
77
vegetable and animal origins (palm oil and ovine fat) and with or
78
without 1% CLA mixture. An enriched preparation of plasma
79
membrane vesicles, osmotically responsive and suitable for
trans-80
port experiments, has been obtained from rat white adipose tissue.
81
Membrane vesicles were analyzed regarding their total lipid profile
82
and CLA incorporation into membrane phospholipids.
Permeabili-83
ties to glycerol and water were assessed and used to estimate
84
the activation energy of transport, a valuable parameter indicating
0006-291X/$ - see front matter! 2010 Published by Elsevier Inc. doi:10.1016/j.bbrc.2010.06.059
* Corresponding author at: REQUIMTE, Dep. Química, FCT-UNL, 2829-516 Capa-rica, Portugal. Fax: +351 212948550.
E-mail addresses:[email protected],[email protected](G. Soveral).
Contents lists available atScienceDirect
Biochemical and Biophysical Research Communications
85 the relative contribution of specific transport proteins for
mem-86 brane permeation. The relationship between membrane
composi-87 tion and fluidity was further characterized by fluorescence
88 anisotropy, a method sensitive to the packing density induced by
89 cholesterol and membrane lipids incorporation.
90 2. Materials andmethods
91 2.1. Experimental design: animals and diets
92 The experimental protocol was reviewed by the Ethics
Commis-93 sion of CIISA/FMV and approved by the Animal Care Committee of
94 the National Veterinary Authority following European Union
95 guidelines (N. 86/609/EEC).
96 Male obese Zucker (fa/fa) rats (n= 32) were obtained from
97 Harlan Interfauna Iberia (Barcelona, Spain), aging 5 weeks old.
Ani-98 mals were housed individually and after 1 week of adaptation, rats
99 were fed semi-purified atherogenic diets (Provimi Kliba, SA,
Swit-100 zerland), with 2% (w/w) cholesterol (plus 0.5% (w/w) sodium
cho-101 late to improve cholesterol absorption) and 15% (w/w) of fat with
102 distinct fatty acid composition [7]. Rats were divided into four
103 groups with eight animals each, according to the dietary fat: group
104 P –11.3% palm oil (w/w) plus 3.8% (w/w) sunflower oil; group
105 PCLA–11.3% (w/w) palm oil plus 2.5% sunflower oil (w/w) plus
106 1.2% (w/w) CLA; group O–11.3% (w/w) ovine fat plus 3.8% (w/
107 w) sunflower oil; group OCLA–11.3% (w/w) ovine fat plus 2.5%
108 (w/w) sunflower oil plus 1.2% (w/w) CLA. The CLA oil contained
109 similar proportions of c9,t11 and t10,c12 isomers with a purity
le-110 vel of 80% (PharmaNutrients Inc., USA). After 14 weeks of trial, rats
111 were fasted for 12 h and sacrificed by decapitation under light
iso-112 fluorane anaesthesia (Abbott, USA). The epididymal fat pads were
113 removed, washed with saline, weighted and stored at!80"C for
114 subsequent analysis.
115 2.2. Preparation of membrane vesicles from epididymal fat
116 Membrane vesicles were prepared from rat’s epididymal fat by
117 differential centrifugation with buffer without detergents.
Approx-118 imately 4 g of epididymal white fat tissue from each rat was
119 chopped into small pieces, removing visible endothelial tissue,
120 and homogenized in mannitol-Hepes buffer (100 mM mannitol,
121 10 mM Tris–Hepes,pH 7.4) in a warring blender for 2 min. The
122 homogenate was filtered through a 70
l
m nylon mesh to further123 separate the vascular stroma from fat. The filtrate was centrifuged
124 at 1800 g for 10 min and the supernatant, consisting in
intracellu-125 lar fat, was discarded. The infranatant was centrifuged at46,000g
126 for 45 min at 10"C to obtain a pellet of crude membranes, and
127 further washed in the same buffer. The membrane pellet was
128 resuspended in mannitol-Hepes buffer, transferred to a syringe
129 and sheared by vigorously passing it 10 times through a 21-gauge
130 needle and immediately used for transport experiments. Protein
131 content was determined by the Bradford technique[8].
132 2.3. Vesicle size determination
133 Vesicle size of all the membrane preparations was determined
134 by the Quasi-Elastic Light Scattering (QELS) technique (Brookhaven
135 Instruments BI-90).
136 2.4. Immunoblot analysis
137 Proteins were resolved in12.5% (w/v)SDS–PAGE and
trans-138 ferred to PVDF membrane (Immobilon-P membrane; Millipore).
139 After blocking with 10% nonfat powder milk in PBS for 1 h at room
140
temperature, the membrane was incubated overnight at 4"C with
141
primary rabbit antibodies against GLUT4 (BD Transduction
Labora-142
tories, Canada), caveolin (Dept. Bioquímica i Biologia Molecular,
143
Facultat de Biologia, Universitat de Barcelona, Spain) and AQP7
144
(Millipore). Immunoblot analysis was performed with the
en-145
hanced chemiluminescence system and horseradish peroxidase
146
conjugated with anti-rabbit IgG (Amersham).
147
2.5. Fatty acid composition and cholesterol content of adipose
148
membranes
149
After membrane vesicle lyophilisation, fatty acids were
con-150
verted to methyl esters (FAME) according to[9]. The resulting
151
FAME were analyzed by gas chromatography (GC), using a capillary
152
column (Omegawax 250; Supelco, USA), equipped with a
flame-153
ionization detector. The fatty acid composition was expressed as
154
g/100 g of total fatty acids identified.
155
Total cholesterol was extracted from lyophilised membrane
156
vesicles through a direct saponification with saturated methanolic
157
KOH solution[10]. Cholesterol was separated and identified using
158
a high performance liquid chromatography (HPLC) equipment
159
(Agilent 1100 Series, Agilent Technologies Inc., USA) by normal
160
phase (Zorbax Rx-Sil column, Agilent Technologies Inc.). Total
cho-161
lesterol content was calculated, in triplicate, based on the external
162
standard technique, from a standard curve for peak area versus
163
cholesterol concentration and expressed as mg/g vesicles.
164
2.6. Stopped-flow experiments on water and glycerol permeability
165
Stopped-flow experiments were performed on a HI-TECH
Scien-166
tific PQ/SF-53 apparatus, which has a 2 ms dead time, temperature
167
controlled and interfaced with a PC microcomputer. Experiments
168
were performed at temperatures from 14"C to 37 "C. Five runs
169
were usually stored and analysed in each experimental condition.
170
For the measurement of osmotic water permeability, membrane
171
vesicles (0.2 mg protein/ml) resuspended in mannitol-Hepes buffer
172
(120 mOsM) were mixed with an equal amount of isosmotic or
173
hyperosmotic (240 mOsM) mannitol solutions to reach an
in-174
wardly directed gradient of the impermeant solute. The kinetics
175
of vesicle shrinkage was measured from the time course of
scat-176
tered light intensity at 400 nm until a stable light scatter signal
177
was attained. The osmotic water permeability coefficient (Pf) was 178
estimated by fitting the light scatter signal to a single exponential
179
curve and using the linear relation betweenPfand the exponential 180
time constant k[11],Pf= k(Vo/A)(1/Vw(osmout)1),where Vwis the
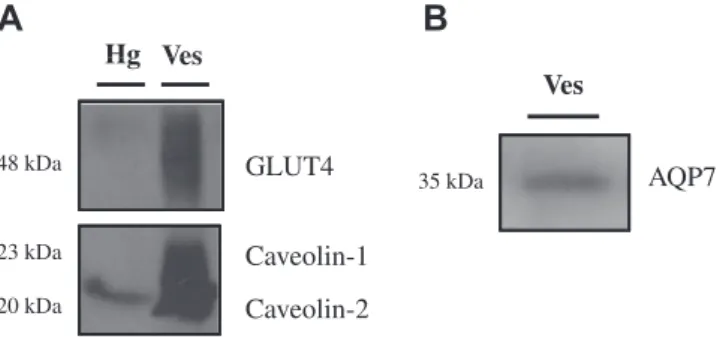
181
molar volume of water, V0/Ais the initial volume to area ratio of
182
the vesicle preparation, and(osmout)1is the final medium
osmolar-183
ity after the applied osmotic gradient. For glycerol permeability,
184
membrane vesicles equilibrated in 120 mOsM mannitol-Hepes
185
buffer were confronted to an external solution where the
imper-186
meant solute was partially replaced by glycerol (60 mOsM
manni-187
tol plus 180 mOsM glycerol, creating an inwardly directed glycerol
188
gradient). After the first fast vesicle shrinkage due to water
out-189
flow, glycerol influx in response to its chemical gradient was
fol-190
lowed by water influx with subsequent vesicle reswelling.
191
Glycerol permeability was calculated asPgly= k(Vo/A),where k is 192
the single exponential time constant fitted to the light scattering
193
signal of glycerol influx[12]. For inhibitor assays, vesicles were
194
incubated for 5 min with 0.5 mM HgCl2 immediately prior to
195
stopped flow injection. All solution osmolarities were determined
196
from freezing point depression on a semi-micro osmometer
197
(Knauer GmbH, Germany) using standards of 100 and 400 mOsM.
198
The activation energy Eaof water and glycerol transport was
199
calculated from the slope of the Arrhenius plot (lnPfor lnPglyas a
200
201 2.7. Membrane fluidity measurements
202 Membrane fluidity was studied by a fluorescence polarization
203 method, which measures the fluorescence anisotropy, of two
204 probes incorporated in the membrane:
1,6-diphenyl-1,3,5-205 hexatriene (DPH), or
1-(4-(trimethylamino)-phenyl)-6-phenyl-206 1,3,5-hexatriene (TMA-DPH), (Molecular Probes, USA). DPH is
207 incorporated inside the membrane, at the fatty acyl group’s level,
208 while TMA–DPH is anchored by its cationic part at the
mem-209 brane/water interface, probing the membrane region closer to
210 the phospholipids head groups [13]. DPH 1 mM in acetone or
211 TMA–DPH 0.5 mM in dimetylformamide were diluted 1:180 in
212 mannitol-Hepes buffer, vigorously stirred for 1 min, mixed with
213 an aliquot of the vesicle suspension (final protein 20
l
g/ml)and214 incubated 30 min in the dark, at 37"C for DPH and at room
temper-215 ature forTMA–DPH. Blank samples were prepared replacing the
216 probes by identical volumes of their solvents. As the fluorescent
217 probes reach equilibrium between the aqueous and lipid phases
218 and the unincorporated probes almost do not fluoresce [14], no
219 washing was needed. Membrane fluidity was assessed by
fluores-220 cence anisotropy (r) defined by the equation r = (IVV !GIVH )/
221 (IVV+2 GIVH), where IVV and IVH are the fluorescence intensities
222 and the subscripts indicate the vertical (V) or horizontal (H)
orien-223 tations of the excitation and emission polarizers, and G = IHV/IHHis
224 the instrumental factor[15]. DPH fluorescence was measured at an
225 excitation wavelength (kexc) of 357 nm and an emission
wave-226 length (kem) of 428 nm. For TMA–DPH, kexc= 343 nm and
227 kem= 427 nm. The fluorescence intensity data used for calculations
228 were the average of three identical aliquots (after blank
subtrac-229 tion) measured on a Varian Cary Eclipse fluorescence
spectropho-230 tometer (Mulgrave, Australia).
231 2.8. Statistics
232 Statistical analysis was performed using thestatistical analysis
233 system (SAS) software package, v9.1 (SAS Institute, USA). Data
234 were mean and standard error of the mean (SEM). The procGLM
235 procedure was used to perform a 2 " 2 factorial analysis to
deter-236 mine significant effects of CLA, fat origin and their respective
inter-237 action (CLA"fat). In the case of interaction, significant differences
238 between groups were identified using Tukey’s post-hoc test at
239 P< 0.05.
240 3. Results
241 3.1. Characterization of membrane vesicles from epididymal fat
242 Vesicle size of membrane preparations within each dietary
243 treatment (n= 8)revealed homogeneous populations with
mono-244 modal distributions, showing a mean diameter of (303 ± 42,
245 297 ± 54, 319 ± 50 and 276 ± 44) nm for P, PCLA, O and OCLA
246 groups, respectively.
247 Western blots of aliquots from the initial fat tissue homogenate
248 and from the final adipose membrane preparations were incubated
249 with antibody anti-GLUT4 and anti-caveolin. Additionally,
mem-250 brane preparations were incubated with anti-AQP7. An intense
251 band of GLUT4, the insulin-stimulated glucose transporter[16],
252 was depicted in the membrane vesicles but was almost absent in
253 the homogenate fraction (Fig. 1). Likewise, the band for caveolin,
254 a constitutive protein of plasma membranes of mature adipocytes
255 [16], was stronger in the final vesicle preparation. AQP7 was also
256 detected in the adipose membranes, despite in a fainter band than
257 caveolin. Altogether, these results assure purified and
homoge-258 neous adipose plasma membrane preparations.
259
3.2. Fatty acid membrane composition depends on dietary fat and CLA
260
supplementation
261
The fatty acid composition of membrane vesicles from the four
262
dietary treatments is shown inTable 1. Total cholesterol content
263
was higher in membranes from palm oil groups and not affected
264
by CLA supplementation. The deposition of total saturated fatty
265
acids (SFA) was not different among groups. However, while the
266
16:0 incorporation was greater in palm oil groups, the 18:0 and
267
20:0 fatty acids were enhanced in ovine fat groups. The differences
268
found for monounsaturated fatty acids (MUFA) were related to the
269
dietary fat origin, being consistently higher in palm oil groups,
270
with and without CLA. Yet, the incorporation of 18:1 fatty acid
271
was affected by both CLA and fat origin effects in separate, being
272
higher in ovine fat diets.
273
The sum of PUFA and specificallyn ! 6fatty acids, was not
af-274
fected by CLA, fat origin or their respective interaction. However,
275
then ! 3sum was influenced by the fat origin. Regarding the CLA
276
isomeric profile, major differences were observed between the four
277
dietary groups. The sum of CLA isomers increased by CLA mixture
278
supplementation and was higher in diets based on animal fat.
How-279
ever, isomeric incorporation in adipose membranes was distinct.
280
The t10,c12 isomer was detected only by CLA supplementation,
281
while c9,t11 deposition was influenced by both CLA and fat origin
282
and was significantly larger in both fat based diets.
283
3.3. CLA decreases permeability and fluidity of adipose membrane
284
vesicles
285
For water transport experiments, vesicles in isotonic buffer
286
were subjected to a hyperosmotic gradient with mannitol, as
de-287
picted inFig. 2A.Fig. 2B shows a typical trace where a glycerol
gra-288
dient was imposed. Fast vesicle shrinkage due to water outflow
289
(first part of the trace) is followed by vesicle reswelling; as glycerol
290
enters due to its chemical gradient, vesicles progressively swell
un-291
til they reach equilibrium. The time courses of vesicle volume
292
changes are used to calculate Pfand Pgly.
293
Fig. 3shows the water and glycerol permeability coefficients
ob-294
tained at 23"C for the various membrane preparations (for each
295
group, n= 8). Average Pf±SEM were (1.88±0.113, 1.59±0.260,
296
2.08±0.080 and 1.75±0.080) " 10!3cm s!1 for P, PCLA, O and 297
OCLA groups, respectively. For the same groups, Pgly±SEM were
298
(4.77±0.274, 4.16±0.275, 5.22±0.183 and 4.43±0.348) "
299
10!7cm s!1. A significant CLA effect was detected for both perme-300
abilities as dietary groups with CLA presented lower values in
rela-301
tion to their counterparts (P< 0.01forPfand P< 0.05forPgly).
302
The activation energy values (Ea) for water and glycerol
trans-303
port were similar among dietary groups, ranging from 24.4±0.36
304
to 24.9±0.35 kcal mol!1 (102.1±1.51 to 104.1±1.46 kJ mol!1)
Hg Ves
Hg Ves
Ves
48 kDa
GLUT4
AQP7
35 kDa
23 kDa
Caveolin-1
20 kDa
Caveolin-2
A
B
Fig. 1. (A) GLUT4 and caveolin proteins in the initial fat tissue homogenate (Hg, lane 1) and in the final adipose membrane vesicles (Ves, lane 2) (10lg protein). (B) AQP7 in the final adipose membrane vesicles (Ves, 50lg protein).
305 for glycerol and from 14.7±0.24 to 15.1±0.23 kcal mol!1 306 (61.5±0.98 to 63.2±1.96 kJ mol!1) for water. Neither CLA nor fat 307 origin had any effect on Eaof water and glycerol transport. These
308 relative high Eavalues suggest alipid-ratherthan a
channel-med-309 iated pathway for both transports. While selective water channels
310 have not been described in adipose membranes, the AQP7 glycerol
311 channel was found in adipose tissue from mice[6]. In our study, we
312
also detected AQP7 in adipose membranes, although in a residual
313
amount. This low level of AQP7 channel expression or
incorpora-314
tion in the plasma membrane may be responsible for the observed
315
high Eavalue for glycerol permeation, indicating that glycerol
per-316
meates the membrane mainly by passive diffusion through the
li-317
pid bilayer and that the channel pathway is unimportant.
Down-318
regulation of the AQP7 gene in adipose tissue of obese individuals
y
nsit
y
Inte
n
nits)ght
I
ry und l
ig
bitra rter
ed
(ar bScat
t
S
Time (s)
B
A
Fig. 2. Representative stopped flow light scatter of adipose membrane vesicles permeability to water and glycerol at 23"C. (A) Vesicle shrinkage due to water outflow after an hyperosmotic shock with 120 mOsM mannitol gradient. (B) Fast shrinkage followed by vesicle reswelling due to glycerol uptake after an inwardly directed 180 mOsM glycerol gradient.
Table 1
Cholesterol content (mg/g vesicles) and fatty acid (% of total FAME) profile of membrane vesicles from the dietary treatments tested.
Dietary treatments Significance level
P PCLA O OCLA SEM CLA Fat CLA " Fat
Cholesterol content 0.044 0.040 0.027 0.036 0.004 ns * ns
Fatty acid profile
14:0 0.867b 1.05a 1.02a 1.07a 0.033 ** * * 15:0 0.114 0.140 0.237 0.247 0.010 ns *** ns 16:0 23.6 24.1 18.7 18.8 0.380 ns *** ns 16:1 0.564 0.657 0.693 0.698 0.027 ns ** ns 16:1c9 4.39 4.81 4.05 3.81 0.197 ns ** ns 17:0 0.300 0.357 0.644 0.659 0.029 ns *** ns 18:0 10.9b 10.1b 13.4a 14.9a 0.451 ns *** * 18:1 3.46 3.94 5.42 5.84 0.075 *** *** ns 18:1c9 28.5 26.4 24.1 22.9 0.868 ns ** ns 18:2n ! 6 11.4 11.9 12.2 12.1 0.247 ns * ns CLA-c9t11 0.273 1.15 1.59 2.35 0.063 *** *** ns CLA-t10c12 n.d. 0.369 n.d. 0.439 0.028 *** ns ns RCLA tt n.d. 0.178 0.049 0.226 0.016 *** ** ns 18:3n ! 3 0.113 0.109 0.343 0.294 0.022 ns *** ns 20:0 0.293 0.305 0.409 0.376 0.040 ns * ns 20:1n ! 9 0.233 0.187 0.146 0.109 0.007 *** *** ns 20:3n ! 6 0.536 0.508 0.597 0.498 0.037 ns ns ns 20:4n ! 6 6.84 7.12 7.71 7.09 0.693 ns ns ns 20:5n ! 3 n.d. 0.062 0.142 0.160 0.014 ** *** ns 21:0 0.672 0.730 0.953 0.916 0.117 ns ns ns 23:0 0.344 0.143 0.187 0.157 0.055 * ns ns 22:4n ! 6 0.930 0.848 0.811 0.621 0.100 ns ns ns 22:5n ! 3 0.096c 0.109bcb,c 0.362a 0.215b 0.029 * *** ** 22:6n ! 3 0.119 0.073 0.208 0.180 0.024 ns *** ns RUnidentified 5.51 4.74 5.99 5.42 0.397 ns ns ns RSFA 37.0 36.9 35.5 37.1 0.424 ns ns ns RMUFA 37.2 36.0 34.5 33.4 1.06 ns * ns RPUFA 20.0 20.7 22.4 21.1 0.911 ns ns ns RCLAs 0.273 1.70 1.64 3.01 0.080 *** *** ns Rn ! 3 0.328 0.352 1.05 0.849 0.061 ns *** ns Rn ! 6 19.7 20.4 21.4 20.3 0.874 ns ns ns
Dietary treatments: P = palm oil diet; PCLA = palm oil diet + 1 % of conjugated linoleic acid; O = ovine fat diet; OCLA = ovine fat diet + 1 % of conjugated linoleic acid. n.d. = not detected. Significance level: ns, not significant, P > 0.05;*P< 0.05;**P< 0.01;***P< 0.001.a–cMean values within the same row with different superscript letters are significantly
different (Tukey’s post-hoc test, P < 0.05). FAME = fatty acid methyl esters.RSFA, saturated fatty acids = sum of 14:0, 15:0, 16:0, 17:0, 18:0, 20:0, 21:0 and 23:0;RMUFA, monounsaturated fatty acids = sum of 16:1,16:1c9, 18:1, 18:1c9 and 20:1n ! 9;RPUFA, polyunsaturated fatty acids = sum of 18:2n ! 6, 18:3n ! 3, 20:3n ! 6, 20:4n ! 6, 20:5n ! 3, 22:4n ! 6, 22:5n ! 3 and 22:6n ! 3;RCLA = sum of CLA-c9,t11, CLA-t10,c12 and CLAtt;Rn ! 3 = sum of 18:3n ! 3, 20:5n ! 3, 22:5n ! 3 and 22:6n ! 3;R n ! 6 = sum of 18:2n ! 6, 20:3n ! 6, 20:4n ! 6 and 22:4n ! 6.
319 has been reported and correlated with the susceptibility to obesity
320 of obese high fat consumers[17]. To confirm the lipid bilayer as the
321 main pathway for water and glycerol permeation, adipose
mem-322 brane vesicles were pre-incubated with HgCl2, a known inhibitor
323 of aquaporin function[18], before permeability assays. Results of
324 Pfor Pglydid not change after HgCl2treatment (P P0.05; Fig. 4),
325 suggesting a non-channel mediated water and glycerol transport.
326 The relative changes in fluorescence anisotropy of DPH and
327 TMA–DPHin membrane vesicles from each dietary treatment are
328
shown inFig. 3. With both fluorescence probes, a significant
in-329
crease in the viscosity was observed for groups with CLA. Being
vis-330
cosity inversely related to fluidity, adipose membrane vesicles from
331
dietary groups with CLA are therefore less fluid than without CLA,
332
regardless the fat origin. The membrane rigidification effect
associ-333
ated with CLA supplementation is evident and significant at both
334
membrane depths probed by the two different fluorophores used.
335
4. Discussion
336
The human health effects of CLA, including the potential to
337
reduce body fat mass, became the subject of widespread research
338
for nearly three decades. Still, its efficiency remains controversial
339
[19]. Depending on the country, estimation of CLA daily intake
340
varies from 15 to 1000 mg[20]thus representing a large range of
341
consumption values. It has been suggested that a consumption of
342
0.8–3.0g CLA per day might provide significant health benefits
343
[21], a dosage that in most cases is only achievable through diet
344
supplementation. Besides being the dosage most commonly used
345
in animal research, 1% CLA is meant to mimic nutritional
supple-346
ment use.
347
We thought it should be interesting to look at CLA
supplemen-348
tation effects on adipose membranes obtained from visceral fat of
349
obese Zucker rats. These animals were fed atherogenic and
350
saturated fat diets with distinct origins, vegetable (palm oil) and
351
animal (ovine fat), and the effectiveness of CLA isomers
incorpora-352
tion, the changes of adipose membrane lipid profile and its
out-353
come on fluidity and permeability were assessed in plasma
354
membrane vesicles from visceral adipose tissue. The membrane
355
vesicles obtained herein were homogeneous and enriched in the
356
adipocyte plasma membrane fraction, showed to be osmotically
357
responsive and therefore suitable for transport experiments.
358
The increase in cholesterol content of a membrane in the liquid
359
disordered state leads to a decrease in its fluidity. On biomembrane
0.0 1.0 2.0 3.0 4.0 5.0 6.0 P PCLA O OCLA Pf Control Pf + HgCl2 PglyControl Pgly+ HgCl2
P
fx
10
3and
P
glyx
10
7(c
m
s
-1)
Fig. 4. Permeabilities of water and glycerol at 23"C in adipose membrane vesicles from dietary groups (P = palm oil; PCLA = palm oil + 1% conjugated linoleic acid; O = ovine fat; OCLA = ovine fat + 1% conjugated linoleic acid) before and after HgCl2
treatments. Values are mean ± SEM. No significant effects were detected between control and HgCl2treatments (P > 0.05).
Fig. 3. Permeabilities of water (A) and glycerol (B) at 23"C, and fluorescence anisotropy of DPH (C) and TMA-DPH (D) in adipose membrane vesicles from dietary groups (P = palm oil; PCLA = palm oil + 1% conjugated linoleic acid; O = ovine fat; OCLA = ovine fat + 1% conjugated linoleic acid). Values are mean ± SEM.*Significant CLA effect
360 model systems of certain lipid compositions and on different cell
361 membranes, cholesterol leads to the formation of lipid rafts,
micro-362 domains on the liquid ordered state[22]with decreased fluidity
363 that are enriched in cholesterol, sphingolipids and specific proteins
364 [23]. The lipid profile analysis of adipose membranes from the
dis-365 tinct dietary groups has shown that, despite cholesterol content
366 had been influenced by the fat origin, CLA supplementation did
367 not affect cholesterol membrane incorporation. In a similar way,
368 the deposition of SFA, MUFA and PUFA n ! 3 fatty acids were
369 dependent on the fat origin, not presenting any relation to CLA
370 supplementation. As for total PUFA, their total incorporation was
371 not affected by the fat origin or by CLA supplementation. It is
372 known that incorporation of unsaturated fatty acids into cellular
373 membranes increases its fluidity. PUFA acyl chains are extremely
374 flexible and can rapidly change conformational states. The acyl
375 chain flexibility differs substantially betweenn ! 3andn ! 6fatty
376 acids and the number of double bonds significantly alters
mem-377 brane fluidity. In fact, membrane incorporation of
eicosapentae-378 noic acid EPA (20:5n ! 3) and docosahexaenoic acid DHA
379 (22:6n ! 3), to which numerous health effects have been
attrib-380 uted[24], was significantly dependent on the dietary fat, whereby
381 the effect of CLA was almost negligible. This fact excludes the
de-382 crease in DHA or EPA content as responsible for the decrease in
adi-383 pose membrane fluidity observed in this study, supporting the idea
384 that changes at the fluidity level should be accounted to CLA
sup-385 plementation rather than to dietary fat. Accordingly, permeability
386 values were consistently lower in adipose membranes when obese
387 Zucker rats were fed CLA, not showing any dependence on the
die-388 tary fat origin. Given that the activation energy for both water and
389 glycerol transports was high and relatively stable in all cases,
indi-390 cating that permeation occurs via the lipid bilayer, the decrease in
391 permeability correlates well with the decrease in membrane
fluid-392 ity which seems to be caused by CLA incorporation into membrane
393 phospholipids. Despite the same concentration of both CLA
iso-394 mers in the oil mixture, the c9,t11, which is the natural occurring
395 isomer in ruminant fat, was detected in a larger amount than the
396 t10,c12 in all dietary groups, independently of dietary fat. This
re-397 sult per se might suggest that c9,t11 isomer could be accountable
398 for the changes in the membrane properties reported here.
How-399 ever, given that changes in permeability and fluidity are only
ob-400 served for CLA supplemented groups and do not depend on the
401 fat origin, the c9,t11 isomer can be discarded since its
concentra-402 tion is much higher in ovine than in vegetable fat. Therefore, the
403 t10,c12 isomer may be suggested as the most probable membrane
404 component affecting adipose plasma membrane fluidity and
per-405 meability. Interestingly, this CLA isomer is the one with suggested
406 body fat lowering properties in several animal studies[19].
407 In conclusion, this study suggests that CLA supplementation in
408 obese Zucker rats fed saturated fat and cholesterol rich diets,
409 through its incorporation in membrane phospholipids, has an
ef-410 fect on the fluidity of adipose membranes by increasing
mem-411 brane rigidity both at the centre of the bilayer (hydrocarbon
412 core) and at a shallow position, closer to the water/lipid interface.
413 This effect could be explained by the geometric structure of the
414 t10,c12 CLA isomer, where a considerable bending in the fatty
415 acid chain induces a decrease in the average chain length that,
416 similarly to cholesterol, may affect lipid packing within cellular
417 membranes. This isomer and particularly its conformation may
418 promote the formation of other type of raft-like structure,
differ-419 ent from the cholesterol and sphingolipids rich microdomains,
420 contributing to the experimentally observed decrease on the
421 average membrane fluidity and permeability of the system.
Con-422 sequently, our results do not point out to membrane fluidification
423 as a possible mechanism supporting CLA effect as a body reducing
424 agent in obese fat consumers.
425
Acknowledgments
426
This study was supported by FCT grants PTDC/CVT/2006/66114
427
andPTDC/CVT/2008/99210.We wish thank PharmaNutrients Inc.
428
(Gurnee, IL, USA). We acknowledge Rui Bessa and Susana Alves
429
(L-INIA-REQUIMTE) for fatty acid analysis, Pedro Matos and Teresa
430
Freitas (IMM, FMUL) for assistance in fluidity measurements, and
431
Marta Camps (IRB, Spain) for support in immunoassays.
432
References
433 [1] K.F. Adams, A. Schatzkin, T.B. Harris, V. Kipnis, T. Mouw, R. Ballard-Barbash, A.
434 Hollenbeck, M.F. Leitzmann, Overweight, obesity, and mortality in a large
435 prospective cohort of persons 50–71 years old, N. Engl. J. Med. 355 (2006) 763–
436 778.
437 [2] J.A.M. Prates, R.B. Bessa, Trans and n ! 3 fatty acids, in: L.M.L. Nollet, F. Toldrá
438 (Eds.), Handbook of Muscle Food Analysis, CRC Press, New York, 2009, pp. 399–
439 417.
440 [3] C.J. Field, P.D. Schley, Evidence for potential mechanisms for the effect of
441 conjugated linoleic acid on tumor metabolism and immune function: lessons
442 from n ! 3 fatty acids, Am. J. Clin. Nutr. 79 (2004) 1190S–1198S.
443 [4] G. Soveral, A.P. Martins, S.V. Martins, P.A. Lopes, C.M. Alfaia, J.A. Prates, T.F.
444 Moura, Effect of dietary conjugated linoleic acid isomers on water and glycerol
445 permeability of kidney membranes, Biochem. Biophys. Res. Commun. 383
446 (2009) 108–112.
447 [5] W. Stillwell, S.R. Wassall, Docosahexaenoic acid: membrane properties of a
448 unique fatty acid, Chem. Phys. Lipids 126 (2003) 1–27.
449 [6] K. Kishida, H. Kuriyama, T. Funahashi, I. Shimomura, S. Kihara, N. Ouchi, M.
450 Nishida, H. Nishizawa, M. Matsuda, M. Takahashi, K. Hotta, T. Nakamura, S.
451 Yamashita, Y. Tochino, Y. Matsuzawa, Aquaporin adipose, a putative glycerol
452 channel in adipocytes, J. Biol. Chem. 275 (2000) 20896–20902.
453 [7] S.V. Martins, P.A. Lopes, C.M. Alfaia, P.O. Rodrigues, S.P. Alves, R.M. Pinto, M.F.
454 Castro, R.J. Bessa, J.A. Prates, Serum adipokine profile and fatty acid
455 composition of adipose tissues are affected by conjugated linoleic acid and
456 saturated fat diets in obese Zucker rats, Br. J. Nutr. 103 (2010) 869–878.
457 [8] M.M. Bradford, A rapid and sensitive method for the quantitation of microgram
458 quantities of protein utilizing the principle of protein-dye binding, Anal.
459 Biochem. 72 (1976) 248–254.
460 [9] W.W. Christie, G. Dobson, R.O. Adlof, A practical guide to the isolation, analysis
461 and identification of conjugated linoleic acid, Lipids 42 (2007) 1073–1084.
462 [10] E.D. Naeemi, N. Ahmad, T.K. Al-Sharrah, M. Behbahani, Rapid and simple
463 method for determination of cholesterol in processed food, J. AOAC Int. 78
464 (1995) 1522–1525.
465 [11] M.P. van Heeswijk, C.H. van Os, Osmotic water permeabilities of brush border
466 and basolateral membrane vesicles from rat renal cortex and small intestine, J.
467 Membr. Biol. 92 (1986) 183–193.
468 [12] J.A. Dix, D.A. Ausiello, C.Y. Jung, A.S. Verkman, Target analysis studies of red
469 cell water and urea transport, Biochim. Biophys. Acta 821 (1985) 243–252.
470 [13] E. Pebay-Peyroula, E.J. Dufourc, A.G. Szabo, Location of diphenyl-hexatriene
471 and trimethylammonium-diphenyl-hexatriene in
dipalmitoylphosphati-472 dylcholine bilayers by neutron diffraction, Biophys. Chem. 53 (1994) 45–56.
473 [14] Z.J. Huang, R.P. Haugland, Partition coefficients of fluorescent probes with
474 phospholipid membranes, Biochem. Biophys. Res. Commun. 181 (1991) 166–
475 171.
476 [15] J.R. Lakowicz, Principles of fluorescence spectroscopy, Kluwer Academic/
477 Plenum, New York, 1999.
478 [16] K.V. Kandror, J.M. Stephens, P.F. Pilch, Expression and compartmentalization of
479 caveolin in adipose cells: coordinate regulation with and structural
480 segregation from GLUT4, J. Cell. Biol. 129 (1995) 999–1006.
481 [17] M.P. Marrades, F.I. Milagro, J.A. Martinez, M.J. Moreno-Aliaga, Differential
482 expression of aquaporin 7 in adipose tissue of lean and obese high fat
483 consumers, Biochem. Biophys. Res. Commun. 339 (2006) 785–789.
484 [18] R.I. Macey, R.E. Farmer, Inhibition of water and solute permeability in human
485 red cells, Biochim. Biophys. Acta 211 (1970) 104–106.
486 [19] Y. Park, M.W. Pariza, Mechanisms of body fat modulation by conjugated
487 linoleic acid, Food Res. Int. 40 (2007) 311–323.
488 [20] S.V. Martins, P.A. Lopes, C.M. Alfaia, V.S. Ribeiro, T.V. Guerreiro, C.M. Fontes,
489 M.F. Castro, G. Soveral, J.A. Prates, Contents of conjugated linoleic acid isomers
490 in ruminant-derived foods and estimation of their contribution to daily intake
491 in Portugal, Br. J. Nutr. (2007) 1–8.
492 [21] F.C.J. Parrish, B.R. Wiegand, D.C. Beitz, D.U. Ahn, M. Du, A.H. Trenkle, Use of
493 dietary CLA to improve composition and quality of animal-derived foods, in:
494 J.L. Sébédio, W.W. Christie, R. Adlof (Eds.), Advances in Conjugated Linoleic
495 Acid Research, AOCS Press, Champaign, IL, 2003, pp. 189–217.
496 [22] D. Marsh, Cholesterol-induced fluid membrane domains: a compendium of
497 lipid-raft ternary phase diagrams, Biochim. Biophys. Acta 1788 (2009) 2114–
498 2123.
499 [23] D. Lingwood, K. Simons, Lipid rafts as a membrane-organizing principle,
500 Science 327 (2010) 46–50.
501 [24] J.J. Li, C.J. Huang, D. Xie, Anti-obesity effects of conjugated linoleic acid,
502 docosahexaenoic acid, and eicosapentaenoic acid, Mol. Nutr. Food Res. 52
503 (2008) 631–645.