FACULDADE DE CIÊNCIAS DO
M
AR E DOA
MBIENTEMaster’s Thesis in Marine Biology: Specialization in Marine Biotechnology
Nuno Manuel Cardoso Domingues
Faro, October 2007
GENE
EXPRESSION
DURING
OOGENESIS
IN
THE
iii
UNIVERSIDADE DO ALGARVE
FACULDADE DE CIÊNCIAS DO MAR E DO AMBIENTE
C
ENTRO DEC
IÊNCIAS DOM
ARL
ABORATÓRIO DEE
NDOCRINOLOGIAM
OLECULARC
OMPARADAMaster’s thesis in Marine Biology: Specialization in Marine Biotechnology
Supervisor: Professor Doctor Adelino Canário Co-supervisor: Doctor Laurence Deloffre
Nuno Manuel Cardoso Domingues
Faro, October 2007
GENE
EXPRESSION
DURING
OOGENESIS
IN
THE
ii
‘ Ao procrastinador…
contra a procrastinação… ’
iii
ACKNOWLEDGEMENTS
Ao Professor Adelino Canário pela oportunidade, por ceder as instalações e material do laboratório de endocrinologia molecular comparada. À Laurence, por me introduzir ao trabalho em biologia molecular. À Olinda por fornecer as fêmeas, por me ter ajudado sempre que preciso e estar sempre lá. Obrigado. Aproveito para agradecer também à Mar e ao Peter que me foram ajudando e emprestando o material de dissecção mais delicado. A todas as pessoas do laboratório de Endocrinologia Molecular Comparade, as que foram ajudando e as outras que foram boa companhia. À Rute pela boa vontade em dar dicas e ajudar no que era preciso, mesmo estando sempre a fazer alguma coisa. À Isabel pela mesma razão. À Rita e ao João pela ajuda e boa vontade para ajudar. Às pessoas do laboratório de Biologia Molecular da FERN. Nádia e Rita pela ajuda na histologia, à Ângela pelos primeiros socorros, ao Xoan pelo apoio e ao Christophe pelo Bouin. Aos amigos por estarem lá nos bons e nos maus momentos. À Andrea, ao Tiago, ao Alejandro e à Joana. Á minha família. Pai, Mãe, João, avós… porque a família quer queiramos quer não, é quem está sempre lá para nós. E vocês estiveram lá. E devo-vos tudo por me terem financiado esta etapa da vida.
iv
ABSTRACT
Tilapias show a variety of physiological adaptations that allow them to live in different environmental conditions, disturbing local ecosystems where they are introduced by human hand, where they reproduce at faster rates as their cycles are short and constant. They have complex behaviours, with species in the Oreochromis and Sarotherodon genus exhibiting parental care. Thus, they have become a preferred research species. Knowledge on their physiology might benefit the medical sciences, the fisheries industry, environmentsl sciences and aquaculture, which is still the major player in sex genes research, as tilapias fish are the second most cultured species worldwide and there are problems with their high spawning rates as these originate high density stocks in tanks. There is considerable information concerning the hypothalamus-pituitary-gonadal axis in vertebrates, with gonadotrophins (FSH and LH) playing stimulating roles in development of the ovary and maturation of oocytes. Other hormones and factors are involved, mediating the actions of these or as products of their induction. The early stages of development of the ovarian follicle and the enveloped oocytes are still poorly described, with FSH being considered the first inducer for decades. This implies a role for local factors that are regulating the early stages of growth. Recently, TGF-β family member activin has been shown to induce FSH incorporation by the follicles and other members of this family also seem to have an important role in the ovary, such as BMPs and GDFs. Some other factors were studied in this thesis for expression patterns throughout oocyte development. With this objective, ovaries from 8 females were extracted and dissected under a binocular amplifier with groups of oocytes in 4 different stages being collected for each. RNA was extracted and purified and turned into cDNA by reverse transcription. Genes with preferential expression in ovary (determined by subtractive hybridization and then with semi-quantitative RT-PCR) were tested by RT-PCR in oocytes and band intensity was quantified using Quantity One from Biorad, using as reference 18S rRNA. These genes include FoxL2, CYP19a, Vasa, RBMX, BMP-R IB, CPI-17, Aly and other unidentified fragments: SART, PPMP (homolog sequences but not confirmed) and XP2 (putative new protein) and clone 26 (no homolog sequence known). Results show significant differences among the 4 oocyte stages for practically every gene tested, except for Aly and SART. Correlations among some of the genes also show they might have related functions in the process.
v
RESUMO
As tilápias possuem uma grande variedade de adaptações fisiológicas que lhes permitem resistir a diferentes condições ambientais, tendo-se tornado invasoras por introdução pelo Homem, como consequência dos seus ciclos reprodutivos mais rápidos e constantes, que perturbam os ecossistemas locais. Estes factores e os seus hábitos comportamentais como o cuidar dos ovos e juvenis até estes estarem mais aptos à sobrevivência tornam-nas alvos de estudo intensivo. Este tipo de pesquisa pode beneficiar a medicina, as ciências ambientais, a indústria pesqueira e a aquacultura, sendo esta última a área que actualmente mais se dedica à investigação de genes envolvidos em processos fisiológicos reprodutivos em teleósteos. Dos problemas que se encontram na cultura de tilápias salientam-se as elevadas taxas de reprodução que criam stocks demasiado densos nos tanques, e os maiores problemas surgem com as fêmeas, pois para além de crescerem menos, a fisiologia e regulação do ovário ainda tem muito por descobrir. Sabe-se que a nível endócrino o eixo hipotálamo-pituitária-gónada regula o desenvolvimento através de gonadotropinas (FSH e LH), que têm papéis chave na formação do folículo que envolve os óocitos e na maturação destes. Outras hormonas têm já efeitos conhecidos, mas examinando o início do processo percebe-se que tem de haver factores locais a controlar o desenvolvimento. A activina, um membro da família TGF-β mostrou ser responsável pela indução da incorporação de FSH no folículo, e outros membros desta família parecem desempenhar um papel de relevo na regulação do ovário, como BMPs e GDFs. Nesta tese pretendeu-se identificar a actividade destes factores putativos ao longo da oogénese. Para isso foram extraídos ovários a 8 fêmeas, sendo estes dissecados de modo a separar 4 estádios de desenvolvimento dos oócitos. O RNA foi extraído, purificado e construiu-se o cDNA para cada 4 dos tecidos de cada fêmea. Por hibridização subtractiva e posteriormente por RT-PCR semi-quantitativo determinaram-se que genes testar, escolhendo-se os que tinham expressão preferencial no ovário. Esses genes foram então testados por sua vez com RT-PCR aos oócitos das várias fêmeas, e a sua expressão quantificada com o software Quantity One da Biorad, usando o RNA ribossomal 18S como referência. Genes testados incluem: FoxL2, CYP19a, Vasa, RBMX, BMP-R IB, CPI-17, Aly e outros fragmentos não identificados: SART, PPMP (sequência homóloga mas não comprovada), XP2 (uma possível nova proteína) e o clone 26, este último sem homologia com nenhuma outra sequência conhecida. Os resultados obtidos sugerem uma expressão distinta ao longo dos diferentes estados de crescimento dos oócitos para praticamente todos os genes, excepto o Aly e o SART. Correlações entre genes mostram que alguns deles podem ter funções relacionadas.
vi
ABBREVIATIONS
ALK ANOVA ATP BMP BMP-R Bp BPES cAMP Cdc cDNA CPI-17 CTP CYP19a CYP19b d DEPC DNA dNTPs DP DPX E2 EGF EV FoxL2 FSH GDF GH GHRH GnRH GTH GTP GVBD hnRNPG HSD IGF INT IP3 ISI kDa LV M Mg MgCl2 MIH M-MLV MPF mRNAActivin-like receptor kinase Analysis of variance
Adenosine triphosphate Bone morphogenetic protein
Bone morphogenetic protein receptor Base pairs
Blepharophimosis/ptosis/epicanthus inversus syndrome Cyclic adenosine monophosphate
Cell division cycle Complementary DNA Protein phosphatase inhibitor Cytidine triphosphate
Ovarian type aromatase gene Brain type aromatase gene Deoxy
Diethylpyrocarbonate Deoxyribonucleic Acid
Deoxynucleotides triphosphates Dihydroxy progesterone
Histology mountant resin 17β-estradiol
Epithelial growth factor Early vitellogenic
Forkhead family transcription factor Follicle stimulating hormone
Growth differentiation factor Growth hormone
Growth hormone releasing hormone Gonadotropin releasing hormone Gonadotropin
Deoxyguanine triphosphate Germinal vesicle breakdown
Heteronuclear ribonuclear protein G Hydroxysteroid dehydrogenase Insulin-like growth factor Intensity Inositol triphosphate Interspawing interval KiloDalton Late vitellogenic Mature Magnesium Magnesium Chloride
Maturation inducing hormone Moloney Murine Leukemia Virus Maturation promoting factor Messenger RNA
vii NaCl nMIH-R OO P P450 PACAP PCR PGC PIS PKC PO POF PP RACE-PCR RBMX RBMY rDNAse RNA RT-PCR SL SSH T TGF-β Thr TL TTP UTR VE VTG VTG-R Sodium chloride
Nuclear maturation inducing hormone receptor Oogonia
Progesterone
Cytochrome P450 family of enzymes
Pituitary adenylate cyclase-activating polypeptide Polymerase chain reaction
Primordial germ cells Pooled intersex syndrome Protein kinase C
Primary oocytes
Premature ovarian failure Protein phosphatase
Rapid amplification of cDNA ends PCR
Ribonuclear export factor in the X chromosome Ribonuclear export factor in the Y chromosome RNAse free DNAse
Ribonucleic acid
Reverse transcriptase PCR Standard length
Supression subtractive hybridization Testosterone
Transforming growth factor β Thrionine Total length Tymidine triphosphate Untranslated region Vitellin envelope Vitellogenin Vitellogenin receptor
viii
1. Introduction... 1
1.1. Tilapia biology and value ... 2
1.1.1. Importance ... 3
1.2. Ovarian recrudescence in teleosts ... 5
1.2.1. Oogenesis... 5
1.3. Endocrine mechanisms of regulation ... 9
1.3.1. The hypothalamus-pituitary-gonadal axis... 9
1.3.2. Molecular endocrinology of the ovary... 12
1.4. Objectives... 15
2. Material and Methods ... 16
2.1. Biological material and sampling ... 16
2.2. Histology ... 18
2.3. RNA extraction and cDNA synthesis ... 18
2.4. Semi-Quantitative RT-PCR ... 19
2.4.1. Statistical analysis... 22
3. Results ... 23
3.1. Histology ... 23
3.2. Sexual dimorphic expression... 24
3.3. Patterns of expression throughout oocyte growth... 25
3.3.1. Vasa ... 26 3.3.2. FoxL2... 26 3.3.3. CYP19a... 27 3.3.4. RBMX... 28 3.3.5. ALY Protein... 28 3.3.6. BMP-R IB ... 29 3.3.7. CPI-17... 30
3.3.8. SART and PPMP protein ... 31
3.3.9. XP2 and clone 26... 31
ix
5. Conclusions and Final considerations ... 43 6. Bibliographic references... 44 7. Annexes ...I 7.1. Annex I... II 7.2. Annex II ...IV 7.3. Annex III...VI 7.4. Annex IV ... VII 7.5. Annex V...VIII 7.6. Annex VI ...XI 7.7. Annex VII ... XII 7.8. Annex VIII...XIII 7.9. Annex IX ... XIV
1
1. INTRODUCTION
The processes regulating ovarian development are still largely unknown, particularly for teleosts. The majority of the data concerns mammals, with emphasis on the human ovary. During the last decade however, teleosts fish, which represent 95% of all vertebrate species (Redding and Patiño 2000a), have become important research subjects in the field of endocrinology (particularly salmonids), as they have a diversity of physiological adaptations to various habitats, offering virtually every conceivable type of ovarian physiology and providing exploitable material for the understanding of mechanisms regulating ovarian recrudescence (Wallace and Selman 1981). Reproduction strategies include oviparity, ovoviviparity and viparity, with some of the species exhibiting parental care, as is the case of tilapias. Studies tend to focus on species of economic value, as is the case of some species of tilapia. Tilapiine fish have become the second most cultivated species worldwide, as a result of their ease of culture, tolerance to poor water quality and extreme conditions. Females receive extra attention from researchers because it is harder to maintain captive females. The problems involving the culture of tilapias consist in some intolerance to some physical properties of water and reproduction difficulties of females, with ovarian cycles restarting immediately after the last ovulation and lasting for different periods of time. To overcome these problems of female reproduction cycles it is necessary a deeper understanding of the functioning of the ovary and how its developmental processes are being regulated. On a general basis this type of research is contributing for the increased knowledge of the vertebrate ovary and that of teleosts. With molecular and cellular biology it is now possible to study physiology at the transcription level, a fact that led to an explosive growth in the discipline of endocrinology, with several more messenger molecules being identified through mRNA analysis of transcribed genes in the various tissues. The present thesis is aimed at identifying the factors that may be involved in regulatory processes during ovarian recrudescence of a tilapiine fish, the Mozambique tilapia (Oreochromis mossambicus, fig. 1).
2
1.1.
T
ILAPIA BIOLOGY AND VALUECichlid fishes have received wide attention from evolutionary biologists for more than 100 years because of their extremely diverse morphology, behaviour, and ecology (Klett and Meyer 2002). This perciform fish family is one of the most species-rich families of vertebrates with at least 1,300 and perhaps as many as 1,870 species (Katagiri, et al. 2005; Klett and Meyer 2002). Of these, more than 70 are
Fig.1 – A female Mozambique tilapia (Oreochromis
mossambicus) was the species used for this study.
Illustration by Gunther Schmida in Mackenzie, et al. 2001.
referred to as tilapia, a generic term used to designate a group of commercially important food fish that exhibit a wide spectrum of ecological adaptations and tolerances (pH, temperature, salinity, oxygen tension, overcrowding) (De Silva, et al. 2004). They are multi-spawning fish, with reproductive cycles in average 15-20 days (Coward and Bromage 2000). Their enormous adaptability to the most diverse environments reveals their potential as a cultured species, as well as explaining why they have become invaders of so many other habitats where they didn’t belong, by human introduction (Bwanika, et al. 2004). The Mozambique tilapia
(Oreochromis mossambicus) was the first to be dispersed, but its precocious maturity and tendency to overpopulate make them not as suitable for culture as other tilapia species (Lim and Webster 2006). O. mossambicus breeds throughout the year in equatorial waters, with peaks
usually in the rain season. They are maternal mouthbrooders, like all fishes in the Oreochromis genus. The males construct nests in firm sand, where the females leave their gametes to be fertilized by male sperm, and after females collect the eggs into their mouth where they will remain even after hatching, until the fry don’t need their care. Females have asynchronous ovaries, being multiple spawners with variable interspawning intervals (Coward and Bromage 2000), the ovary regenerates quickly but not at constant rates and egg size may vary between populations of the same species (Tyler and Sumpter 2004). Their fecundities vary with size and they grow 20 to 60% less than males. Tilapias are therefore fascinating creatures to study physiological adaptations.
3
1.1.1. IMPORTANCE
Knowledge of ovarian follicle growth in teleosts may provide information not only for basic research, but also in biomedical sciences, fisheries management, environmental science and aquaculture. In the environmental sciences knowledge on the effects of endocrine disruptors on ovary function may provide a way to detect pollutants in waters. Endocrine disruptors disturb hormone actions, having effects on a variety of organisms sensitive to the disruptor. For medicine, discovery of new functions of genes like FoxL2, a gene from the forkhead family of transcription factors, may provide insights into diseases like premature ovarian failure (POF) (Pisarska, et al. 2004; Wang, et al. 2004), blepharophimosis/ptosis/epicanthus inversus syndrome or BPES (Baron, et al. 2004; Ottolenghi, et al. 2005; Pannetier, et al. 2006; Uhlenhaut and Treier 2006) and pooled intersex syndrome in goat (PIS) (Ottolenghi et al. 2005; Uhlenhaut and Treier 2006; Wang, et al. 2007), which are caused by mutations in this gene. It may also help on the fertility control area (Lerch, et al. 2007). In fisheries, information on ovary and reproduction may one day provide solutions for reproduction alternatives for increasing the declining fish stocks around the world. But the main area of interest in sex related genes comes from aquaculture. Manipulation of sexual phenotypes and selection of desired sex-linked traits like size, growth rate or egg production, are already well underway (Bwanika et al. 2004; Charo-Karisa, et al. 2006; Hassanien and Gilbey 2005; Hulata 2001; Katagiri et al. 2005; Pechsiri and Yakupitiyage 2005; Shirak, et al. 2006), but solutions to the problems involving sexual cycles of tilapias are still lacking. This is a species whose culture will continue to grow, and they are already among the most cultivated fish worldwide. They are second only to Carp which account for 75% of total global aquaculture (De Silva et al. 2004; Lim and Webster 2006; Muir and Young 1998), particularly the genus Oreochromis spp.. Native to African rivers, several species have been introduced to tropical areas of Asia and the Americas to increase supplies of animal protein (Lee, et al. 2005). World aquaculture production of tilapia now exceeds 1.5 million tons per year as shown in figure 2 (De Silva et al. 2004; Katagiri et al. 2005; Lee et al. 2005) (Fig. 2).
4
Fig. 2 – Aquaculture production of tilapias worldwide. The majority of aquaculture production comes from Asia and
the major importer the USA; Europe is not a strong competitor with main importers being the United Kingdom, France, Belgium, Germany and the Netherlands, around big cities with large African and Asian communities (De Silva et al. 2004).
Tilapias have been successful as a cultured species group in the tropical countries due to: ease of culture (and thus relatively less limited by the economic status of the farmer), relevant species exhibiting many of the desirable traits expected of a species suitable for culture, like high growth rate, wide range of tolerance to physical-chemical characteristics (Hulata 2001; Pechsiri and Yakupitiyage 2005), exhibiting ecological adaptations and high tolerances (Hassanien and Gilbey 2005; Klett and Meyer 2002). They are also disease resistant, of easy propagation, having long shelf-life and lending themselves to industrial preparations better than most other white fish (De Silva et al. 2004; Pechsiri and Yakupitiyage 2005). In addition, most of the commonly cultured tilapias are easily weaned on to artificial feeds. Of them the most important cultured fish species is Oreochromis niloticus, known as the Nile tilapia, its hybrids (Charo-Karisa et al. 2006), the Mozambique tilapia and the blue tilapia (O. aureus) (Coward and Bromage 2000; De Silva et al. 2004). The ability to easily adapt to a variety of different environments makes tilapia a good model to study physiological adaptations (Lee et al. 2005), besides the prominent role in aquaculture. All said, research on physiology of tilapia is focused on defining the developmental organization and mechanisms of the female gonad (Redding and Patiño 2000a). Although the majority of these studies focus on the Nile tilapia, the Mozambique tilapia is quite similar in most aspects and is also a good model.
5
1.2. O
VARIAN RECRUDESCENCE IN TELEOSTSOvarian recrudescence can be described as a gathering of all the following processes, and although they normally occur somewhat in this order, it is not a rule: oogonial proliferation, oogenesis, folliculogenesis (formation of the ovarian follicle), cortical alveolar formation, vitellogenesis, final maturation of oocytes and ovulation (Coward and Bromage 2000; Patiño and Sullivan 2002; Tyler and Sumpter 2004; Wallace and Selman 1990). These processes will likely not happen in this specific order, particularly in fish like tilapia. Instead, some of these phases will overlap at the ovary but also oocyte level (Coward and Bromage 2000). In tilapia, the ovaries contain always every stage of oocyte growth, and as soon as they ovulate, there will be oogonia ready to start meiosis, as well as other stages of oocytes that will be included in the ovarian cycle at a later time. Oogenesis is complemented with folliculogenesis, as the basic structure of the ovarian follicle is established when granulosa cells and the membrane adjacent to them (theca) envelop oocytes at its late pachytene or early diplotene stages during their first meiotic step. So the two processes should actually be seen as one, as there will be exchanges between the follicle and oocytes that will be regulating the growth of the latter (Ravaglia and Maggese 2003). However, this study was done at the oocyte level, so we will focus on oogenesis, but not discarding the important role of the follicle.
1.2.1. OOGENESIS
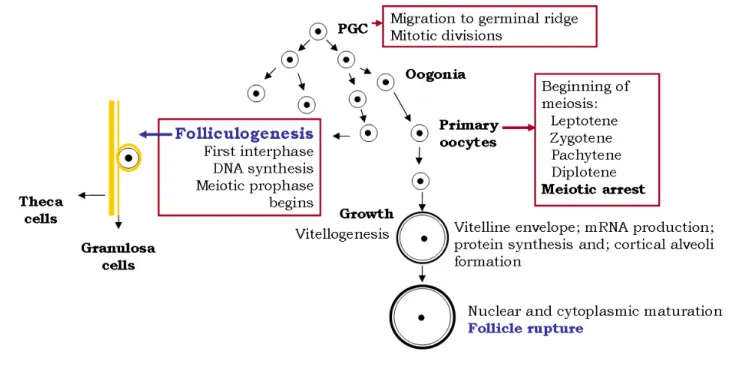
Oogenesis (fig. 3) is the process by which primordial germ cells (PGC) develop into ready to be fertilized oocytes during two meiotic divisions with meiotic arrests in between (Patiño and Sullivan 2002). Others tend to designate oogenesis only as the early development of primary oocytes (Wallace and Selman 1990), after which the follicle envelopes the oocytes. This shows the tremendous ambiguity in the designation of the several stages of this process and of the whole process of recrudescence of the ovary in teleosts. This division is sometimes based on developmental stages, but in others is more complex, when used to study physiological and cellular processes, and to show the inconsistency of such classifications, these can be even taxon-specific. So, depending on the area the researcher is working, there will be differently limited steps describing the whole ovarian development and the majority of literature these days takes into account the ovarian development from a follicle point of view, as the oocyte starts to grow significantly with the onset of folliculogenesis. Crudely, we can identify a pre-vitellogenic stage
6 that precedes a vitellogenic phase when vitellogenins (VTGs) start to be incorporated by the oocytes, and a final oocyte maturation stage in a post-vitellogenic phase, after which the mature oocytes are ready to be released and fertilized.
Fig. 3 – Oogenesis and follicle envelopment of oocytes. Primordial germ cells (PGC) migrate to germinal ridge and
go through mitotic divisions differentiating into oogonia. Oogonia stay in interphase until beginning of meiosis (primary oocytes). The oocytes start to be enveloped by follicular cells until the latter is completely differentiated and at the end of pachytene phase, early diplotene, meiosis is arrested. During this arrest VTGs are incorporated by the oocytes which grow considerably. At this time there is also much mRNA being produced and proteins being formed. Finally meiosis is resumed when the nucleus matures and finally the cytoplasm matures with yolk globules fusing and germinal vesicle breakdown (GVBD) (Adapted from Abascal and Medina 2005; Coward and Bromage 2000; Goetz and Garczynski 1997; Patiño and Sullivan 2002; Wallace and Selman 1981 and Wallace and Selman 1990).
1.2.1.1. PRE-VITELLOGENIC GROWTH AND ONSET OF FOLLICULOGENESIS
Little is known about the mechanisms that control pre-vitellogenic stages of oocyte growth, not only in teleosts but in vertebrates in general. This phase is characterized by the formation of PGC (primordial germ cells) and after occurs the sex differentiation and they become oogonia instead of spermatozoids, determined by the maternal genome (Patiño and Sullivan 2002). There are some putative genes responsible for this differentiation, but a sex
7 determining gene is not yet known, the process being probably a product of the action of various genes. The next step is the transformation of oogonia into oocytes and the meiotic division starts (Patiño and Sullivan 2002). Primary oocyte growth features intense transcriptional activity and the formation of yolk vesicles (Abascal and Medina 2005; Wallace and Selman 1981), being this the first gonadotropin-dependent stage. These vesicles are precursors to the cortical alveoli and will be filled only in the vitellogenic phase with VTGs. Cortical alveoli will be filled with glycoproteins in mid to late vitellogenic growth (Patiño and Sullivan 2002). It’s also at this point, at its late pachytene, early diplotene (Prophase I) that the ovarian follicle restarts to develop (Abascal and Medina 2005). At the end of diplotene phase meiosis is arrested until final maturation of the oocyte (Hammes 2004; Huertas 2006).
Folliculogenesis is considered to be a continuous process (Findlay, et al. 2002), starting
when granulosa cells envelope the oocytes, which in turn are enveloped by theca cells. These suffer a number of modifications along the process, as they first become cuboidal then cylindrical (Francolini, et al. 2003) and oocyte cytoplasm organelles and volume increase (Patiño and Sullivan 2002) by around one order of magnitude. Following oocyte envelopment, the cortical alveoli appear, with the Golgi apparatus of oocytes having an important role during their formation (Abascal and Medina 2005). Microvilli start to form in the middle of this phase at the oocyte surface directed to the granulosa cells, and a vitelline envelope is formed from the oocyte end of the microvillar structures, and as the follicle grows, oocytes and follicle become connected, allowing communication between them. Granulosa cells are responsible for mechanical support of the oocyte, besides mediating signals between the oocyte and the outer theca cells. The follicle will be working together with the oocytes until release of the mature oocytes (Lerch et al. 2007).
During previtellogenic growth large quantities of ribosomal and heterogeneous RNA are produced by nucleoli located at the periphery of the nucleus, being much of the mRNA produced done so during this stage (like VTG receptor and VTG processing enzyme), declining during vitellogenesis as they are translated into proteins that will incorporate VTG from the blood stream (Wallace and Selman 1981), passing to another phase of the development.
8
1.2.1.2. VITELLOGENIC GROWTH
Vitellogenic growth happens when VTGs (yolk proteins) start to be incorporated by the oocytes, being this the phase when the significant growth of the oocyte occurs. These VTGs are synthesized in the liver, being stimulated by hormones like 17-β estradiol and others (endocrines described in next section), by receptor mediated endocytosis (Coward and Bromage 2000). Their hepatic production starts with signalling from the hypothalamus-pituitary-gonad neuroendocrine axis stimulated by both endogenous and exogenous cues. When VTGs reach the ovary they enter the follicle through the capillaries located in the thecal cells membrane, then through the membrane separating theca and granulosa cells and finally through pore canals of the vitelline envelope that surround the microvillar structures until it reaches the oocytes and binds to VTG receptors (VTG-R), being finally incorporated by the oocytes. Inside they are still cleaved into yolk proteins in the vesicles formed during the previtellogenic stage, in the periphery of the inner oocyte membrane, where they will remain stored for feeding the embryo once the oocyte is fertilized. VTG-R mRNA hits a peak at the end of the previtellogenic stage and declines during vitellogenesis, suggesting the receptors are taken back to the surface for incorporation of more VTGs.
1.2.1.3. POST-VITELLOGENIC GROWTH (FINAL OOCYTE MATURATION,
FOLLICLE RUPTURE AND OVULATION)
The process of ovulation is described as the release of a mature oocyte from the follicle and maturation represents the final stage in the oocyte development (Wallace and Selman 1981). However, several preparatory steps take place before the oocyte release (Goetz and Garczynski 1997), including the resumption of the first meiotic step (Cardinali, et al. 2004), fusing of yolk globules, disruption of the microvillar structures that connect the oocyte to the follicle (rupture of the follicle by proteases). At this time the nucleus is mature (as meiosis first step is resumed) and finally the cytoplasm, occurring water uptake in many teleosts (Huertas 2006; Nagahama, et al. 1993) for oocyte hydration and the volume of the oocyte grows even more. Before ovulation there is a new meiotic arrest in metaphase II (Hammes 2004). In tilapia, when the oocyte is finally released is covered by a thin acellular envelope that is formed during the follicle development (Francolini et al. 2003), the vitelline envelope (VE), constituted by a thin outer layer and a thick inner layer. The inner layer is fibrous, striated and primarily composed of 3-4 subunits derived from VE precursor proteins, the ‘choriogenins’. The outer layer is rich in
9 polysaccharides (Patiño and Sullivan 2002). The VE acts as a mediator between the embryo and the environment and may have a role in fertilization (Ravaglia and Maggese 2003). When the egg is fertilized, it induces completion of the second meiotic division and expulsion of the second polar body (Patiño and Sullivan 2002). The endocrine regulation of this and the previous stages will be described in the following section.
1.3. E
NDOCRINE MECHANISMS OF REGULATIONThe endocrine system is mainly responsible for chemical communication between cells via a chemical messenger (Janz 2000), coordinating several physiological processes such as development, growth, homeostasis, energy availability, behaviour and reproduction. It works side by side with the nervous system, even sharing intracellular signalling pathways, the involvement of the immune system and neuroendocrine mechanisms. These systems are responsible for the regulation of all physiological phenomena, and knowledge on it may provide solutions for problems in the most diverse areas. There are four major categories of messenger molecules: amines, steroids, lipids and peptides. Here we will focus on peptide hormones. Exploring the tissues where hormones are expressed or released and their function reveals where and why these mechanisms are taking place. Hormones work by connecting to receptors in the target tissues, existing four mechanisms by which hormones signal the consequent molecules of a pathway. In one of these the receptor is inserted in the plasma membrane and requires coupling to enzymes via the G proteins (guanine nucleotide binding proteins) and a second messenger is catalyzed, like with TGF-β members. Another type sees the receptor itself possessing enzymatic activity, from the moment of hormone binding. Others form ion channels that open or close upon binding of hormone and a final type of receptor binds directly to the DNA, working as a transcription factor once the hormone binds (nuclear receptors), used by most steroid hormones.
1.3.1. THE HYPOTHALAMUS-PITUITARY-GONADAL AXIS
There is more than one type of GnRH (gonadotopin-releasing hormone) among fish, with these exhibiting several patterns of distribution. However, it is generally accepted that the neurosecretory nuclei of the hypothalamus segregates GnRH at the preoptic and anterior part of the brain, having an important role in reproduction (Bentley 1998; Redding and Patiño 2000b), as
10 these will stimulate the release of gonadotropins by the pituitary. The latter is composed of two parts, the adenohypophysis and the neurohypophysis. Unlike the majority of vertebrates vascular communication among these two is practically non-existent (Redding and Patiño 2000b). In the adenohypophysis specialized cells (gonadotrops) produce the two gonadotropins, but a single GTH may occur in some species. These cells’ activity is regulated by stimulating and inhibiting factors, being the major stimulus by the hypothalamus synthesized GnRH. FHS and LH will be transported in the blood stream until it reaches the gonad, at different periods of its development. FSH seems to be mainly responsible for early gonadal development and vitellogenesis in females. LH levels are low until the period of final oocyte maturation (Feist and Schreck 1996). The adenohypophysis also produces thyroid-stimulating hormones, prolactin family (includes prolactin, growth hormone and somatolactin), adrenocorticotropin and melanotropin. Prolactins have been shown to have effects in reproduction in some species, and thyroid hormones (T3 and T4 segregated from thyroid by thyroid-stimulating hormone) have been shown to be incorporated by tilapia oocytes (Tagawa and Brown 2001; Tagawa, et al. 2000).
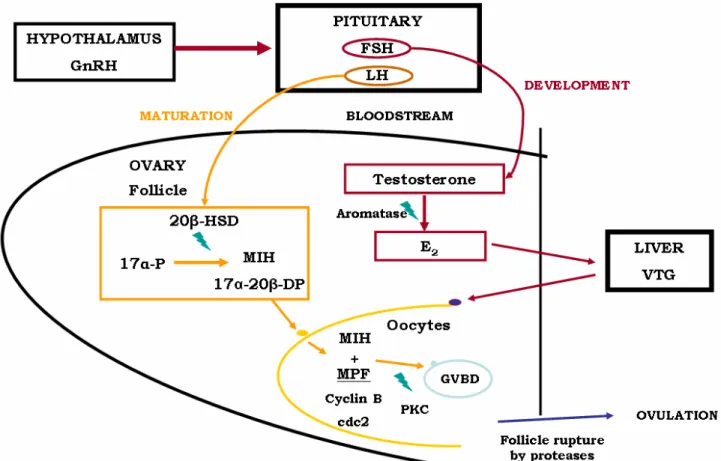
Fig. 4 - Schematics of pathways of the hypothalamus-pituitary-gonadal axis in teleosts described through section
11
1.3.1.1. HYPOTHALAMUS AND PITUITARY HORMONES
At the hypothalamus level, 3 types of hormones are probably involved in reproduction control: the already mentioned GnRH, GHRH (growth hormone-releasing hormone or somatocrinin) and PACAP (pituitary adenylate cyclase activating polypeptide). The first has as target the pituitary and the latter two have been shown to be expressed in several tissues like brain, stomach, heart, testes and ovary, but are differently expressed along tissues of different species. PACAP has been found also at the pituitary and heart of gold fish (Carassius auratus). GHRH acts at the anterior pituitary cells to release GH. GnRH can be found usually in two or more forms in each species. Its gene codes also for an associated peptide (GAP) and a signal for processing the preprohormone peptide. GAP function remains unknown.
In the pituitary, the GH can be stimulated or inhibited. Stimulus is caused by GHRH, GnRH, dopamine, thyrotropin-releasin hormone, neuropeptide Y (NPY) and cholecystokinin. Inhibition happens with somatostatin (somatotropin-release inhibiting factor or SRIF), IGFs (insulin-like growth factors), GH, glutamate, norepinephrine and serotonin. GH promotes somatic growth in fish. When GH is released it promotes transcription and release of insulin-like growth factors (IGF I and IGF II) in several tissues (Kajimura 2004). FSH and LH are released from the pituitary when GnRH binds to the respective receptors on the gonadotrops outer membrane and they will act mainly at the gonads level. In females GTHs target is the follicle, acting on the granulosa and the thecal cells that surround the oocyte, but not the oocyte itself. FSH-R binds both GTHs (but mainly FSH) and LH-R binds specifically LH. The first is found in both types of follicle cells but the second only in granulosa cells. These receptors are G-protein-coupled, stimulating adenylyl cyclase and cAMP in both gonads (Gill and Hammes 2007). But other signalling mechanisms are necessary in this signalling process, including IP3 production,
increases in intracellular calcium, protein kinase C activity and arachidonic acid metabolites (Pati and Habibi 2002).
1.3.1.2. OVARY HORMONES
Action of GTHs is not straightforward, being mediated by steroids (Nagahama et al. 1993) produced at the follicle cells (Redding and Patiño 2000a; Rocha and Reis-Henriques 1998). In response to FSH that enters these cells mediated by receptors, follicle thecal cells produce and release testosterone (T), one of the main sex steroids working in fish reproduction cycles. T
12 diffuses to the granulosa cells and is converted into 17β-estradiol (E2) by aromatase from the
cytochrome P450 family of enzymes. This family is the main responsible for the biosynthetic pathways in fish, regulating production of sex steroids. These latter are fused ring structures derived from cholesterol by the ‘side chain cleavage’ of cholesterol by enzyme P450scc.
Progesterones also have an important role, with 17α,20β-DP being the most well known oocyte maturation inducer, responsible for further follicle rupture with ready to be fertilized oocytes’ release. IGF-I expression has been found in ovaries among other tissues, and IGF-II is expressed during vitellogenesis. Its main role is to mediate GH effects, but gonadal IGFs found in granulosa and thecal cells (Kajimura, et al. 2003; Schmid, et al. 1999; Zhou, et al. 2005) also stimulate steroidogenesis and may have some role in ovary growth prior to maturation (Zhou et al. 2005). Regulation of the whole ovarian recrudescence process will be described in the next section. Other identified regulators that not yet have a defined function include, epidermal growth factor (EGF) receptors in the follicles, probably involved in the production of steroids and prostaglandins and other peptides like insulin, prolactin and GH.
1.3.2. MOLECULAR ENDOCRINOLOGY OF THE OVARY
Regulation of previtellogenic growth of the ovary remains largely unknown. The basis of endocrine mechanisms in the female gonad is described from the point when the follicle starts to grow significantly and to produce FSH-induced testosterone and the ovarian regulation by the hypothalamus and pituitary (Juengel and McNatty 2005). In the oocytes, FSH stimulates the synthesis of the yolk vesicles (Wallace and Selman 1981). Testosterone will be catalyzed into 17β-estradiol (E2) by aromatase P450 at the follicle. E2 will be transported to the liver where it
will stimulate hepatic segregation of VTGs (refs) and also of oocyte membrane proteins (Nagahama et al, 1993). These will be transported back to the ovary where it is selectively incorporated in the oocytes in a process mediated by receptors. Prior to maturation, E2 levels
decline and maturation-inducing hormone (MIH) levels rise, due to possible dramatic changes in expression of their genes (Nagahama et al. 1993). It is unclear how this sudden change in the steroidogenic pathway occurs, but it may be that GTHs downregulates aromatase activity and upregulates the enzyme that will catalyze the specific MIH, 20β-hydroxysteroid dehydrogenase or 20β-HSD (Senthilkumaran, et al. 2002; Zhou et al. 2005). MIH is progesterone in all vertebrates, but not in fish where it is 17α-20β-dihydroxy 4-pregnen-3-one (Nagahama et al.
13 1993), or 17α,20β,21-trihydroxy-4-pregnen-3-one (Rocha and Reis-Henriques 1998). The 17α-20β-DP MIH is formed from 17α-P (synthesized by 20β-HSD) in theca cells by LH stimulation (Senthilkumaran et al. 2002), and then diffuses to the granulosa cells, where is in contact with the oocyte surface. Early studies in tilapia suggest deoxycortisone to be their MIH (Coward and Bromage 2000). MIH binds to receptors at the surface of the oocyte membrane and a maturation promoting factor (MPF) is formed, which will mediate MIH (Bentley 1998). This is achieved by the stimulating action of MIH on cell division cycle (Cdc25) phosphatase, an enzyme that dephosphorylates some of the aminoacid residues of MPF, activating it (Bhattacharya, et al. 2007). In carp it has been isolated a MPF consisting of two components, a homolog of the cdc2+ gene of yeast (p34cdc2) and cyclin B. A cdc2 kinase protein is the catalytic component, present in both mature and immature oocytes and cyclin B (the regulatory component) only found in mature ones. Cyclin B has been shown to possess a crucial role in 17α-20β-DP-induced oocyte maturation (Bhattacharya et al. 2007; Nagahama et al. 1993; Rocha and Reis-Henriques 1998), being the regulatory component of the dimeric protein kinase complex MPF. MIH also releases oocytes from the meiotic arrest that happens at the end of Prophase I. GVBD is a final marker of oocyte maturation which is catalyzed by MIH (Bhattacharya et al. 2007; Goetz and Garczynski 1997) or GnRH (Cardinali et al. 2004) and thus affected by MPF (Bhattacharya et al. 2007). Finally, ovulation is considered to be some kind of inflammatory reaction, with possible regulators being eicosanoids, catecholamines, kinins, angiotensin, histamine (Goetz and Garczynski 1997), proteases and their inhibitors (Coward and Bromage 2000). Prostaglandins and progestational steroids may be necessary, as shown in some species like brook trout (Salvelinus fontinalis) and yellow perch (Perca flavescens), being synthesized by steroids and possibly involving follicle and extra-follicular tissue. Hormone-dependent ovulation requires protein kinase C (PKC) activation of MIH that will in turn bind to nuclear receptors (nMIH-R) and initiate transcription of ovulation inducers (fig.4).
Prior to folliculogenesis and during its early stages, there are not necessarily GTH dependent development processes. In these cases there are local factors being expressed (Drummond 2005; Pangas and Rajkovic 2006). In fact, for the follicle to respond to GTHs, it first needs to gain the capacity to incorporate them, meaning, a receptor and the postreceptor signal transduction systems. These factors and others have now a bigger chance of being discovered and what their function is with genetics and molecular and cellular biology techniques. One area of interest is the sex determining/differentiation genes like FoxL2 and others (Shirak et al. 2006). The other revolves around follicle growth and its regulations by various signalling factors. One of
14 the major families known is the TGF-β superfamily (Drummond 2005; Lerch et al. 2007), being one of its key members activin, responsible for early formation of the follicles (Jaatinen, et al. 2002). Activin (fig. 5) regulates FSH synthesis, potentiates its actions by increasing receptor expression in granulosa cells, is thus responsible for the formation of early follicles and is a model for a receptor system for other members of this family, like Growth Differentiation Factors (GDFs) (Juengel, et al. 2004; Knight and Glister 2003) and the Bone Morphogenetic Proteins (BMPs) (Drummond 2005; Findlay et al. 2002; Lerch et al. 2007).
Fig. 5 – Regulation of activin signalling (Source: Lerch et al. 2007). Activin signal via type I and II receptors,
propagating the signal in the pituitary intracellularly via Smads, which interacting with transcription factor Pitx2 (co-activator) stimulate FSH. The latter travels in the blood stream to the ovary and interacts with the granulosa cells of the follicle, binding to its receptor. FSH will then induce inhibin and follistatin, the later inhibiting locally activin, decreasing its activity. The dominant hormone becomes inhibin, which is sent in the blood stream to the pituitary, where it inhibits activin signalling.
For this thesis, the gene expression of some other putative factors obtained from a suppression subtractive hybridization was to be analysed. With that aim, some genes were tested
15 for mRNA expression throughout oogenesis: Vasa, FoxL2 and CYP19a as controls, BMP-R IB, RBMX, CPI-17, Aly protein and some others with unconfirmed identity (SART, PPMP protein, XP2 and clone 26).
1.4. O
BJECTIVESThe main objectives of this work were to analyse expression of factors participating on the regulation of the ovary of Oreochromis mossambicus, by mRNA expression analysis of several genes encoding for known molecules, some with a known function (at least partially) and others with possible roles in ovary maintenance, or for some obtained sequences that might represent new genes or alternative transcripts of the known ones, but not with any known function. The genes tested were obtained by suppressive subtractive hybridization. The expression patterns represent each gene’s expression throughout oocyte growth, revealing when they are most important in the process and suggesting an inference on which function they might execute. As further work the full sequences of these genes would be obtained by means of RACE-PCR.
16
2. MATERIAL AND METHODS
For the characterization of the expression patterns of the various genes studied, several methods of molecular biology were used, with bioinformatics being employed when necessary. These were employed in order to obtain RNA transcripts of each stage of oocyte development, to construct the respective cDNA for these tissues and quantify the expression of each of the genes in each stage for a total of 8 females used as replicates. Reagents used are described in annex I and cloning procedures for sequencing are detailed in annex V.
2.1. B
IOLOGICAL MATERIAL AND SAMPLINGFemales were selected from families maintained in 200 L fresh water aquariums at 27ºC, 12 hour photoperiod, constant oxygenation and sand on the bottom. There were 4 females and one male for each aquarium, which were fed daily with commercial cichlid ration. The eggs were collected from the female’s mouths and accounted for viable or unviable, to infer on each female’s fertility status. Inter-ovulation periods were monitored like this, becoming possible to infer on the relative time of the ovarian cycle at which the female would be at, and collect an ovary at a specific time of ovarian recrudescence. 8 females were killed and their ovary retrieved with lengths and weights registered, both for the fish and gonad, with gonadosomatic index (GSI) determined as in table 1 to give an idea on the healthiness of the ovary. The ovary was put into 0,9% NaCl until the end of dissection and oocyte separation. The oocytes were separated under a binocular microscope, into 4 different stages of oocyte growth: oogonia (OO), primary oocytes (PO), early vitellogenic oocytes (EV) and late vitellogenic oocytes or mature oocytes (LV/M), depending on the state of development of the follicles containing oocytes for each female. Each sample consisted in 80 to 100 cells, or more when cell size was too small like with oogonia, to ensure enough mRNA. Every oocyte collected was measured for smaller and larger diameter (fig. 6). The tissues were frozen in liquid nitrogen and put at -80ºC. Samples were also collected for histology, being kept in Bouin.
17
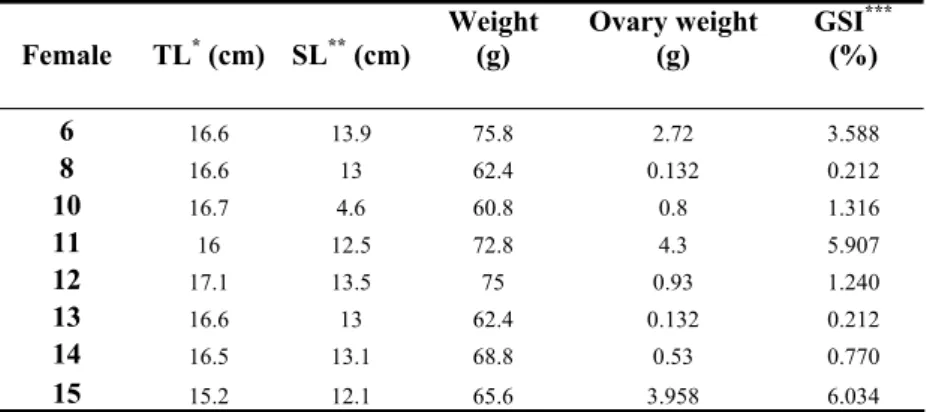
Table 1 – Lengths and weights for the 8 females used for RT-PCR, with condition factor GSI.
Female TL* (cm) SL** (cm) Weight (g) Ovary weight (g) GSI
*** (%) 6 16.6 13.9 75.8 2.72 3.588 8 16.6 13 62.4 0.132 0.212 10 16.7 4.6 60.8 0.8 1.316 11 16 12.5 72.8 4.3 5.907 12 17.1 13.5 75 0.93 1.240 13 16.6 13 62.4 0.132 0.212 14 16.5 13.1 68.8 0.53 0.770 15 15.2 12.1 65.6 3.958 6.034
*Total length; **Standard length; ***GSI = Ovary weight / Total weight.
Fig. 6 – a) Oocytes in 0,9%NaCl solution, during the oocyte collection under a binocular magnifier, with 1) oogonia,
2) primary oocytes, 3) early vitellogenic and 4) late vitellogenic or mature oocytes and b) diameters of oocytes for all females dissected (average for all oocytes in each group per female). F5, F6 and F7 were at the beginning of the reproductive cycle; F9, F10, F11 and F3 were at the middle of it and F1, F2, F4 and F8 were at end of the cycle. Kruskal-Wallis One Way ANOVA on ranks reveals a significant difference among stages (P ≤ 0,001) and Tukey’s test for comparison between groups show no significant differences for pairs SS-S; S-M and M-L for P < 0,05. The stages can therefore be considered significantly different from each others.
4 3 2 1 a) b)
18
2.2. H
ISTOLOGYTo identify and verify the stages of oocyte growth, the tissues were stained with haematoxilin-eosin coloration. The follicles were kept in Bouin for 10 days, processed in a Leica TP1020 overnight and they were then put into paraffin. The cuts performed were of 0,5 µm. The sections were first hydrated by immersion in xilol 2x during 15 minutes, then 5 minutes through graded ethanols (100%, 95% and 70%) and finally in distilled water. These sections were placed 30 seconds in haematoxylin before passing them on running water and then again in distilled water. Next they were immersed in Eosin for 30 seconds, followed by distilled water with a few drops of acetic acid. Finally the tissues were again dehydrated through graded ethanols (70, 95 and 100%) during 5 minutes each and then 2x 15 minutes in xilol. The preparations were mounted with DPX.
2.3. RNA
EXTRACTION AND CDNA
SYNTHESISRNAs are sensitive molecules that are easily degraded. To study tissue expression the RNA needs to be reverse-transcribed into the more stable molecule of cDNA by a specific enzyme that synthesizes double-stranded DNA, a reverse transcriptase. The RNA was extracted from the pools of 80-100 oocytes using Sigma’s TRI Reagent. The tissues were homogenised in 1 ml of TRI Reagent for a weight inferior to 100 mg. Samples were centrifuged at 13,400 rpm for 10 minutes at 4ºC. After they were left at room temperature for 5 minutes and 0,2 ml of chloroform were added to each tube, being then shaken vigorously for 15 seconds. Samples were left at room temperature for 15 minutes and then centrifuged at 13,400 rpm during 15 minutes at 4ºC. The colourless upper aqueous phase was transferred to a fresh tube and 0,5 ml of isopropanol was put into each one. Samples were left at -20ºC overnight to allow a more efficient RNA precipitation. Following this, the samples were centrifuged for 10 minutes at 13,400 rpm, 4ºC. The supernatant was then removed and the pellet formed washed with 1 ml of 75% ethanol. Samples were shaken and centrifuged at 7,600 rpm for 5 minutes at 4ºC. Finally the pellets were left to dry on ice and suspended on diethylpyrocarbonate-treated water (30 µl for less concentrated samples and 50 µl for more concentrated ones). Prior to cDNA synthesis the suspended RNA was treated with rDNAse I using Ambion’s DNA-free Kit, to ensure no genomic DNA contamination (annex IV). Taking into account a certain amount of RNA with concentration determined by directly observation of intensity in the agarose gel for each sample,
19 the quantities to be used in the reaction were chosen. To the volume of RNA used, up to 44 µl of DEPC-treated water were added, and then the final 6 µL for the total of 50 µl per sample consisted of 5 µl of rDNAse I Buffer and 1 µl of the enzyme rDNAse I. The samples remained 30 minutes at 37ºC, after which the DNAse was inhibited with 5 µl of the inactivator. After centrifuging the inactivator was discarded to retrieve the purified RNA. 3 µg of this purified RNA was used for the cDNA synthesis. For each sample, in a total volume of 40 µl, up to 29,6 µl were of suspended RNA in DEPC water and 10,4 µl of reagents mix, with volumes of RNA being chosen by determining the relative quantity (ng) in 1 µl of RNA by observation of the electrophoresis gel. The RNA would be put at 65ºC for 10 minutes to denaturate. The reagents mix prepared contained the final 10,4 µl of volume left to complete the reaction. These consisted of 8 µl of 5x RT Buffer, 1 µl of dNTPs at 10 mM each, 1 µl of random hexamers (pdN6) at 1 µg/µl, 0,2 µl of RNAse guard and finally 0,2 µl of the reverse trancriptase M-MLV from Promega (200 µg/µl). Before adding the reagents mix, the tubes were put into ice for 5 minutes and then briefly centrifuged. The reaction worked for 2 hours at 37ºC and the oocytes’ cDNAs were finally synthesized.
2.4. S
EMI-Q
UANTITATIVERT-PCR
PCR (Polymerase Chain Reaction) allows the amplification of a gene fragment exponentially, using a pair of specific primers for the fragment to be amplified and a DNA polymerase enzyme. These primers need to be designed from a known sequence, and one of them corresponds to the beginning of the sequence to be amplified, called the forward or sense primer, and the other one from the end of the sequence, that anneals with the complementary DNA strand (called the reverse or anti-sense primer). The PCR consists of a first step of denaturation, in which the two chains are split and the DNA becomes single stranded and the primers can now anneal to the complementary sequences. The step of annealing depends on the cDNA being used and the specificity of the primer, so the majority of the times it is needed an optimization of the PCR conditions to be employed. For this optimization there are essentially two factors that need to be played with. One is the annealing temperature, that although is indicated in the primer description of the manufacturer, it is not necessarily the right temperature to be used with our sample. The second factor is the concentration of magnesium (used here in the form of MgCl2 at
20 strands, so in principle if more Mg is added, the polymerase will bind the substrate more easily, and with the lost in specificity there may be more unwanted fragments amplified. If Mg quantities used are lower, the polymerase specificity to the DNA is higher, it becomes more sensitive, and there is a greater chance of obtaining the pretended fragment. This optimization step is mostly required when quantifying gene expression, as more than one fragment as the PCR product means a loss of primers that are binding to unwanted fragments. If this happens quantification will be biased. The third step is elongation, in which the polymerase synthesizes the new complementary strand for each of the obtained denatured strands. This three steps are then repeated the necessary amount of times for the product at least be visible on an agarose gel by electrophoresis. For this study it was also necessary to quantify the expression at the several stages of oocyte growth (by semi-quantitative PCR, as the quantification was done relatively, comparing the intensity of the products with a reference gene that should be expressed in all tissues equally for normalization – rRNA 18S).
Table 2 – List of primers used for RT-PCR and RACE-PCR, with conditions employed for eachset.
*BMP-R IB, RBMX, CPI-17, and Aly protein primers were at a concentration of 20 pmol / ml. All others were at 10 pmol / ml.
Gene Primer sequences Melting MgCl2
temperature (ºC) (mM) Nr of cycles
RT-PCR*
Vasa Fw 5'- GAT TTG GCA GAA CGG ATC ACA GTA -3'
Rv 5'- GTG GTT CTA GAG TAG CAT GAA CAG -3' 58 3 30
FoxL2 Fw 5'- GTT CCC AGT ATG AGC AGT GCA -3'
Rv 5'- GTG GGT GAG GCT ACA GGA TGT GTA -3' 59 3 28
CYP19a Fw 5’ - GGC ATA GGC ACA GCC AGC AA - 3’
Rv 5’- GGT CCA CTC GGA CAT ACC TCC T - 3’ 60 3 32
BMP-R IB Fw 5’- CTT GTT GAT TTC AGT CAC TGT ATG CA -3’
Rv 5’- CTC TCA GAT AAG TGC AGA GCC A -3’ 60 1,5 39
RBMX Fw 5’- GAG ACT ACT ATG ATT CAG GAA GTG TA -3’
Rv 5’- ATA ATC ATC CCT TCT GGA CAT CAT CG -3’ 57 3 32
SART Fw 5'- TCT GCA CAC TCA GAG ATG TTT CTA C -3'
Rv 5'-TTA TGA CAG GAG TAA GGC CAC TGT T -3' 58 3 30
PPMP protein Fw 5'- GTG GTA TTT TTT AGG TAT GGA TCT CAT -3'
Rv 5'- ACA CCT ACC TCT CTT ACC TCA AAC AC -3' 58 3 31
CPI-17 Fw 5’- ACA TTG ATG ATT TGC TCG ACC T -3’
Rv 5’- CTG ATT TTG CTC TTG GGT GTG GTG A -3’ 57 3 26
XP2 Fw 5'- GGC GCT ACG GAC ACT TCA AGC A -3'
Rv 5'-TGA TGT CAG AGC TTC GTG CTC TGT -3' 60 1,5 32
Clone 26 Fw 5'- AAG AGA ACC TAA CAC ACT CAT CCT AC -3'
Rv 5'- GTC TGA CTG CTG TCC TGT GTA TTC -3' 58 1,5 31
Aly protein Fw 5’- AGG AGG AAA CAG ACC CCA GC -3’
Rv 5’- GAG CGT CAT CCC ATC AGA GTC CT -3’ 58 3 29
RACE-PCR
CPI-17 Rv1 5'- TCA TCA ATG TTA ACC TCC TCT GGC AT -3'
Rv2 5'- GGC TGG ACG TGG AGA AGT GGA TCG -3' 57
21 Genes studied were obtained by suppression subtractive hybridization (SSH), comparing the relative difference in concentration of mRNA transcripts of genes tested in ovary and testes, with primers for these genes being done after sequencing of products of the SSH. The primers for the control genes Vasa, FoxL2 and CYP19a were designed from published sequences (GenBank) from Oreochromis mossambicus, or when not available, from Oreochromis niloticus. They were constructed using an online oligonucleotide properties calculator (http://www.basic.northwestern.edu/biotools/oligocalc.html) having in consideration that they should have a GC content of around 50% and an annealing temperature between 50º and 60ºC, with annealing temperatures for forward and reverse primers differing no more than 5ºC. The fragments to be amplified should have from 100 to 450 base pairs. These primers were tested for preferential expression in ovary rather than testis by RT-PCR, and when positive they were chosen as good candidates for having some particular role in oocyte growth. RT-PCR for each set of primers in oocytes was done using always the same quantities in a total of 10µl per tube using EuroTaq DNA polymerase. Taq DNA polymerase is a thermostable enzyme isolated from the bacteria Thermophilus aquaticus, with a molecular weight of 94 kDa. This enzyme synthesizes double-stranded DNA in the direction 5’-3’ in the presence of magnesium. Reagents and quantities used are described on fig. 7 and annex I. PCR optimization for some genes where more than one band could be detected was done by changing MgCl2 concentrations (1µl of MgCl2 is
3mM in total reaction volume of 25 µl) and annealing temperatures. These and the number of cycles used for amplification of each gene fragment can be seen on table 2. The optimization procedures also involved the determination of the adequate amount of cycles to be used in the PCR. Details of all these optimization procedures are described in annex II.
Fig. 7 – PCR mixture of reagents used for each set of primers. After the optimization procedures, the same PCR
procedure was used for all primers, only changing MgCl2 volumes in the mixture and the primers. The mix was done
in an eppendorf tube of 1,5 ml and concentrations were in a total of 25 µl: 1x Taq buffer, 1 to 3 mM MgCl2, dNTPs
22 The PCRs were all run in Biorad’s myCycler thermocycler and consisted of 4 minutes of initial denaturation at 94ºC, followed by cycles of 25 seconds of denaturation again at 94ºC, 25 s of annealing with temperatures depending of primers and 35 s of 72ºC elongation step. Products were stored at 4ºC until run on a 3% agarose gel by electrophoresis (electrophoresis procedure is described in annex III). The bands were quantified using Biorad’s Quantity One software, to obtain the expression patterns for each gene throughout oogenesis. For the quantification, the bands obtained couldn’t be saturated, hence the reason why the number of cycles had to be optimized, to obtain the exponential phase of a PCR, and not when it is saturated and immeasurable.
2.4.1. STATISTICAL ANALYSIS
Results are presented as the mean of all 8 female’s intensities of gene expression during each stage of follicle development ± standard error of the mean (se). To test whether the means among the different groups (OO, PO, EV and LV/M) were significantly different, it was used a One-Way Analysis of Variance (ANOVA) followed by multiple comparison procedures among groups, using Tukey’s Honestly Significant Difference test or Dunn’s method. When the test for normality of the distributions failed, or the test for equality of variance, it was used Kruskal-Wallis One-Way ANOVA on ranks followed by either Tukey’s or Dunn’ method for isolating the groups that differ from the others. Graphics were done using SigmaPlot and statistics using SigmaStat. Correlation between the expressions of the different genes was assessed using the Pearson Product Moment Correlation. Statistical significance was considered at the 5% level (P < 0,05).
23
3. RESULTS
Results are presented starting by a histological dye of haematoxylin-eosin to a tilapia ovary at mid of the reproductive cycle to show a representative view of the stages of development of each of the stages collected. Following this come RT-PCR results, both for the testing of sexual dimorphic expression of the genes analysed, and the semi-quantitative analysis in oocytes of 8 females. Finally the Pearson Product Moment Correlation matrix shows which genes display correlated levels of expression.
3.1. H
ISTOLOGYHaematoxylin is a base that colours acidic components of the cell (basophilic structures), with purple hue and alcohol-based acidic eosin, colours acidophilic (or basic) structures found in the cytoplasm bright pink. The basophilic structures are usually the ones containing nucleic acids (most abundant acidic components), such as the ribosomes, the cell nucleus, and the cytoplasmatic regions rich in RNA (Timm 2005).
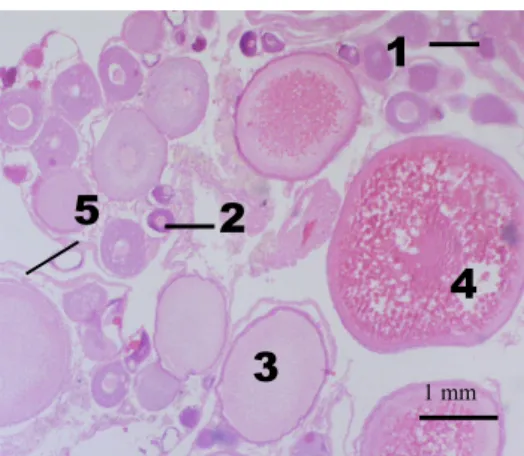
Fig. 8 – O. mossambicus ovary tissue dyed with haematoxylin-eosin. In the picture the numbers indicate the four
stages used for analysis of expression of the genes considered: oogonia (1), primary oocytes (2), early-vitellogenic oocytes (3) and late-vitellogenic or already mature oocytes (4). Mature oocytes are already free of the follicle envelope (5), being ready to be ovulated.
From the previous description, oogonia and primary oocytes (1 and 2 respectively) cytoplasm seems enriched with nucleic acids and the later stages (3 and 4) seem to have more basic structures. So the stages used according to histology present the following stage of development:
1
2
3
4
5
1 mm24 (1) Oogonia, stage prior to meiosis, differentiated from primordial germ cells where a great
amount of RNA seems to be distributed through the cytoplasm;
(2) Primary oocytes, with the onset of the first meiotic step also rich in mRNA already bigger in size;
(3) Early vitellogenic oocytes, with follicle layer (theca and granulosa cells) clearly surrounding the oocyte; the oocyte is bigger with vitellogenin being gathered and mRNA difunded through the cytoplasm. VTGs are still accumulating in vesicles; rich in organelles;
(4) Late-vitellogenic oocyte, with yolk globules already formed and fusing (maturation). No follicle layer is seen around the oocyte, so it is probably already mature and ready to be ovulated.
(5) Ovarian follicle, with outer theca cells and inner granulosa cells next to the oocyte.
3.2. S
EXUAL DIMORPHIC EXPRESSIONThese results show the prior determination of differential expression by RT-PCR of selected genes in ovary and testes (fig. 9). The reference used was 18S. Those genes with relative concentration was higher in ovary were selected for analysis of differential expression throughout oogenesis.
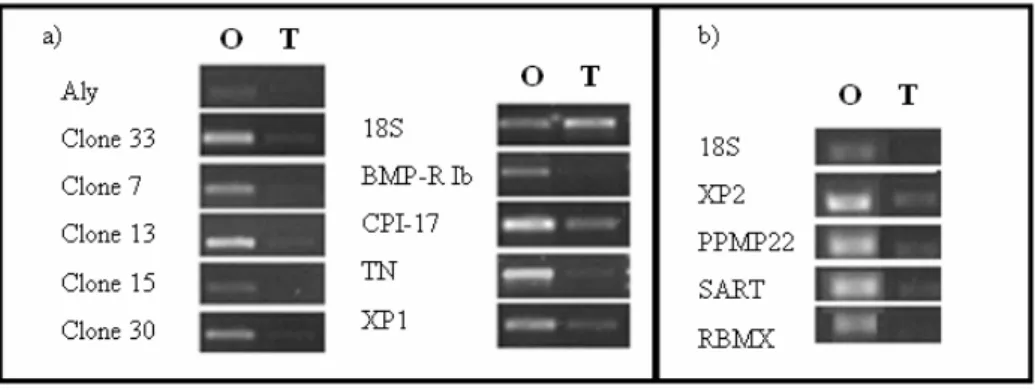
Fig. 9 – Each gene was tested for sexual dimorphism, using cDNA from testes and ovary, in 2 different RT-PCRs (a)
and (b). By looking at the bands’ intensities relatively to ribosomal 18S RNA we can determine the relative expression for each gene. Other genes Twist-Neighbour (TN), XP1 and clones seen show sexual dimorphism but were not tested through oocyte growth, except for TN, XP1 and clones 15 and 30 in a prior test to the actual experiment, which is described in annex VI.
25 The designation ‘clone’ indicates sequences with no homologs found. So they could be a new gene or an untranslated region (UTR). XP1 and 2 are hypothetical new proteins with unknown functions. PPMP22 and SART have a partial sequence homolog to these genes but aren’t necessarily so. The genes analysed revealed differential expression in ovary and testes. In addition FoxL2, Vasa and CYP19a were analysed to answer doubts concerning the use of rRNA 18S as the reference and to consolidate the reliability of the technique in use.
3.3. P
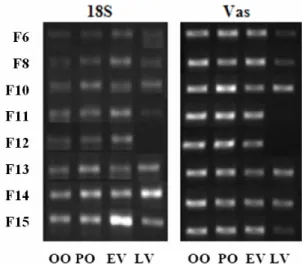
ATTERNS OF EXPRESSION THROUGHOUT OOCYTE GROWTHHighly expressed genes in ovary include BMP-R IB, CPI-17, Aly, XP2, PPMP22, SART and RBMX. Vasa served as a control gene, being a marker of germ cells and a probable good indicator of oocyte quantity, but literature seems to show also that it’s not expressed always in same quantities in all germ line cells, particularly in oocytes. Results using the 18S gene as the reference seem to be in accordance with patterns observed in previous works. Figure 10 shows an example of the gel electrophoresis where the PCR products were run for each gene. These bands were quantified; in this case the intensity obtained for the Vasa gene was divided by the intensity of the corresponding band for 18S. Electrophoresis migrations for the other genes tested can be seen in annex VII.
Fig. 10 - Bands obtained with the DNA electrophoresis to the PCR products of the RT-PCR for reference gene 18S
and one of the genes tested, Vasa. Each band corresponds to the intensity of expression in each stage of oocyte growth for the 8 females. These bands were quantified for intensity (INT), all in one same area. Quantification was made with Quantity-One and the intensity of the gene tested was divided by the one from 18S (Gene/18S), with intensities expressed in INT*mm2 and in the same areas that were only different for each gene, but the same for all
26
3.3.1. Vasa
Vasa is expressed only in germ line cells, thus it was considered using it as reference instead of 18S. However, literature seems to suggest a difference in vasa mRNA in different stages of oocytes. Its expression pattern shows a higher degree of expression during both previtellogenic stages tested.
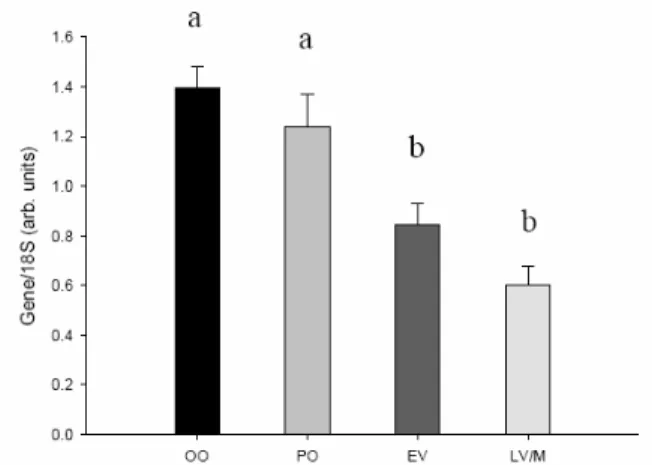
Fig. 11 – Vasa expression pattern during oocyte growth. The quantities are expressed in arbitrary units, being
obtained using 18S as a reference (Gene/18S), with each being measured as INT*mm2. The results represent
averages of each stage for all 8 females with standard errors (mean ± se). Statistical analysis was done with One Way ANOVA, showing a significant difference that the mean values among the treatment groups are greater than would be expected by chance (P <0.001). Tukey method of All Pairwise Multiple Comparison Procedures revealed similarities and differences among particular stages (P < 0,05). The characters on top of the bars, if identical, mean there is no significant difference among those stages.
Oogonia and primary oocytes revealed greater quantities of Vasa mRNA, showing no significant statistical difference (a). Early and late vitellogenic oocytes show a decrease in expression, and difference among these is not significant either (b).
3.3.2. FoxL2
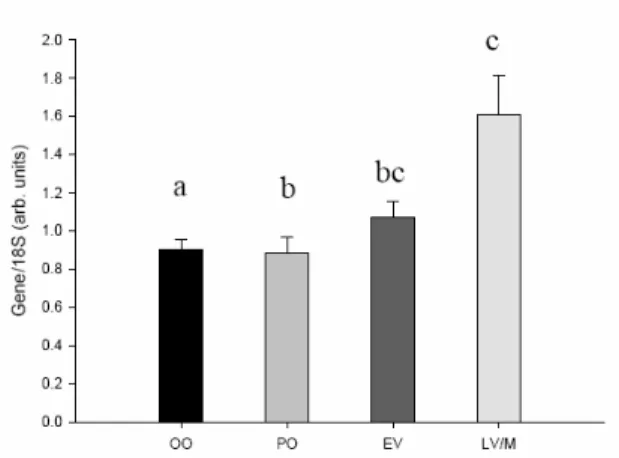
The putative transcription factor FoxL2 has never been detected in the oocytes, only in granulosa cells of the follicle. FoxL2 is the earliest known sexual dimorphic marker (Cocquet, et al. 2002; Pannetier et al. 2006). Here, expression was found in all stages of oocytes tested, with an increase towards the later stages.
27
Fig. 12 – FoxL2 expression increased throughout growth of the oocytes. Kruskal-Wallis One Way ANOVA on ranks
was carried, as the distributions failed the normality test. The groups showed a statistically significant difference (P = 0,005). Multiple comparisons were made with Dunn’s test, and differences between groups are indicated as above (P < 0,05). When 2 groups, like oogonia and primary oocytes in this case, don’t have any significant difference between means, they can’t be compared and thus aren’t tested. However, in these cases, expression is clear to be similar and thus doesn’t need to be made a comparison. In the following results the same can be apllied.
FoxL2 expression is clearly higher in later oocytes. If some kind of relationship could be established between this and the aromatase gene, and those results were in accordance with previous publications, it would be reinforced the use of 18S as the reference gene.
3.3.3. CYP19a
The gene that codes the last enzyme in the conversion of testosterone to 17β-estradiol is CYP19a. This gene is usually denominated tCYP19a, t for tilapia, a for designating the ovarian type of aromatase P450.
Fig. 13 – The coding gene for the aromatase enzyme, CYP19a (ovarian type) shows a rise in expression through the
process. Kruskal-Wallis One Way analysis of variance shows there is difference among the stages (P < 0,001). Dunn’s method for differences among group means is shown as previously (P < 0,05).
28 CYP19a expression is similar to the expression pattern for FoxL2, and previous works on these genes shows the latter to regulate transcription of aromP450. While this isn’t entirely new data, it may be a way of showing 18S might be used as the reference gene with a less significant error, as the results obtained here are similar to those obtained by others, with different and similar techniques.
3.3.4. RBMX
RBMX stands for RNA-binding motif on the X chromosome and is involved in splicing (it can also be called hnRNPG for heterogenous nuclear ribonucleoprotein). RBMX is also expressed in testes, but much more expressed in ovary. These results show a decrease in expression towards the end of oogenesis, in the vitellogenic stages of oocyte development.
Fig. 14 – RBMX showed a decrease in expression. Groups are significantly different (One Way ANOVA), P =
0,005. Tukey method shows some similarity among early and late vitellogenic oocytes, and also between the first and previtellogenic oocytes (P < 0,05).
3.3.5. ALYPROTEIN
This protein has a domain common to the Aly family (metazoans’ equivalent of the REF family in yeast), and shows a slightly higher expression in ovary than testes.
29
Fig. 15 – The Aly family protein didn’t show strong variation, but there is room for a putative role in the cell
machinery. Kruskal-Wallis One Way ANOVA showed no significant difference in means (P = 0,381).
The gene didn’t show a significant difference among group means and there is one Aly protein that has recently been attributed function as mRNA exporter from the nucleus.
3.3.6. BMP-R IB
The bone morphogenetic proteins receptor IB was tested, as it has a possible prominent role as shown by other TGF-β superfamily members.
Fig. 16 – Bone morphogenetic protein receptor, type IB expression. There was a significant difference among means,
revealed by Kruskal-Wallis One Way ANOVA (P < 0,001). Comparison’s between stages by Dunn’s method (P < 0,05) reveals similarity in both previtellogenic stages, and between primary oocytes and late vitellogenic oocytes.