EVALUATING THE PRIVATIZATION OF THE
PORTUGUESE NATIONAL AIRLINE - TAP
Jorge Miguel Valério e Cunha
PROJECT REPORT
Project submitted as partial requirement for the conferral of MSc in Finance
Supervisor:
Prof. Pedro Manuel de Sousa Leite Inácio, ISCTE Business School, Finance Department
i
Abstract
Portugal’s deficit economy during several years and the high levels of Public Debt culminated with the need of an External Financial Assistance Program. Regarding this program a privatization plan of several state-owned companies was developed, in which TAP Group was included.
The main activity of TAP Group is air passenger and cargo transport. It also provides services to third party customers in areas related to the Group’s core activities, such as Maintenance and Engineering services.
The Letter of Intent sent by Portuguese Government to International Monetary Fund (IMF), concerning the Portugal’s Financial Assistance Program, and the State Budget for 2015 refer the need to restart the process of TAP privatization. On November 13th of 2014, the Council of Ministers approved the re-privatization process of TAP.
Consequently, in order to sell TAP Group at its fair value, it is essential to perform a financial corporate valuation. This way, in the next pages, it will be developed a valuation of TAP, using three corporate valuation methods: Multiples (or Relative) Analysis, Discounted Cash Flow method, using the Free Cash Flow for the Firm approach and the Free Cash Flow for the Equity approach, and a valuation method used to valuing firms with regular negative earnings, which is the case of TAP Group.
Considering the negative TAP’s fair value estimated in all methods, Portuguese Government should simply transfer its capital and inherent obligations to the investors. However, TAP is valuable if it becomes more efficient, which is expected to occur in a privatization process.
JEL Classification: G32, L33
Keywords: Privatization, Corporate Valuation, Multiples Analysis, Discount Cash
ii
Resumo
Portugal perante uma situação de endividamento excessivo e de uma economia deficitária que perdurava há vários anos, solicitou um pedido de ajuda financeira externa. Neste pedido de ajuda externa foi estabelecido um programa de alienação de participações do Estado em empresas nacionais, sendo a TAP uma dessas empresas.
O Grupo TAP tem como principal atividade o transporte aéreo de passageiros e de carga, bem como um conjunto de serviços prestados a entidades terceiras em áreas ligadas aos negócios principais do Grupo.
Em novembro de 2014, foi deliberado em Conselho de Ministros o relançamento do processo de privatização do Grupo TAP.
De modo a que o Grupo TAP seja vendido pelo seu justo valor, é imprescindível realizar uma avaliação económico-financeira. Nas próximas páginas será realizada uma avaliação ao Grupo, utilizando três métodos: análise pelos Múltiplos, o método dos Fluxos de Caixa Descontados, quer na ótica dos Fluxos de Caixa Livres para a Empresa, quer na ótica dos Fluxos de Caixa Livres para os Acionistas, e, por último, um modelo de avaliação para empresas que apresentam sistematicamente resultados negativos, como é o caso da TAP.
O justo valor estimado nos três métodos de avaliação para o Grupo TAP é negativo. Assim, o Governo não deverá registar um encaixe financeiro com a operação, cedendo apenas aos investidores a sua posição no capital social e as respetivas obrigações do Grupo. Contudo, o Governo deve ter em conta que a TAP tem valor ao tornar-se uma empresa mais eficiente, algo que é expectável numa privatização.
Classificação JEL: G32, L33
Palavras-chave: Privatização, Avaliação de Empresas, Múltiplos, Método dos Fluxos
iii
Acknowledgements
I would like to thank all those who contributed to the achievement of this master project.
First of all, my Supervisor, Professor Pedro Inácio who provided his time, knowledge and support which was extremely important to conclude this project.
Finally, I would like to thank my family, girlfriend and friends for their support because without them none of this would have been possible.
iv
Table of Contents
Abstract ………...………... i Resumo ………...……….… ii Acknowledgements ………...………...…….. iii Table of Contents ………..………...……...… ivIndex of Tables and Figures ………….………….………..……….. v
List of Acronyms ……..………..………...…...….... vii
Sumário Executivo ………...……... viii
1. Introduction ………..………..… 1
2. Review of Literature ………..………... 3
2.1 Corporate Valuation ……….. 3
2.2 Discounted Cash Flow Valuation ………. 6
2.3 Multiples (or Relative) Valuation ………... 9
2.4 Other Valuation Models ……… 10
3. Industry Overview ………..…………...………...…...………. 13
4. TAP Group Description ………...…….…... 17
5. TAP Group Valuation ………..………...……….… 20
5.1 Multiples Valuation Method ……….………...……… 20
5.1.1 EV/EBITDA ………..……….. 21
5.1.2 EV/EBITDAR ………..………..………….. 24
5.2 Discounted Cash Flow ……….………...……….…… 27
5.2.1 Free Cash Flow for the Firm Approach ………... 41
5.2.2 Free Cash Flow for the Equity Approach ………..….. 44
5.3 Valuation of Firms with negative earnings ………..… 49
6. So, why Investors want TAP Group? ……….… 51
7. Conclusions ………...… 57
7.1 The Proposals ………...……….………...……… 59
8. Bibliography ……….………...….. 63
v
Index of Tables and Figures
Table 1 – Main Differences between the Traditional Airlines and the LCCs …….... 15
Table 2 – EV/EBITDA and Enterprise Value ……….... 21
Table 3 – TAP Enterprise Value ……….... 22
Table 4 – TAP Group Non-Operating Assets ………... 23
Table 5 – TAP Group Market Value of Debt ………. 23
Table 6 – TAP Group Equity Value using EV/EBITDA ………... 24
Table 7 – Comparables EV/EBITDAR ……….. 25
Table 8 – TAP Group Equity Value using EV/EBITDAR ………. 26
Table 9 – TAP Group Historical Revenue ………. 28
Table 10 – TAP Group Historical Revenue Growth ... 29
Table 11 – System-wide Global commercial airlines revenue growth ... 29
Table 12 – System-wide Global commercial airlines RPK growth – Forecast ... 29
Table 13 – TAP Group vs System-wide Global commercial airlines – Annual Revenue Growth ... 29
Table 14 – TAP Group estimated Revenues ... 31
Table 15 – TAP Group historical operational ratios ... 32
Table 16 – TAP Group operational ratios – Forecast ... 32
Table 17 – TAP Group historical implied Tax Rate ... 33
Table 18 – TAP Group EBIT × (1-T) – Forecast ………... 33
Table 19 – TAP Group NWCN ... 34
Table 20 – TAP Group Net Fixed Assets ... 34
Table 21 – TAP Group Net Fixed Assets/Revenue and NWCN/Revenue ratios ... 35
Table 22 – TAP Group Forecasted Net Fixed Assets and NWCN ... 35
Table 23 – Research: What do you use for the risk-free rate? ... 37
Table 24 – Beta’s Inputs ... 39
Table 25 – TAP Group Cost of Equity ………... 40
Table 26 – TAP Group Cost of Debt ………..…… 40
Table 27 – TAP Group WACC ………..… 41
Table 28 – TAP Group FCFF ……….… 42
Table 29 – Average Yearly Inflation rate …...……….... 43
vi
Table 31 – TAP Group Equity Value (FCFF approach) ……….... 44
Table 32 – TAP Group Historical Debt ……….. 45
Table 33 – TAP Group Debt/Sales Ratio ………...… 45
Table 34 – TAP Group Debt – Forecast ……….… 46
Table 35 – TAP Group Interest Expense – Forecast ……….. 46
Table 36 – TAP Group estimated FCFE ……… 46
Table 37 – TAP Group Terminal Value (FCFE approach) ……… 47
Table 38 – TAP Group Equity Value (FCFE approach) ……….... 47
Table 39 – TAP Group Historical ROIC ……… 50
Table 40 - TAP Group Fair Value (Valuing companies with negative earnings method) ………...… 50
Table 41 – Summary: TAP Group Fair Value ……… 51
Table 42 – Sensitivity Analysis: Revenues ……….... 53
Table 43 – Sensitivity Analysis: EBITDA/Revenues ……….... 54
Table 44 – Operating Margin of Comparable Companies ……….… 55
Table 45 - TAP Group Fair value ………... 57
Table 46 - TAP Group Balance Sheet ……….... 68
Table 47 - TAP Group Profit and Loss Statement ………. 69
Table 48 – Historical Growth Rates – Air Transport industry ………...… 70
Table 49 – Unlevered beta in Europe – Air Transport industry ………. 70
Table 50 – Market debt to equity – Air Transport industry ………... 71
Table 51 – Historical evolution of TAP’s EBITDAR ……….…... 73
Figure 1 – Airline Industry Expansion in the past 40 years ………...… 13
Figure 2 – Different stages of development of Travel markets ……….…. 14
Figure 3 – Change in intra-European passenger market shares, 2000-2010 ……….. 15
Figure 4 – % of Private and Government-owned Airlines by Region ………... 16
Figure 5 – TAP Group Structure ……….... 18
Figure 6 – Germany Generic Government 10 year yield ………... 71
Figure 7 – EUR-USD exchange rate ……….………... 71
Figure 8 – Inflation rate – Portugal ……….... 72
vii
List of Acronyms
ACMI – Aircraft, Crew, Maintenance and Insurance APV – Adjusted Present Value
BRIC – Brazil, Russia, India and China CAPM – Capital Asset Pricing Model CF – Cash Flow
DCF – Discounted Cash Flow EC – European Commission ECB – European Central Bank
EBIT – Earnings Before Interest and Taxes
EBITDA – Earnings Before Interest, Taxes, Depreciation and Amortization EBITDAR – Earnings Before Interest, Taxes, Depreciation, Amortization and Rent EUR – Euro
EV – Enterprise Value
FCFE – Free Cash Flow for the Equity FCFF – Free Cash Flow for the Firm GDP – Gross Domestic Product
ICAO – International Civil Aviation Organization IMF – International Monetary Fund
IAG – International Airlines Group
IATA – International Air Transport Association JEL – Journal of Economic Literature
LCCs – Low-Cost Carriers
MoU – Memorandum of Understanding NWCN – Net Working Capital Needs
OECD – Organisation for Economic Co-operation and Development PER – Price Earnings Ratio
P/L – Profit and Loss Statement ROIC – Return on Invested Capital RPK – Revenue Passenger Kilometers TAP – Transportes Aéreos Portugueses TV – Terminal Value
USD – United States Dollar
viii
Sumário Executivo
O MoU assinado, em maio de 2011, pelo Governo Português com o FMI, a Comissão Europeia e o Banco Central Europeu, no âmbito do Programa de Assistência Financeira, foi o ponto de partida para um conjunto de privatizações de empresas públicas, bem como, para a venda de determinadas participações minoritárias em outras empresas. Este memorando resulta de uma economia deficitária que já perdurava há demasiados anos em Portugal e de uma situação de endividamento excessivo.
Assim, nos últimos três anos, algumas empresas públicas iniciaram um processo de privatização, como foi o caso da Energias de Portugal, S.A. e os CTT – Correios de Portugal, S.A. Por outro lado, havia um conjunto de empresas públicas que vinham sendo constantemente mencionadas pelo Governo Português e pelos media, que brevemente iriam seguir o mesmo caminho, como foi o caso do Grupo TAP.
O Grupo TAP tem como principal atividade o transporte aéreo de passageiros e de carga, bem como um conjunto de serviços prestados a entidades terceiras em áreas ligadas aos negócios principais do Grupo, tais como serviços de Manutenção e Engenharia. O Grupo TAP era detido a 100% pela Parpública Participações Públicas, SGPS, S.A., uma sociedade gestora de participações sociais de capitais exclusivamente públicos.
Desta forma, considerando o impacto que o Grupo TAP tem na economia portuguesa e na vida dos portugueses e, uma vez que, nos últimos anos, o processo de privatização do Grupo TAP tem sido discutido frequentemente, o objetivo deste projeto de mestrado é calcular o valor do Grupo TAP, de forma apurar qual é o valor do Grupo, para que se possa vender o Grupo TAP por um preço que seja bom para todos os stakeholders envolvidos neste processo. Assim, para determinar o valor do Grupo TAP serão utilizados três métodos de avaliação de empresas: a avaliação pelos múltiplos, o método dos Fluxos de Caixa Descontados, quer na ótica dos Fluxos de Caixa Livres para a Empresa, quer na ótica dos Fluxos de Caixa Livres para os Acionistas, e, por último, um modelo de avaliação para empresas que apresentam, de forma sistemática, resultados negativos, como tem sido o caso do Grupo TAP. A
ix avaliação pelos múltiplos, tem como base determinados rácios de empresas concorrentes, enquanto, os outros dois modelos têm em atenção a situação económica e financeira da empresa sob avaliação, tendo, no caso específico do DCF, uma especial atenção à capacidade de a empresa gerar fluxos de caixa positivos no futuro.
Em 2012, o Grupo Synergy, detido pelo empresário German Efromovich, através da sua subsidiária, a Synergy Aerospace, formalizou uma proposta para aquisição da TAP. Esta proposta foi rejeitada pelo Governo Português. Mais recentemente, em novembro de 2014, o Conselho de Ministros aprovou a reprivatização do Grupo TAP, através da privatização de 66% do capital social do Grupo, onde 61% do capital é afeto a investidores nacionais ou estrangeiros e os restantes 5% do capital é alocado para os trabalhadores do Grupo que pretendam adquirir uma participação na empresa. Numa fase avançada deste novo processo de privatização do Grupo TAP participaram três grupos de investidores: o Grupo Synergy do empresário German Efromovich, a Quifel Holdings, detida pelo empresário português Pais do Amaral e o consórcio Gateway, detido em 50,1% pelo português Humberto Pedrosa, dono da Barraqueiro, e por David Neeleman, fundador da empresa de aviação Azul e JetBlue.
Na fase de ofertas vinculativas, apenas as propostas do Grupo Synergy e do consórcio Gateway foram consideradas, com a decisão do Governo a pender para a proposta do consórcio Gateway como grande vencedora na corrida à privatização de 61% do capital do Grupo TAP.
A importância deste projeto está extremamente relacionada com o valor que a TAP tem para a economia portuguesa. As Exportações foram um dos pilares para a pequena retoma económica que o país apresentou em especial no último ano. Num Mundo global, a TAP é um instrumento vital para a internacionalização da economia portuguesa. De uma forma direta, a TAP, ano após ano, tem reforçado as vendas nos mercados externos, contribuindo para o aumento do valor das exportações. Por outro lado, através da sua atividade, a TAP tem a capacidade de influenciar as exportações de todos os outros agentes económicos presentes no país.
De salientar que este projeto de mestrado apresenta uma limitação de âmbito que está correlacionada exatamente com a capacidade que o Grupo TAP tem de influenciar as exportações de outros agentes económicos. Através da sua operação a TAP acaba por
x gerar riqueza para o País. E o valor desta riqueza é certamente um fator que o Governo Português deve ter em conta no momento de avaliação das propostas dos investidores, de forma a perceber se está disposto a perder parte desse valor com esta operação. Uma vez que, é extremamente difícil precisar qual é o valor da geração de riqueza indireta pela TAP para o País, este valor não foi considerado no projeto, tendo o mesmo sido restringido apenas a uma análise económico-financeira do Grupo.
O justo valor estimado nos três métodos de avaliação para o Grupo TAP é negativo. Os valores estão compreendidos num intervalo que vai de – 102,287 milhares de euros a – 133,615 milhares de euros. Considerando o intervalo de valores estimado para o justo valor da TAP conclui-se que o Governo Português deve apenas transferir aos investidores a sua posição no capital social da empresa e as respetivas obrigações do Grupo, sem receber qualquer contrapartida financeira pela operação.
Contudo, importa realçar que o Grupo TAP tem valor caso, no futuro, se torne um Grupo mais eficiente. Aliás, esta é uma expectativa que frequentemente está implícita a um cenário de privatização.
1
1. Introduction
Portuguese Council of Ministers approved the re-privatization process of TAP Group. TAP Group was totally owned by Parpública Participações Públicas, SGPS, S.A., a state asset management entity that manages several positions that Portugal State has in its portfolio and supports the privatization process of state-owned companies.
Concerning the impact that TAP has in Portuguese economy and in life of Portuguese people and, since in the last three years the privatization of TAP has been frequently discussed, the aim of this Master Project is calculate TAP’s fair value, in order to sell it at the right price, a price that can be good to all the stakeholders involved.
To achieve our purpose it will be used three of most known corporate valuation methods: Multiples (or Relative) Analysis, Discounted Cash Flow method, using the Free Cash Flow for the Firm approach and the Free Cash Flow for the Equity approach, and a valuation method used to valuing firms with regular negative earnings, which is the case of TAP Group.
First of all, it is going to be used Multiples Valuation method. In this approach TAP’s fair value will be obtained by looking at market ratios of similar firms and the sector. The methodology consists by analyzing the ratios of similar companies/sector and then compares this information with some TAP’s items reflected in company’s annual report (Balance Sheet and Profit and Loss Statement).
However, in order to get a better understatement of what can be TAP’s fair value it will be used the DCF valuation method, which is the most common and, for many experts and corporate valuation professionals, the best method to determine a company fair value. The DCF method is focused in the company’s ability to generate future cash flows, by considering the company’s past behavior in order to understand what can be its future. The DCF method will be performed by using two different approaches: Free Cash Flow for the Firm and Free Cash Flow for the Equity.
In the specific case of many privatizations, we are looking to value companies with long negative financial results, which is the case of TAP Group. Therefore, in order to get a better understanding of TAP’s fair value, it will be used another valuation
2 method that can be extremely useful to apply when valuing companies with negative earnings facing a privatization process.
Nevertheless, it is important to refer that valuing a company, like valuing anything else, is an individual process that depends on subjective factors.
In the next subject, a review of literature on what corporate valuation is and its usefulness is presented, as well as, the valuation methods that are going to be used throughout the valuation of TAP. Then, an industry overview and a brief description of TAP Group, to understand the actual context of the industry and the company, are presented. This is extremely important for the company valuation process that will be performed after. The final section culminates with the presentation of TAP’s valuation main conclusions.
3
2. Review of Literature
2.1 Corporate Valuation
Corporate valuation subject has always fascinated many academic students and professional people. Just looking at the purpose of corporate valuation it’s easily to understand the interest of many people on this matter given that it plays a decisive role in defining the fair value of a company.
However, before entering in the vast world of valuation it is important to understand one specific topic which is one of the main philosophical basis for valuation: the difference between price and value.
First of all, the concept of price and value is not only limited just to corporate valuation. This topic is and was present through the years in all human beings life’s, independent of its social, academic or professional situation. Oscar Wilde, a famous Irish writer and poet who lived in the 19th century, once described as “an individual
who knows the price of everything, but the value of nothing” (Damodaran, 2002: 1).
Recently, Buffet (2014: 20), the American business magnate and one of the most successful investors of the 20th and 21st century, in his letter to Shareholders of Berkshire Hathaway Inc., refers that “Price is what you pay. Value is what you get”. So, it’s clearly a big difference between price and value which is important to understand. Price is what people pay for a specific asset, can be a given product, a service, a company share, etc. Is the amount paid for that asset. On the other hand, value is what that asset worth. Value could be measured in financial terms, emotional terms, or in any number of ways.
A company value, according to Fama and Perez (2004) is a reflection of its utility to the evaluator and since utility and preferences are not clearly measurable, the calculation of company’s fair value will reflect those levels of individual subjectivity. Conversely, they define price as being the exact amount of money involved in the financial transaction of the company.
4 Koller, Goedhart and Wessels (2010: 3) refer that:
“Value is the defining dimension of measurement in a market economy. People invest in the expectation that when they sell, the value of each investment will have grown by a sufficient amount above its cost to compensate them for the risk they took”.
For them, value is extremely important because it takes into account the long-term interests of all the stakeholders in a company, and not just the shareholders. When companies maximize the value for their shareholders in the long term, and not only for the accounting earnings reflected in the short-term performance, they create more employment, treat better the employees and give more satisfaction to their customers than the competitors. Every company should follow the principle of value creation. Companies create value by investing capital they raise from investors to generate future cash flows at a higher rate of return than the cost of capital which is the rate that investors demand to be paid for using their money.
Valuation, like other subjects, developed several myths over time. In order to understand valuation and its process Damodaran (2002) clarifies the main myths. Firstly, valuation is not an objective process only. The models used can be quantitative, however some of the inputs necessary to implement the model are based in subjective judgments. So, given the exposure to external information about a company, the majority of valuations will have bias.
Secondly, the process of a company valuation is continuous. Given the constant new information about the company and other economic indicators, a valuation of a firm has to be updated to reflect the recent information. Like Lord Keynes once said “When the facts change, I change my mind. And what you do, sir?” (Damodaran, 2002: 4).
Finally, some people believe that a good valuation provides a precise estimate value. Since, company valuation has in its foundations assumptions made about the future of the company and economy, it is unfeasible to expect a precise and absolute estimate to company value. A reasonable margin for error has to be taken into account when measuring company’s value by any of valuation methods. The problems are not the valuation methods used but the difficulty in making assumptions for the future. The firms under analysis, the industry, the company life cycle or the economy wealth are
5 all factors that influence the precision of valuation. For instance, mature companies with a long financial history tend to be easier to value than growth companies, young start-up companies or even companies that are facing a privatization process.
Like was explained before, the study of corporate valuation is vast and has several ramifications. Some researchers dedicate their work to some particular aspects that may influence the value of the company. In particular, it is important to refer the study of Modigliani and Miller (1961) which focus their attention on the effect of certain policies on the value of the company. Their examined the impact of dividend policy on the shares prices. Firstly, Modigliani and Miller conclude that in the presence of perfect markets, where there are no transaction costs and taxes, and all the economic agents have the same financing conditions, the dividend policy and the capital structure is irrelevant to value creation. They show that there is no additional value to the company by using equity or debt funds to finance its activity. The value of the company only depends on the return of assets. Secondly, after a few years, Modigliani and Miller reviewed their initial study, by taking into account the existence of taxes. The fundamental point is that the interest paid by the company when using external financing can be deductable, resulting in a lower cost for the company in comparison with the equity cost. Therefore, in this situation the company profits increase and its value too. It is important to refer that in the real world this theory is difficult to implement. Here, Mota, Barroso, Nunes and Ferreira (2006) conclude that the costs of financial distress that may aware to the company by having a higher level of debt will destroy its value. The costs of financial distress can be direct costs, such legal costs occurred in a bankruptcy process, or indirect costs, like decrease of clients confidence in company products/services or agency costs that are costs originated by the conflict of interests between shareholders and debt holders.
Valuation is useful in an extensive sort of tasks. Damodaran (2002: 6) refers that: “The role it plays, however is different in different arenas”.
For the author valuation can be extremely useful in portfolio management, corporate finance and acquisition analysis.
In portfolio management, valuation is vital to fundamental analysts since the basis is the same. However, even for technical analysts, which believes that prices movements
6 depend on investor psychology or financial variables, valuation can be particularly useful. For instance, valuation can be used to calculate the support and resistance lines on a stock price, tools that are extremely important for the chartists’ analysts.
The useful of valuation in corporate finance is extremely related with the purpose of corporate finance itself. The objective of corporate finance is the maximization of company value through a continuous process of value creation. According to Koller et al (2010) this is one of the basis of valuation.
In an acquisition analysis or privatization process, the bid part, before making its proposal, need to compute and measure what is the fair value of the target company. Similarly, the target company through valuation method needs to determine the value of the company in order to analyze the offer. The fair value of the company is, in the end, the initial price that will be the starting point for negotiation between the buyer and the seller company.
Now that is already understood what is and the purpose of corporate valuation, it is crucial to refer that exist several models to measure the fair value of a company. Damodaran (2002:11) refers that:
“Analysts use a wide spectrum of models, ranging from the simple to the sophisticated. These models often make very different assumptions about the fundamentals that determine value, but they do share some common characteristics and can be classified in broader terms.”
The author argues that, in general terms, there are several models: Discounted Cash Flow (DCF), Multiples or Relative valuation, Contingent Claim Valuation (Options) and Asset Based Valuation.
2.2 Discounted Cash Flow Valuation
“[…] it is the foundation on which all the other valuation approaches are built”
Damodaran (2002:11)
The value of a company in DCF valuation is related with the present value of expected future cash flows generated by the company.
7 According to Mota et al (2006), DCF valuation estimates the value of the company in a dynamic perspective. The company value does not depend on its historical and actual situation, even if it was and is extremely positive, but for its capacity to generate positive cash flows in the future.
DCF is the most known method to measure the value of an asset or a company. Moreover, according to Damodaran (2002), anyone who understands the basis of DCF will be able to use and analyze other different approaches. For instance, the option pricing models used to value any asset, financial or real, frequently have its starting point in a DCF valuation.
In generically terms, the DCF method is calculated as follows:
Present Value =
(1)
Where,
n = Life of the asset
CFt = Cash Flow in period t r = Appropriate discount rate
It is important to refer that exist many variations of DCF models.
Depending on the purpose of the appraiser and what he wants to value, Damodaran (2002) argues that exist three ways to apply the DCF model: value the entire company, value only the equity position in the business and value the company in pieces, which is called APV. The concept is similarly in the three approaches, which is discount the expected future cash flows for the present time. However, the calculation of cash flows and the discount rate will be different under each. We only will focus our attention in the first two approaches, which are the models that will be used in this work to value the company.
When valuing the entire company the appraiser pays attention to the FCFF which is the amount of cash that is available to the company after paying all the expenses, reinvestment needs and taxes. On the other hand, when evaluating the equity stake in the business the appraiser focuses on the FCFE, amount of cash available to be distributed to the shareholders, after paying all expenses, tax, reinvestment needs and net debt payments (interest, principal payments and new debt issuance). This way:
8
FCFFn = EBITn × (1 Tax rate) ∆ Net Working Capital Needsn Net Capexn (2)
FCFEn = FCFFn+ (Debtn Debtn-1) – Interest Expensen × (1-Tax rate) (3)
The discount rate to apply in each approach will be different too. If the appraiser is valuing the entire firm the discount rate to apply will be the weighted average cost of capital (WACC), which takes into account the overall risk of the company, usually financed by equity and debt sources.
WACC = (4)
Conversely, if it is used the FCFE approach, the discount rate should reflect only the risk of equity, which is the rate of return required by the equity investors.
In both approaches, since it becomes more difficult as time goes by to estimate cash flows, perpetuity technique is used to compute the terminal value (TV). For Mota et al (2006), the terminal value, frequently, represents the major part of the company value.
TVn FCFF approach=
(5)
TVn FCFE approach =(6)
Where,g = long term growth rate
DCF valuation is easy to use, especially, if the company under valuation has historical positive cash flows with a similar performance and a proxy for risk is available to obtain discount rates. However, this model in other situations needs to be computed very careful. According to Damodaran (2002), the DCF valuation model has to be flexible when applied to companies in trouble, companies facing a restructuring process, private companies, cyclical companies and companies involved in acquisitions in order to assume correctly all the specifications of these types of firms, which can have a higher impact in company’s value.
9
2.3 Relative (or Multiple) Valuation
“[…] the reality is that most valuations are relative valuations”
Damodaran (2002:18)
For Mota and Custódio (2006) the purpose of relative valuation is confront the value of the company with other companies that are similar to it, or with the average of the industry by using a range of multiples ratios.
Damodaran (2002) refers that in the real life relative valuation is the most used valuation. He (2002: 18) argues that “in relative valuation, the value of an asset is
derived from the pricing of comparable assets, standardized using the common variable such as earnings, cash flows, book value or revenues”.
There are a lot of different multiples that can be used, such the Price to Sales ratio, the Price to Book Value and the PER – Price earnings ratio. Other multiple that is frequently used by the appraisers, and will be the multiple used to perform the valuation of TAP’s fair value is the EV/EBITDA.
The EV/EBITDA takes into account the debt being used by a company, an item which is not included, for instance, in the PER multiple. It is particularly interesting to analyze this ratio in a privatization scenario since the acquirer part would like to take into account the Debt amount of the company which is reflected in the Enterprise Value.
Moreover, the EV/EBITDA ratio ignores the effects of countries tax policy, extremely useful when we are comparing with other companies based in different countries. Depending on the industry being analyzed, some multiples are more appropriate than others.
According to Massari, Visciano, Lagreca, Mele, Bellavita, Cera, Rippa, Peschiera, Spaltro and Papa (2004) exist other multiple that is extremely useful to value air transport companies, the EV/EBITDAR. This specific multiple is able to represent some specific characteristics of the airline industry, reason why it will be used too to measure TAP Group fair value. EBITDAR represents the gross operating margin before aircraft leasing costs. This allows a comparison between the airline companies,
10 regardless of the decision to own or lease the fleet. In fact, this multiple gives to the appraiser another perspective of the company value when we compare with the EV/EBITDA because, for instance, for companies that own the aircraft, the amount of debt repayment and the amount of interest expense are not included in the gross margin (EBITDA). Therefore, a comparison between airline companies that have leasing costs is not possible.
The DCF method, when applied to airline companies, is impacted by the cyclical nature of the business, which represents a limitation in projecting the future cash flows of the company under analysis. Moreover, in the specific case of the company that owns the aircraft, the allocation timing of the investments relative to new aircrafts will certainly lead to distortions in projecting the future cash flows.
The multiples analysis is very simple and easy to work. Nevertheless, they can be tricky, since the definition of comparable companies, used to compute the valuation, is subjective. A bad comparable company’s choice can misuse all the valuation conclusions. Mota and Custódio (2006) conclude that multiples analysis needs to be seen as DCF complementary method and not like a DCF substitute method. Damodaran (2002: 20) goes further and enhances that “while this potential bias exists
with the discounted cash flow valuation as well, the analyst in the DCF valuation is forced to be much more explicit about the assumptions which determine the final value. With multiples, these assumptions are often left unstated”.
2.4 Other Valuation Models
Damodaran (2002) defends that there are, in general terms, two more different approaches that can be used in valuation: the Contingent Claim Valuation (Options) and the Asset Based Valuation.
The Option pricing models are the foundations of Contingent Claim Valuation. Options pricing models, such the Binomial model or the Black and Scholes model, are commonly used in valuation of financial assets. However, these models have been adapted to value real assets, projects, companies and equity stakes. The usage of real options models are very useful to value businesses when the company is facing an
11 uncertainty context, since these models take into account the flexibility that the company has in the future on the occurrence of a certain event. By using real options analysis the appraiser values this flexibility, which is going to increase the value of the project.
According to Damodaran (2002) the fundamental principle to use option pricing models is that DCF models tend to minimize the value of assets that, on the occurrence of a certain event, provide different payoffs.
Myers (1976), one of the first authors to argue the importance of the real options models in corporate valuation, goes further than Damodaran, by assuming that real options are intrinsic assets of a company. In his working paper, The Determinants of Corporate Borrowing (1976), he picked in the theory of Modigliani and Miller (1961) and defends that a company at certain period in time is a collection of tangible assets, which are units of productive capacity, and intangible assets, options which give the right to the company to purchase additional units in the future.
It is important to refer that some limitations may aware in using the option pricing models, especially, if the underlying asset is not traded. In this situation, the inputs for the value of the underlying asset have to be predictable. Therefore, in this case, the final value will have a higher level of error than the final value calculated using information extracted from financial reports.
Some analysts use the Asset Based Valuation to measure the value of an asset. About this subject, Damodaran (2002) argues that this approach needs to be seen as an integrated part of the other three methods since some values obtained through the application of the Asset Based Valuation are calculated using at least one of that three approaches. The Asset Based Valuation models take into account the individual assets owned by a company and use that information to estimate the value of the company. There are several variants on the Asset Based Valuation models. One approach looks for the liquidation value, which is computed by adding and aggregating the estimated sale proceeds of the assets owned by the company under analysis. On the other hand, in the replacement cost approach, the appraiser is focus in what will be the cost to replace all the assets that company has in that period of time.
Finally, is extremely important to mention that, in most valuation methods presented until now, we have looked for companies that have positive earnings. It cannot be said
12 that these methods cannot be applied to firms that have negative earnings. However, Damodaran (2004) refers that when we are analyzing companies in this financial situation, these valuation methods need to be applied carefully in order to be adapted and reflect the underlying reasons that generate these negative earnings. A firm with negative earnings is more difficult to value than a firm with positive earnings because: exist in these companies the real possibility that these firms will go bankrupt if earnings continue negative, the estimation of taxes becomes more difficult to obtain and estimate the earnings growth rate is difficult because when current earnings are negative, applying a growth rate will just make it even more negative.
Damodaran (2004) refers that there is not a specific way to deal with negative earnings because this will depend upon why the company has negative earnings in first place. In his book, Damodaran (2004) explores the alternatives that he considers available to value companies with negative earnings. In the specific case of many privatizations, we are looking to value companies with a long negative financial record, like it will be shown upfront, was the case of TAP Group. Therefore, in order to get a better understanding of TAP’s fair value, it will be used another valuation method that, Damodaran (2004) defends that can be extremely useful to apply when valuing companies with negative earnings facing a privatization process:
Value of the Firm =
(7)
Where,
Reinvestment Rate =
13
3. Industry Overview
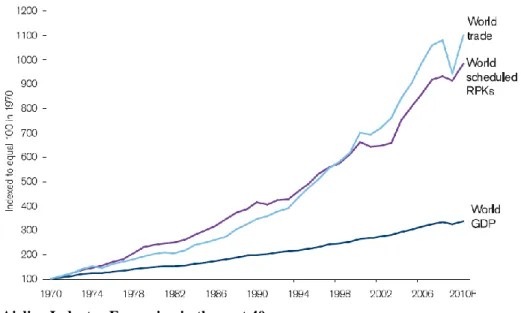
Over the past four decades there has been an incredible growth in air transport services. In this period, the volume air travel, measured by worldwide scheduled RPK, has expanded ten times and the freight fourteen times. RPK is a measure of sales volume of passenger traffic and FTK measures the freight traffic. RPK is obtained by multiplying the number of revenue passengers on each flight by the total number of kilometers of that flight. The airline industry has been one of the fastest growing economic sectors, like it can be seen in figure 1. In graph is illustrated that the airline industry has an expansion three times greater that the growth of the world’s economies and has a similar trend with the world trade. The growth of the airline industry was a key factor and is extremely responsible for the Globalization process that is now part of peoples and business life’s. According to Belobaba, Odoni and Barnhart (2009) the airline industry itself is a major economic force, in terms of both its own operations and its impacts on other industries such as Tourism.
Figure 1 – Airline Industry Expansion in the past 40 years Source:IATA Vision 2050 Report
We can see in figure 1 that, in an initial phase, the air travel grew faster than the world trade. However, in the 90s and 2000s, as the OECD markets matured the average income declined and air travel grew at a lower rate than world trade.
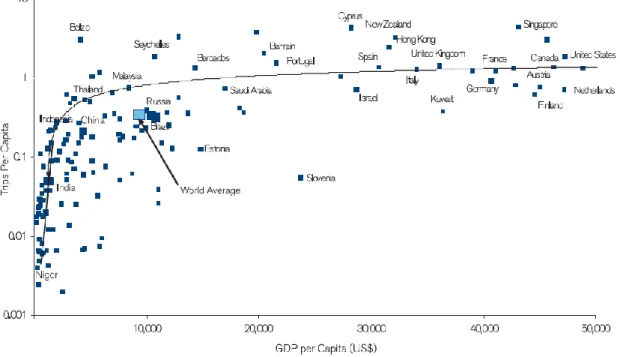
Looking at figure 2 we can conclude that once real GDP per capita reached $15,000-$20,000 the number of trips by air per head of population levels out. Today’s large
14 markets in the US and Europe are approaching saturation. However, the BRIC economies have very underdeveloped travel markets and are likely to be a large source of new travel demand in the decades ahead.
Figure 2 – Different stages of development of Travel markets Source:IATA Vision 2050 Report
The Macroeconomic turmoil and the threat of terrorism since 9/11 had impact on volumes and values of traffic performed by the industry. In other hand, microeconomic changes, specially related to the growth of market power of LCCs, are putting into deep crisis the traditional airlines companies.
According to Jarach (2004) the traditional carriers’ business model has been a great success in the past, but today it is showing to be unsustainable in the current form. He (2004: 29) refers that:
“In a condition of fixed-costs that reach up to 90% of total costs and with few chances of cutting them in the short period, this revenue-cost imbalance naturally gives life to huge deficits, liquidity crises, job cuts, network reductions and, eventually, bankruptcies”.
15 Based on Jarach (2004) analysis the main differences between the Traditional airlines and the LCCs are:
Traditional Airlines LCCs
Massive marketing expenses (advertising, Frequent Flier Programs, travel agents’ overrides, network analysis)
Minimal marketing expenses (word-of-mouth on comparative advertising, airports’ supports)
Expensive fragmented and complex services (classes of tariffs and service, catering, lounges, ground services, etc.)
Personal, convenient and pleasant service (reengineering around core benefits, easy price discrimination) Massive use of technology (hard
technology: aircraft tailored for each route and prescription; soft technology: CRS legacy systems)
Judicious use of technology (hard technology: fleet standardization; soft technology: Internet and CRS avoidance) Ancient-regime financial targets (in contrast
with macroeconomic shockwaves and lifestyle changes)
Realistic financial targets (based on their own business model)
Structural efficiencies (no overstaffing,
high productivity, no hubbing costs)
Table 1 – Main Differences between the Traditional Airlines and the LCCs
Source:Future Scenarios for the European Airline Industry analysis by Jarach
These differences explain why LCCs have boomed in the recent years, like shown in Figure 3, and why the Traditional airlines need to respond and adapt quickly to this context.
Figure 3 – Change in intra-European passenger market shares, 2000-2010 Source:IATA Vision 2050 Report
75% 60% 20% 15% 5% 25% 0% 20% 40% 60% 80% 100% 2000 2010 Low-Cost Airlines Charter Airlines International & Regional Airlines
16 Many older airlines were companies owned by the Government. However, through the years this has changed with many companies facing a privatization process, especially in Europe and North America (figure 4). IATA predicts that this process will continue in the near future.
Figure 4 – % of Private and Government-owned Airlines by Region Source:IATA Vision 2050 Report
17
4. TAP Group Description
“With Arms Wide Open”
TAP Group Slogan
The main activity of TAP Group is air passenger and cargo transport. It also provides services to third party customers in areas related to the Group’s core activities, such as Maintenance and Engineering services. TAP starts its activity in 1945 and is the leading Portuguese airline. Currently, TAP has connections to 88 destinations in 38 countries all around the world and has a fleet of 77 aircraft (61 airbuses and 16 Portugália aircrafts).
The mission of TAP is based in three pillars:
- develop the international airline business, ensuring that is the best option for passengers and in cargo air transport services;
- be one of the best companies to work;
- be recognized as a company that provides its investors with appropriate levels of return.
TAP Group was totally owned by Parpública Participações Públicas, SGPS, S.A., a State Asset Management Entity. This entity manages several positions that Portugal State has in its portfolio and supports the privatization process of state-owned companies.
Recently, TAP has dedicated more its attention to some of its main markets, such as Brazil and other South American countries and some countries in Africa, particularly Angola and Mozambique. By following this expansion strategy, TAP was considered the number one airline between Europe and Brazil and in 2014 won the Leading European Airline to Africa and South America award from the World Travel Awards.
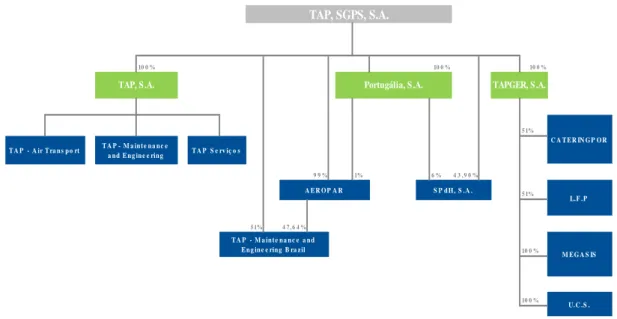
18 As described below, the TAP Group is constituted by several companies:
Figure 5 – TAP Group Structure
Source:TAP Group Annual Report
TAP S.A.: Responsible for providing air passenger transport and the operational maintenance and engineering to third parties in its Lisbon Hub. Is also responsible for support and management services, contributing to improve the profitability of the Group.
TAP – Maintenance and Engineering Brazil: Has two maintenance centers, located in Rio de Janeiro and in Porto Alegre. This entity is responsible for activities related to aircraft and component overhaul.
Portugália, S.A.: Has a fleet of 16 aircrafts that can be rented at a ACMI basis (aircraft, crew, maintenance and insurance). Actually, this company plays a role of feeder-defeeder network function only to TAP Group. The company stopped to work independently in the regional market since was acquired by TAP in 2007, to work currently in a Group perspective as a provider of air passenger and cargo transport hired by TAP.
SPdH – Serviços Portugueses de Handling, S.A.: Established in Lisbon, Porto, Faro, Funchal and Porto Santo airports this company provides a wide range of services to Group’s core business and to third parties, such as ramp service, cargo, load control, airport security, baggage delivery and other services. 10 0 % 10 0 % 10 0 % 5 1% 9 9 % 1% 6 % 4 3 , 9 0 % 5 1% 5 1% 4 7 , 6 4 % 10 0 % 10 0 % L.F .P M E G A S IS U.C .S . TAP, SGPS, S.A. T A P - A ir T ra n s p o rt T A P - M a in t e n a n c e a n d E n g in e e rin g B ra z il C A T E R IN G P O R A E R O P A R S P d H , S .A . T A P - M a in t e n a n c e a n d E n g in e e rin g T A P S e rv iç o s
19 TAPGER, S.A.: Company based in Lisbon that provides complementary services to Group’s core business. The objective of this entity is supervise the management of its participated companies and give the necessary assistance to the companies Lojas Francas de Portugal, S.A. and CateringPor – Catering de Portugal, S.A.. Megasis is a Group entity specialized in IT technology and U.C.S. – Cuidados Integrados de Saúde, S.A. provides a range of healthcare services to the Group.
20
5. TAP Group Valuation
As explained in the previous sections, it will be used three different approaches in order to get a better understanding of what can be TAP’s fair value: Multiples Analysis, DCF method, using the FCFF and the FCFE approaches, and a valuation method used to valuing companies with regular negative earnings.
5.1 Multiples Valuation Method
Multiples (or Relative) valuation method is one of the most common approaches used to estimate company’s fair value. There are a lot of different multiples that can be used in Corporate Valuation, such as PER, Price/Book Value, EV/EBITDA, etc.
Depending on the industry being analyzed, certain multiples are more appropriate than others. Thus, when we are looking at the specific case of the airline industry and valuing airlines companies, the commonly multiples used are EV/EBITDA and EV/EBITDAR. In addition, PER ratio cannot be used to value unprofitable companies. Therefore, in order to estimate TAP’s fair value it will be used these two multiples.
As discussed before, it is important to refer that the choice of comparable companies is fundamental in this valuation. A bad comparable company’s choice can misuse all the valuation conclusions.
For the purpose of valuing TAP the comparable companies chosen were: Air
France-KLM, Lufthansa and IAG. These three European airlines, like TAP, provide international and domestic air passenger and cargo transportation services. Furthermore, the final report produced in 2012 by the special committee for monitoring the privatization of TAP Group, refer that, in an initial phase of the privatization process, these three airlines have shown interest in acquiring the Portuguese Government stake in TAP.
21 Finally, after choosing the multiples and the comparable companies, is extremely important to get reliable data to compute the method. For both methods, InFinancials information will be the source to get the data needed. InFinancials gives access to market multiples, as well as company data, in a single click. Some of the most known companies of the financial world, such as KPMG and Crédit Agricole Corporate & Investment Bank., used InFinancials information on a daily basis. Therefore, this gives us confidence to believe that this information is consistent to perform TAP’s valuation.
5.1.1 EV/EBITDA
In a privatization scenario, this multiple is extremely useful to analyze since the Enterprise Value takes into account the debt which the acquirer will have to assume. In this case, Enterprise Value is a better metric than market capitalization, which is used, for instance, in PER multiple. Additionally, this multiple is extremely valuable in this specific case of the airline industry because it ignores the effects of individual countries tax policies that can distort the valuation process.
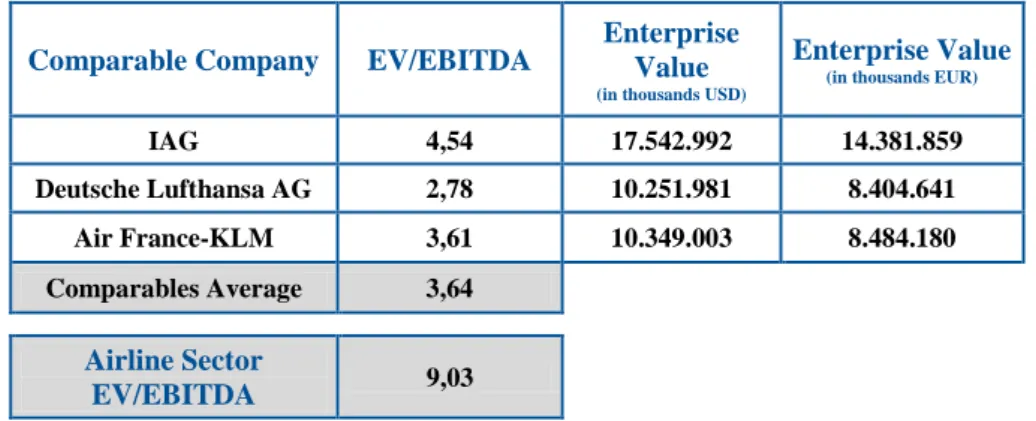
The subsequent table summarizes EV/EBITDA ratio of comparable companies and sector, and the Enterprise Value of these companies, on December, 29th of 2014. EUR/USD exchange rate considered in this Master Project was 1.2198. This information was retrieved from Bloomberg Website, on December, 29th of 2014.
Comparable Company EV/EBITDA
Enterprise Value
(in thousands USD)
Enterprise Value
(in thousands EUR)
IAG 4,54 17.542.992 14.381.859 Deutsche Lufthansa AG 2,78 10.251.981 8.404.641 Air France-KLM 3,61 10.349.003 8.484.180 Comparables Average 3,64 Airline Sector EV/EBITDA 9,03
Table 2 –EV/EBITDA and Enterprise Value Source:InFinancials Website
22 EV/EBITDA of the airline sector is 9.03, which means, that, on average, an airline company that operates in this industry has a EV that is 9.03 times its EBITDA. On the other hand, the average of EV/EBITDA of comparable airlines is 3.64, a number that is lower than the sector.
As explained before, valuation is a subjective process and we need to take into account some particular aspects to achieve a better understanding. Thus, we need to examine why there is a significant difference between the two ratios. Analyzing the data and the composition of the airline sector1 we conclude that LCCs airlines (such as Ryanair or Easyjet) are increasing the value of the sector. The business model of these LCCs airlines is different from “traditional” airlines, such as TAP or the comparable companies chosen. Therefore, in order to get a better understanding of what can be TAP’s fair value it will be used the average of EV/EBITDA of comparable airlines, instead of the airline sector.
Looking at TAP’s annual report of 2014 we retrieve the EBITDA of the company, which was 89,993 thousands of Euros. The Enterprise Value of TAP can be calculated as follows:
TAP’s EV = TAP’s EBITDA × (9)
Comparable Company
TAP Enterprise
Value
(in thousands EUR)
IAG 408.568
Deutsche Lufthansa AG 250.181
Air France-KLM 324.875
Comparables Average 327.874
Table 3 –TAP Enterprise Value Source:Author
23 However, the purpose of this project is not to measure TAP’s Enterprise Value but TAP’s Equity Value. Moreover, in order to compare TAP’s value obtained in Multiples with other methods, such as DCF, we need to calculate the Equity Value of the company as follows:
Company’s Equity Value = Company’s EV + Non-Operating Assets – Market Value of Debt (10) The amount of TAP’s total non-operating assets in 2014 was 411,320 thousands of Euros.
Non-Operating Assets 2014
Current Assets 304.342
Other accounts receivable 63.061 Cash and bank deposits 241.281
Non-current assets 106.978
Investment properties 2.139 Other intangible assets 738
Other financial assets 2.122 Deferred tax assets 53.410 Other accounts receivable 48.569
Total Non-Operating Assets 411.320
Values in Thousands of Euros Table 4 –TAP Group Non-Operating Assets
Source:TAP Group Annual Report
In other hand, the company’s market value of debt tends to be similar to its accounting value. Therefore, we assume the market value of debt is equal to the book value of debt. The amount of TAP’s total non-operating debt in 2014 was 1,536,728 thousands of Euros. Non-Operating Debt 2014 Current liabilities 999.883 Shareholders 0 Loans received 633.682 Other accounts payable 366.201
Non-current liabilities 536.845
Total Non-Operating Debt 1.536.728
Values in Thousands of Euros Table 5 –TAP Group Market Value of Debt
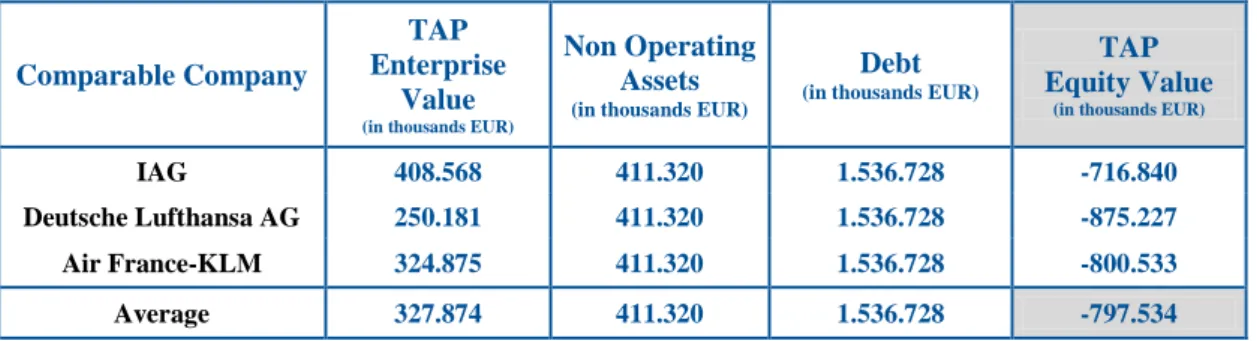
24 Thus, TAP Group Equity Value using the average EV/EBITDA multiple was – 797,534 thousands of Euros, as illustrated in the table below:
Comparable Company
TAP Enterprise
Value
(in thousands EUR)
Non Operating Assets
(in thousands EUR)
Debt
(in thousands EUR)
TAP Equity Value
(in thousands EUR)
IAG 408.568 411.320 1.536.728 -716.840
Deutsche Lufthansa AG 250.181 411.320 1.536.728 -875.227
Air France-KLM 324.875 411.320 1.536.728 -800.533
Average 327.874 411.320 1.536.728 -797.534
Table 6 –TAP Group Equity Value using EV/EBITDA Source:Author
5.1.2 EV/EBITDAR
EV/EBITDAR is an important multiple method to apply when valuing companies in the airline industry, given that it is more able to represent some specific characteristics of the industry, reason why it will be used to measure TAP Group fair value too.
As explained before, EBITDAR represents the gross operating margin before aircraft leasing costs, which allows a comparison between airline companies, regardless of the company’s decision of owning or leasing the fleet.
Furthermore, making a comparison with the EV/EBITDA multiple, EV/EBITDAR has an advantage and gives to the evaluator a more accurate perspective of the company under valuation. For instance, if the company owns the aircraft, EBITDA will not include the debt repayment amounts and the financial costs (interest expenses). Therefore, in this specific case, it is not possible to make reasonable comparison with airline companies that have leasing contracts, where those costs are reflected in the cash flow margin.
Air France-KLM and IAG last Annual Reports have explicitly the value of company’s EBITDAR. In other hand, TAP Group and Deutsche Lufthansa AG EBITDAR value is not displayed directly in the company’s annual report and we need to perform some calculations to get the value. EBITDAR represents the gross operating margin before aircraft leases. Looking at Deutsche Lufthansa’s Income Statement and explanation
25 note number 7 we can get the EBITDA and the aircraft leases costs of the company. We use the same procedure to measure TAP’s EBITDAR. The only difference is that lease costs are reflected in explanation note number 41 in company’s annual report. Finally, to obtain the EBITDAR of the company we just need to add to company’s EBITDA the aircraft leases costs.
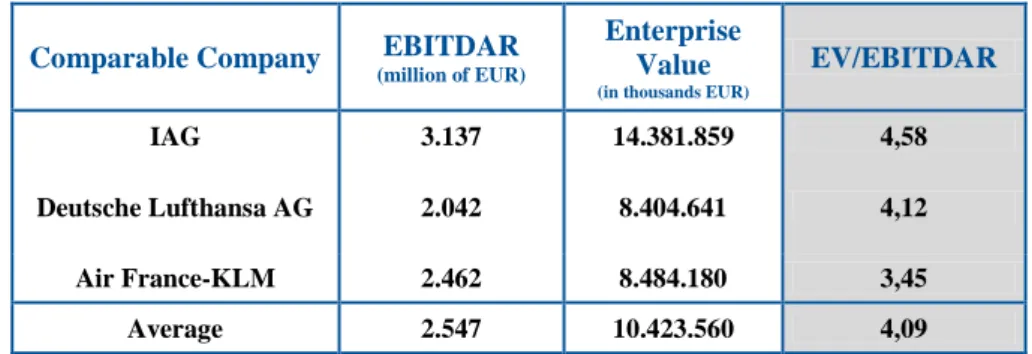
At this moment, we just need the numerator to complete the equation, the Enterprise Value. However, from the previous multiple ratio we already have this information. The next table summarizes the comparables EV/EBITDAR:
Comparable Company EBITDAR
(million of EUR)
Enterprise Value
(in thousands EUR)
EV/EBITDAR
IAG 3.137 14.381.859 4,58
Deutsche Lufthansa AG 2.042 8.404.641 4,12
Air France-KLM 2.462 8.484.180 3,45
Average 2.547 10.423.560 4,09
Table 7 –Comparables EV/EBITDAR Source:Author
The value of TAP Group EBITDAR in 2014 ascends to 147,308 thousands of Euros. However, we need to pay attention to a detail. TAP’s EBITDAR of 2014 was extremely affected by the extraordinary costs that occurred in the year, costs that probably may not happen in the future. Company’s annual report of 2014 refer that TAP’s results were lower than expected. One of the main reasons for that were the several staff strikes that occurred and other that in the end not occurred but influenced client’s decision, forcing TAP to outsource aircrafts to other companies, selling less and compensating Clients for this situation. Other reason where flights that not occurred during the year because the supplier delayed in delivering the new aircrafts. When we analyze the period 2010-2013 we conclude that TAP’s EBITDAR improved in last year’s. In 2010 TAP’s EBITDAR was 192,412 thousands of Euros and in 2013 was 225,434 thousands of Euros2.
26 In other hand, Guerreiro and Fiúza (2015) refer that investors interested in TAP Group are considering in its valuations a TAP’s EBITDAR of 250,000 thousands of Euros.
We believe this is a good estimate value to use in our valuation too because it does not take into account the extraordinary costs that happened in 2014, contributing to a lower EBITDAR and this value reflects, if excluding again the year of 2014, the evolution of TAP’s EBITDAR in last year’s.
Thus, considering an EBITDAR of 250,000 thousands of Euros, TAP Group Equity Value, using the comparables’ average EV/EBITDAR multiple, was – 102,287 thousands of Euros, as illustrated in the table below.
Comparable Company EV/EBITDAR
TAP Enterprise Value ('000 EUR) Non Operating Assets ('000 EUR) Debt ('000 EUR) TAP Equity Value ('000 EUR) IAG 4,58 1.146.148 411.320 1.536.728 20.740 Deutsche Lufthansa AG 4,12 1.028.972 411.320 1.536.728 -96.436 Air France-KLM 3,45 861.513 411.320 1.536.728 -263.895 Average 4,09 1.023.121 411.320 1.536.728 -102.287
Table 8 –TAP Group Equity Value using EV/EBITDAR Source:Author
27
5.2 Discounted Cash Flow
DCF is the most known method used to measure a company’s value. The value of a company is related with the present value of expected future cash flows generated by the company. In DCF valuation, the evaluator has to estimate the future free cash flows during the valuation horizon and the terminal value of the business at the horizon, and discount them at a rate that reflects their risk.
It is important to refer that we are interested in calculating the fair value of TAP Group, not only the holding company or a specific enterprise within the group. Therefore, we will only use values from TAP’s consolidated financial statements.
As explained before, it will be used two different approaches to calculate the fair value of TAP: FCFF and FCFE.
First of all, before develop any model, based in TAP Group historical information and some future indicators of the airline industry, it will be calculated a specific data that is necessary to both approaches, such as TAP Group future revenues, the discount rate, etc. Only after getting this information it will be performed the two models. The first approach to apply will be the FCFF, which reflects the amount of cash that is available for the company after paying all the expenses and reinvestment needs. After that it will be performed the FCFE approach. The main reason to follow this order is because FCFF is used as an input to calculate the FCFE value.
Finally, is important to refer what will be the explicit forecast period. Looking at other airline companies’ valuation we assume a forecast period of 5 years, from 2015 to 2019. Another forecast period could be assumed. However, in spite of the values obtained could be slightly different by using a different forecast period (3, 4 or 5 years are the most common periods used), is the Terminal Value, the perpetuity technique that represents the major part of the company value. So, in the end, our conclusions will be similar, independent of the forecast period chosen.
The financial projections are mainly based on the previous 5 years of financial performance (2010-2014) and economic conditions within the airline industry.
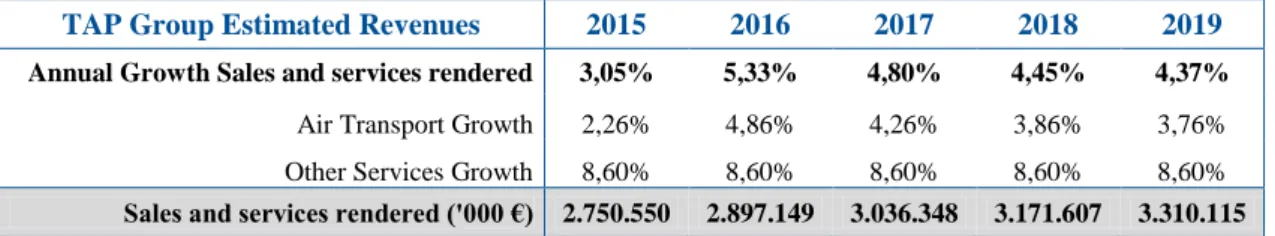
28 Revenue Forecast
One of the first steps we need to do in order to estimate the future cash flows necessary to compute the DCF model and calculate the company’s fair value is forecasting what will be the company’s revenue for the future. Forecasting a company's revenues is possibly the most important assumption we can make about its future cash flows and it can also be, in some cases, the most difficult assumption to make because we need to consider a wide range of factors. We need to pay attention if the company's market is expanding or contracting and think carefully about what the industry and the company could look in the future.
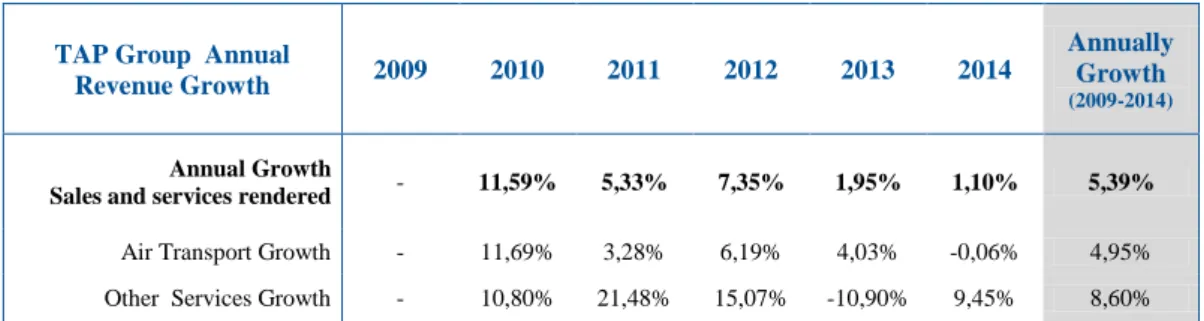
Firstly, we look for TAP’s revenue of last 5 years. TAP’s revenue can be subdivided in two groups: air transport and other services. The air transport revenue is related with the income generated by client’s transportation in all markets were TAP operates. Other services revenue is related with the income associated to maintenance services to third parties in Portugal and Brazil, duty free shop, catering, holdings and other services. Table 9 summarizes TAP’s revenue from 2009 to 2014.
TAP Group
Revenue 2009 2010 2011 2012 2013 2014 Average
Sales and services
rendered 2.075.010 2.315.521 2.438.880 2.618.049 2.669.027 2.698.321 Air Transport Revenue 1.839.516 2.054.592 2.121.907 2.253.307 2.344.056 2.342.627
Other Services Revenue 235.494 260.929 316.973 364.742 324.971 355.694
% Air Transport Revenue
in Total Revenue 88,65% 88,73% 87,00% 86,07% 87,82% 86,82% 87,52% Values in Thousands of Euros Table 9 –TAP Group Historical Revenue
Source:TAP Group Annual Reports
Secondly, we need to take into account some key figures:
On December of 2014 it was noticed that the number of passengers travelling in TAP increased 7% comparing to the number of passengers that traveled in all the year of 2013. This is not the revenue growth value but is an indicator that sales are increasing.