0
Pn301evtv
SPATIAL ANALYSES FOR POLICY EVALUATION OF THE RURAL WORLD
:
PORTUGUESE AGRICULTURE IN THE LAST DECADEEric de Noronha Vaz*, Teresa de Noronha Vaz** and Peter Nijkamp***
* ISEGI, Universidade Nova de Lisboa, Portugal
**Faculty of Economics, Universidade do Algarve, Faro, Portugal
***Faculty of Economics and Business Administration, Free University Amsterdam, The Netherlands
Abstract
This paper aims to contribute to the understanding of structural land use changes that are occurring in rural environments, by using novel methodologies related to Geographic Information Systems (GIS). The land use change analysis developed in this study is associated with a pre-selected set of policy issues, that is, it offers a retrospective view of the application of the Common Agricultural Policy (CAP) for the Portuguese situation. The evaluation of the respective impacts from a spatial perspective raises questions such as: 1) What are the trade-offs of rural activity in different sectors and regions? 2) How do such trade-offs cope with urban proximity?, and 3) Which activities or strategies are best able to balance the needs of rural and urban communities. Methodologically, our work identifies the land use change for the period 1990 – 2000 by comparing the databases CORINE Land Cover 90 and CORINE Land Cover 2000. Further, in order to detect those sectors that, at national or regional level, have taken more advantage of the CAP support, we present a new model, which also takes into account as a major assumption the proximity of rural areas to the nearest towns.
The scope of this paper is twofold: addressing a specific problem concerning the effectiveness of the CAP, it develops an extensive empirical and methodological framework able to serve as a model-policy lesson for the rural/agricultural European future.
1 1. Theoretical Foundations
Globalization as well as increasing incomes in various countries in our world have changed the consumption and production of food products in such a way that the World Trade Organization (WTO) and the European Union (EU) have argued in favour of lower national protection and regulation also for agricultural products.
Since June 2003, the CAP has completely changed the way the EU has supported its farm sector to meet the market needs and to promote more awareness of environmental impacts of agricultural production techniques, as well as of food and animal safety. In order to achieve these goals, the selected key elements for this reform were:
• A single farm payment for EU farmers, independent of production – with limited production-related payments to avoid abandonment of production. This payment is linked to respect for the environment, food safety, animal and plant health, and animal welfare standards;
• A strengthened rural development policy – new measures to promote the environment, food quality, and animal welfare and to help farmers meet EU production standards;
• A reduction in direct payments for bigger farms – to finance the new rural development policy;
• A mechanism for financial discipline – to ensure that the farm budget fixed until 2013 is not exceeded;
• Some revisions to the previous market policy of the CAP: o asymmetric price cuts in the milk sector;
o reduction of the monthly increments in the cereals sector by half, with the intervention price maintained;
o lastly, reforms in the rice, wheat, nuts, potatoes and dried fodder sectors.
Because of long-term policies, producers in most European countries have, to a certain extent, tailored their products to new markets, either by introducing new products for new sets of clients, or by innovating the existing products in order to adjust to customer preferences. Indeed, we may observe that many farmers are searching for new marketing circuits for their products outside the conventional channels – short circuits in many cases (Aubret et al., 2008).
But, in a situation where 90 per cent of Europe (E25) is composed of rural areas – where half of the European population lives (van Leeuwen, 2008), – the European rural features and roots cannot be neglected. However, rural areas have developed different specific characteristics (Gülümser et al., 2008) and thus have become multitasking entities (Vaz and Nijkamp, 2009) and urbanized regions (van Leeuwen and Nijkamp,
2
2006), prompting us to wonder whether the CAP might not be able to achieve new, possibly, surprising results by using new policy instruments. For example, now calling on knowledge assets that earlier would not be connected to agriculture but are nowadays relevant when handling production, processing and marketing, we must accept that, in general, there may exist a diversification of success factors responsible for the positive impacts of the CAP in rural Europe. It seems plausible that this might be the reason why policy makers, in general, are using their power to make actors aware of the need for a more responsible attitude in the creation of “tailor-made” support measures. It is expected that these would enable the reduction of the existing production bias in the agricultural scene, and define long-term goals, involving diverse social participants, even the public at large, and stressing the need for cooperative behaviour.
For the particular case of Portugal, the CAP should have promoted the agricultural sector by achieving increases in the productivity and development of the rural areas. However, despite diversified efforts towards structural aid, we cannot regard the case of Portuguese agriculture as a fully successful example. These activities are not only decreasing as a share of GDP, but they are also decreasing in absolute terms. It is almost shocking to confirm that vegetables production has fallen by about 14 per cent, during the ten-year period considered, while livestock production increased by about 10 per cent.
The available data over that period indicate a deep alteration in the productive system, and, moreover, reflect new trends towards northern European consumption habits. This has taken place in Portugal since the 1980s, and is due to the heavy investment of European distribution chains in the commercialization of food production.
Clearly, serious problems have subsisted as structural difficulties – between 1986 and 2006, the production of the main agricultural products has decreased by 12.6 per cent – so that, in spite of the availability of public aid, agricultural productivity has increased only slowly, as a result of limited technological progress (Table 1). Other expectations related to food self-sufficiency or a more balanced equilibrium in the food trade were, however, not achieved (Table 2).
Table 1: Southern European countries’ labour productivity in the primary sector, for the period 1987 – 1997
Country 1987 (UM/UAL) 1997 (UM/UAL) % change
Portugal 4075 4900 20,2
Spain 8653 15452 78,6
Italy 13041 22469 72,3
Greece 6410 8656 35,0 France 16395 28483 73,7 Source: European Commission, EUROSTAT
3
Portuguese consumption, which is increasingly composed of imports, was more significant in the food industry than in the agricultural production, and it has progressively developed into an increasing loss of self-sufficiency, as shown in the data below (see Table 2).
Table 2: Level of self-sufficiency for the food sector, for the period 1980 – 2000
Sectors 1980 1985 1990 1995 2000
Agriculture 78.4 75.9 80.8 74.6 74.9
Food Industry 93.8 94.1 90.1 85.1 83.6
Food Sector 86.7 83.2 86.4 81.3 80.7
Source: INE, Agricultural Statistics and National Accounts
Some economic lessons and regional trends underline our analysis: after 1986, and due to the accession of Portugal in the European Community (EC), most of the agricultural commercial flows took place within the European Common Market, with two main consequences. Firstly, there was an increase in consumption levels of food and a consequent rise in associated imports. Secondly, international food distribution chains located gradually in the country and accessed a great part of the Portuguese population, starting in the big towns, but soon locating in the small ones too. Both factors drove Portuguese consumption patterns towards those of the other European countries, at a time when producers and industrialists were still not ready to move into new productive processes and new commercial chains as explained in Cunha (2000) or Vaz and Urban (2000).
Over time, farmers have slowly acquired a deeper understanding of the importance of commercial channels and marketing mechanisms for the whole process of agricultural and rural development. The role of national policy makers became crucial to speed up this process and facilitate the way farmers should learn to organize themselves around such common interests. A great deal of these efforts are geographically concentrated in towns or nearby, but, in our opinion, they take far too much time to spread into the peripheral hinterlands. This view will be confirmed later in Section 2.2 of this chapter.
Following Girão (2001), the evolution of Portuguese agriculture at an aggregate level does not allow any conclusions to be drawn regarding the major trends of the sector, even including those that may have resulted from innovative processes. By disaggregating possible determinants of growth, the econometric results observed by the present authors show a stationary tendency for all vegetable production variables. Still, when they exist, the few detected growth factors relate to livestock production, particularly to pork, poultry and milk production, just as has been verified empirically.
4
However, the question arisis: Is the agricultural sector in Portugal so inelastic that, whatever policy measures taken, no positive effects are expected for the vegetable production sectors? Or, rather, on the contrary, could the policy instruments have brought much better results if they had been used more efficiently?
From our point of view, Girão’s (2001) excellent work lacks a regional or spatial perspective, a limitation associated with the sector approach. The two above-mentioned questions represent two extreme positions and do not cover the entire array of factors that combine to determine the success or failure of the CAP instruments. To sustain this argument, the analyses presented in Section 3 of this chapter on dynamics of rural change demonstrate how each of the five Portuguese regions, corresponding to the NUTS II classification, reacted differently to the application of the same CAP instruments, and which sectors were able to take better advantage of those policy measures.
2. The Methods of Analysis
Fortunately, we have in Europe extensive land use data. In general, the comparison between the databases CORINE Land Cover 90 and CORINE Land Cover 2000 – the first step in the proposed methodology – provides results for European, national, regional or local levels. In this study, however, the analyses were undertaken for both the regional and the sectoral dimension at the national level, and the corresponding changes were related to the agricultural policies which were implemented during the ten-year period considered.
While tracking the development for all Portuguese rural areas (except for the Portuguese islands), it was possible to find out how they have followed the evolution of the agricultural sector by subdividing the identified agricultural areas. These have been classified into arable land (non-irrigated arable land, permanently irrigated land, rice fields), permanent crops (vineyards, fruit trees and bushes, olive groves), pastures, and heterogeneous agricultural areas (annual crops associated with permanent crops, complex cultivation, land principally occupied by agriculture but with significant areas of natural vegetation, and agro-forestry areas).
2.1 Land use change
Land use change is a phenomenon that has been very rapid in recent years as a result of human action on the natural environment. One example of land use change and environmental endangerment concerns urban growth, which jeopardizes cultural and natural landscapes (Vaz and Nijkamp, 2008). The use of Geographic Information Systems (GIS) supports our analyses and provides spatial databases for monitoring land use change in Portugal.
5
Developed for the whole Europe in the 1980s, the CORINE Land Cover (CLC) system will serve as our data set. This database is of great importance, as the initial project CORINE Land Cover 1990 (CLC90) had a successor, CORINE Land Cover 2000 (CLC00). The comparison of the data for these time periods allows a dynamic assessment of land use/cover change for the relevant decade on the basis of 25 ha resolution cells. Both data sets have been combined in order to benefit from the main advantage of GIS as tools to analyse, maintain and manipulate spatial data (Longley et al., 2005) permitting the accurate determination of spatial phenomena.
At the 1:100,000 scale, three levels can be separated for CLC. At the more general level, we may assess artificial surfaces, agricultural areas, forests and semi-natural areas, wetlands and water bodies. Subsequent disaggregation of these classes leads to 44 available classes, which adopt the common CORINE nomenclature (Paínho and Caetano, 2006).
We have next synthesized CLC90 and CLC00 by filtering only the desired land classes. The existing CAOP (Carta Administrativa Oficial de Portugal – Official Administrative Portuguese Map, IGP) allowed us to define NUTS II boundaries and assemble a conversion of the original vector data into a raster format in pixel units. Raster format data allowed the quantification and establishment of relative percentages per class giving us a cross-tabulation matrix of change regarding the CLC90 and CLC00 comparison. This allowed the quantification and observation of the dynamics of change regarding the agricultural classes of non-irrigated arable land, permanently-irrigated land, rice fields, vineyards, fruit trees, olive groves, and pastures, as pointed out in Table 3.
Table 3: Changes in farmland in Portugal for the period 1990 – 2000 (in relative percentage)
Pixels→
Land classes↓ CLC 1990 CLC 2000 Variation
Dry lands 100% 105.81% -5.81% Irrigated lands 161.48% 100% 61.48% Rice fields 100% 106.84% -6.84% Vineyards 116.18% 100% 16.18% Fruit trees 104.72% 100% 4.72% Olives 100% 102.73% -2.73% Pastures 108.10% 100% 8.10% Total 101.27% 100 1.27%
Equation given by: (100) – [(100 * maxpixclass)/npixclass], where maxpixclass represents class with
6
It should be noted that there are some reservations concerning the method used. GIS is able to identify those changes which have occurred in the use of agricultural land between 1990 and 2000. This means accepting that the generalization of certain CORINE Land Cover presented classes due to the Minimum Mapping Unit (MMU) of 25 ha may lead to a slight ambiguity in the assumption of land use change (LUC). This paradigm of LUC comparison is always present and should be considered from the perspective of the scope of study. In our case, as spatial dynamics is assessed at national level, we conclude that the MMU does not interfere much, as the study itself is performed more at a macro-scale.
2.2 Proximity to towns
A comparison of CORINE land cover sequences with social statistics of population per urban area allows us to deploy quantitative selection criteria of rural dynamics having from the perspective of the influence of urban centres upon agricultural development. This concept relates the direct attribute of spatial proximity, as well as the clear concept of spatial enthalpy formation around urban areas (Tobler, 1975), to the concept of the distribution of agricultural production in the peripheral areas of Portugal.
Von Thünen’s agricultural land use model has clearly inspired our approach. In addition, we have assumed that all agricultural land use activity maximizes productivity by locating at the most convenient distance from the market and that the major factors which determine increases in productivity are related to production costs and market prices. Although the relationships between agricultural land use and market distance may be very difficult to establish in the contemporary context, we should not neglect the strong link between the transport system and regional agricultural land use patterns, as proposed in the 19th century by Von Thünen – our model searches for such patterns.
In order to develop our analyses, we have used as instruments of spatial cognition a set of agricultural classifiers, in particular those already used in the previous Section 2.11, and all those cities in Portugal with a population of over 10,000 inhabitants. Spatial nests were encapsulated by creating Euclidean distance buffers from 5 to 50 kms divided in 5 km intervals from the vector point-defined urban centres. These spatial classes allowed the observation and quantification of surveyed agricultural classes, so as to establish a relation between agricultural CORINE-identified raster classes and town proximity. The results were converted into a matrix in which CORINE land cover’s agricultural classes became observable for each of the Euclidean distance buffer layers
1
Arable land (non-irrigated arable land, permanently irrigated arable land, rice fields), permanent crops (vineyards, fruit trees and bushes, olive groves), pastures, heterogeneous agricultural areas (annual crops associated with permanent crops, complex cultivation, land principally occupied by agriculture with significant areas of natural vegetation, and agro-forestry areas).
7
(distance classes). Decomposition of such a matrix was made not only for CLC2000, but also for CLC90, in order to assess the overall tendency of CORINE land cover’s variation with regard to spatial distance to urban centres (Resulting from CLC200 – CLC90). Thereby, we were able to create a temporal, as opposed to a static, comparison, which assessed the evolution of agricultural classes in a dynamic context. Because of their correlation matrix, raster format data are elegant solutions to understand such dynamic processes. Thus, conversion was used for rural assessment and quantification of surveyed CORINE data, while buffer distances were considered as vector shape files. The use of such formats as rasters and vectors for different circumstances and in GIS is well-documented and widely acknowledged (Longley et al., 2005).
3. Dynamics of Rural Change
3.1 Policy-oriented impacts by sector and region
Since Portugal’s accession to the EC in 1986, the CAP has been the main instrument to promote both rural and regional development by means of increasing production of agricultural activities. Those CAP measures, practised over the decades, have been the bastion of growth and development for so many European agricultural regions, but, curiously, and as already discussed, in Portugal, they did not produce the same expected positive results.
Frequently, some have argued that the CAP was specifically formulated for Northern Europe, as it included protective policies towards products such as cereals and milk rather than those with more southern characteristics such as wine, olives or horticultural products. However, others, who are aware of the nature of the overall policy context in Portugal, suggest that not only has there been a restrictive tendency resulting from the absence of an adequate support system specifically for Mediterranean products, but, more important, also a fragile governance structure has lacked those contributions so essential for modern agriculture. Marketing and improving cooperative efforts are two examples of a range of important tools which should have been promoted by a clear national political will and strategy.
In this chapter, we observe the effective changes in the use of land for agricultural purposes in the period when the CAP was operating at its fullest extent in the country and formed the basis for the reform measures. After this period, and after 2003, new policy instruments have become effective: single payment entitlements, decoupling, modulation, and cross-compliance were the new instruments for a two-step model in which the European Commission expected to create a progressive framework, as well as to dismantle planting rights in order to achieve more sustainable rural development.
8
It is essential to understand the double effect resulting from the land use change for the observed period: 1990-2000. The reform, starting in 2003, has completely changed the way in which the EU supports its farm sector. In a trial to give EU farmers the freedom to produce what the market needs, the vast majority of subsidies are being paid independent of the volume of production and in conformity with the goals of sustainable development, even if this includes land abandonment. Thus, today, the bigger are those areas of farmland that have been used in the past, the greater the advantages for the present and the future. Therefore, to understand how land use change has occurred may become crucial for the effective evaluation of, and future prospects for, Portuguese rural areas.
Accompanying Annex 1, Figure 1 illustrates the land use changes which have occurred in Portugal, in the period 1990-2000. We calculated the total areas of arable land (non-irrigated arable land, permanently irrigated land, rice fields), permanent crops (vineyards, fruit trees and bushes, olive groves), and pastures. The observed changes show the different propensities of regions to adapt to the same CAP instruments, which indicates distinct tendencies for each one of those agricultural sectors.
Considering the five NUTS-II Portuguese regions of Portugal – North, Centre, Lisbon and the Tagus Valley, Alentejo and Algarve (excluding the islands) – we can draw various interesting conclusions:
First, close observation of the land used for agricultural activities by region shows that the application of the CAP has had a clear positive impact on the area of new irrigated fields in the central and southern part of the country. The increase in vineyards indicates a clear choice for quality wine: the North, Alentejo and Algarve have greatly increased their cultivated area. This supports the idea that wine production has significantly expanded in the Douro area, which has been strongly competing to produce brands recognized for their quality; in this region, contrary to the rest of the country, the irrigated areas have decreased. Growers of fruit trees also took advantage of the CAP in the northern region.
Secondly, in all regions (with exception of Algarve where citrus fruits occupy most of the agricultural land), non-irrigated annual crops have a major dominance. Alentejo is clearly the region with the highest percentage of dry land. Nevertheless, during this period, the amount of irrigated land in this region has doubled, providing an enormous opportunity for new crops. Still, Alentejo is the only Portuguese region that decreased its farmed area on account of a reduction of dry lands and much less pasture. As the total cultivated area has decreased from 75 to 70 per cent, it is evident that the region was not able to fully benefit from the FEOGA support systems. When comparing the data for all regions, we realize that both North and Algarve (eventually) were the two regions to take, in general, the most advantage of these systems.
9
10
Thirdly, land use in the Lisbon region has clearly changed: the use of the CAP instruments has resulted in a transfer of land use from non-irrigated to irrigated crops and the reallocation of areas devoted to olive plantations and pastures to rice fields and fruit trees. This region, which contains the Tagus Valley, has experienced the most extensive change in the allocation of land to different crops. It may be opportune to explain that this region is the home of the tomato processing industry, which may suggest the presence of a potential cluster related to the food industry in the long run.
It is also interesting to detect how pastures have decreased during the observed period, with exception of the Algarve. This result does not match with the developments which have occurred in the diet that is now much richer in dairy products. Açores, one of the group of non-observed Portuguese islands, is in fact the greatest producer of milk and butter. Not including the production of this region may explain the obtained data. In addition, intensive cattle production is a possible justification for the result. The results for the Algarve are tricky: using CORINE methods to track land use change is very reliable, but satellite imagery cannot distinguish the actual use of the cultivated areas. For instance, the classification for pastures would be confused with that of golf courses – a newcomer in the land use choices of the southern region. Although this has nothing to do with the financial supports for agricultural activities, we should bear in mind that it represents an interesting case study related to new trends in rural environments.
Finally, the use of water for agricultural activities is increasing in Portugal. Although in that country non-irrigated annual crops are those which have a major presence, there is, nevertheless, a significant decreasing tendency to grow non-irrigated annual crops in all the Portuguese regions. Indeed, permanently irrigated lands have increased significantly in Lisbon, Centre and Alentejo, justifying the flourishing production of a few horticultural crops. The new infrastructure Alqueva in Alentejo will allow that region to become in the future one of the Portuguese regions that will grown more crops on irrigated land.
In general, the traditional Portuguese rice fields have remained almost unchanged for the observed period, although they have been relocated to the Lisbon region. In spite of hard international market conditions with wines coming from the “New World” (Gatti et al., 2003), the wine production has increased significantly in Portugal, although it is concentrated in only a few regions. The main reason for this is that land for vineyards is restricted by government licensing and does not follow market pressures. Both cases indicate that a more rational and productive production process started its way during the observed period, creating the expectation of a few, but positive, impacts for the following years.
Even though the EC has developed a large number of supports for indigenous trees, the effects of such instruments on the cultivation of olive trees were not effective, except for the Algarve. The used surface stayed almost constant in most of the country.
11
The use of land changed significantly in the Algarve where there has been a very important increase in irrigated lands and also vineyards. However, all this is at the cost of much less use of dry lands.
Briefly, an overall view of the global data shows that, for the decade 1990-2000, the land used in Portugal for agricultural activities has expanded only very slightly in most of the five considered regions: 3.32 per cent in the Northern region, 0.79 per cent in the central area, 0.15% in Lisbon and the Tagus Valley, and 3.03 per cent in Algarve. Alentejo, the historical agricultural region devoted to cereals and cattle, slightly decreased its farmed area. When considering each of the agricultural sectors, dry land culture has given way to vast increase in land used for irrigated crops: vineyards in particular, and pasture lands and fruit trees in a more reduced form.
3.2 Policy-oriented global impacts by town proximity
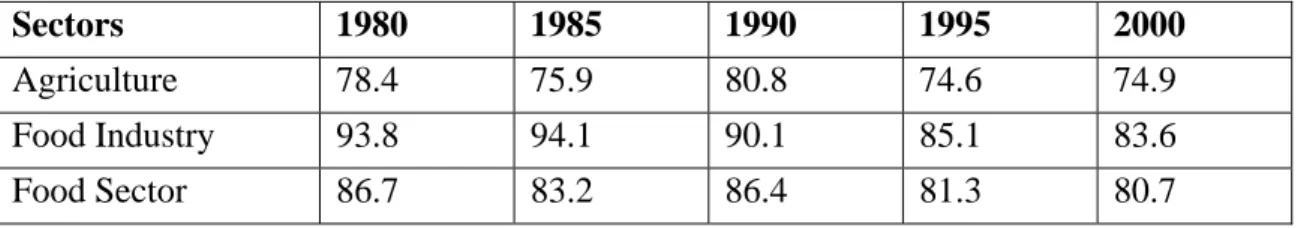
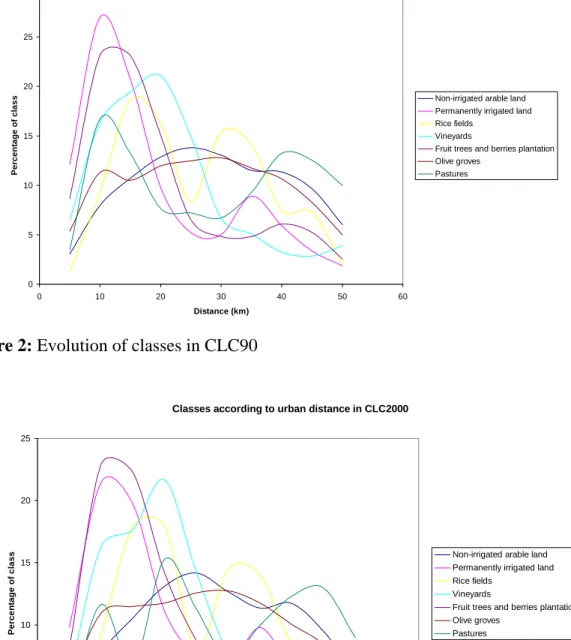
The application of the methodology suggested in Section 2.2 of this study allowed an evaluation of how intensively the considered crops grow in terms of distance to the nearest located town. Figure 2 shows the relative percentages of each product class for the year 1990, which have been analysed using the same aforementioned classes: non-irrigated arable land, permanently non-irrigated land, rice fields, vineyards, fruit trees and bushes, olive groves and pastures. With the exception of non-irrigated pasture lands and olive groves, all the other classes were concentrated within a distance of 10 to 20 km from towns; vineyards may extend up to 30 km, decreasing fast soon after. In the case of rice fields and pastures there is a bimodal distribution with the highest concentration points at 15 km and 30 km for rice and 10 km and 40 km for the pastures. Anyhow, after 50 km these types of land use decreases to less than half a per cent. Figure 3 shows that for the year 2000 those earlier tendencies have remained almost unchanged, although in general, the results indicate a tendency to concentrate production even more near to the towns – this meaning within a distance of less than 30 km.
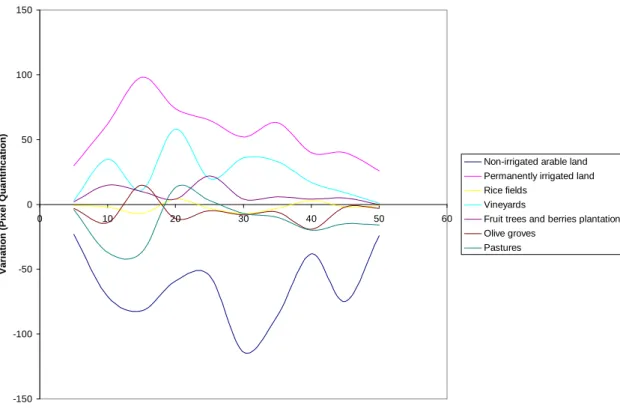
From Figure 4, which represents the variation which has occurred during the considered timeframe (1990 – 2000), we observe that:
1) Land use change has taken place differently for the different products;
2) Non-irrigated crops have decreased significantly along the different distances considered, mostly at a distance of about 30 km from town centres and have not been substituted by other crops;
3) Nearer to towns those non-irrigated crops have been substituted by irrigated crops, vineyards and fruit trees, almost exclusively;
4) Hinterlands located far from towns (far representing a distance over 40 km) have lost intensity in the use of land.
12
Classes according to urban distance in CLC90
0 5 10 15 20 25 30 0 10 20 30 40 50 60 Distance (km) Per cen ta g e o f cl a s
s Non-irrigated arable land
Permanently irrigated land Rice fields
Vineyards
Fruit trees and berries plantation Olive groves
Pastures
Figure 2: Evolution of classes in CLC90
Classes according to urban distance in CLC2000
0 5 10 15 20 25 0 10 20 30 40 50 60 Distance (km) P e rc en ta g e o f cl as
s Non-irrigated arable land
Permanently irrigated land Rice fields
Vineyards
Fruit trees and berries plantation Olive groves
Pastures
13 -150 -100 -50 0 50 100 150 0 10 20 30 40 50 60 Distance (km) Va ri a ti o n ( P ixel Q u an ti fi cat io n )
Non-irrigated arable land Permanently irrigated land Rice fields
Vineyards
Fruit trees and berries plantation Olive groves
Pastures
Figure 4: Variation in classes (CLC2000-CLC90)
4. Final Considerations
Our study confirms, from a different perspective, those conclusions already drawn by Vaz (2008). The application of the CAP in Portugal did not bring the results that policy makers and farmers would have wanted or expected. A few agricultural products however, did survive an internal economic policy that for decades promoted services ahead of industry and which profited from the financial support of the European Community.
The results shown in Figure 1 represent the effective area used for agricultural activities in Portugal but they mean less than they would have done if increases in productivity had matched those of the other European countries, which was not the case. To make a justification or claim responsibility for these results is not possible, unless we pursue the real causes for this situation. Could it have been the lack of strategies linking the food industry to agricultural production? Could it have been because most of the producers were unable to combine forces and create those structures required for commercializing their goods, in spite of the specific European support schemes given to producer organizations? Notwithstanding all this, the CAP has completely transformed the extent of the irrigated surface, and wine and a few fruits were able to adapt to the new market tendencies.
14
In more detail, we can assume that the land use changes suggest a positive reallocation of agricultural production to those areas close to towns where marketing possibilities are better. Moreover, this reallocation reduces energy costs.
The major conclusion of our work is that the use of the CAP financial support has accentuated the asymmetric distribution of crops. This phenomenon should be further investigated in other activities taking place in the rural areas, such as cultural events, extreme sports, or tourism.
This conclusion is evident, since towns as market places provide those services and tools to use financial support. But we have just demonstrated that their efficiency decreases with distance. Hence, in terms of policy impacts, our results call for a specific effort not to use indiscriminate short-term financial support: it is necessary to evaluate the risk of asymmetric development or to create other complementary instruments for those hinterlands that will progressively lose.
Specifically for the Portuguese case, the trade-offs between political help and structural change in the decline of agricultural production has not occurred, exactly as foreseen some time ago by Girão (2001). Most of the positive impacts in the sector resulted from international market trends and farmers’ self-awareness in pursuit of more effective organizational forms. However and fortunately, the CAP now has a new vision, searching for alternative forms to better sustain the rural world no longer based solely on agricultural production.
The multitask functioning of rurality (see Vaz and Nijkamp, 2009) and multifunctional agriculture (van Huylenbroeck and Durand, 2004) should be faced in Portugal as a major challenge and a possible solution to maintain population in those distant hinterlands that once were mainly used for agricultural production. Apart from agricultural activities, in the Portuguese rural areas, other factors should be pursued as tools for sustainable development. As demonstrated, small towns have a major role to play and their interfaces with the new upcoming multitasking activities should be important examples to follow and monitor.
Our contribution aimed to open up prospects for a much better understanding of rurality when all those factors which contribute to its sustainability – much broader than just agricultural activities – will be evaluated using the methods described here and a long-term strategy period could enable targeted policies. The upcoming CORINE Land Cover 2010 provides new possibilities, while the matching of such data with urban growth and knowledge flows in peripheries may help even further. Hence, this paper sheds also some light on how new trends in the rural world may be analysed in future.
15 References
Aubret, P., Denechere, F., Durand, G., and Marechal, G. (2008), “Systèmes Alimentaires Territorialisés : les circuits courts comme vecteurs de développement territorial”, ALFATER2008, Mar del Plata, Argentine, 27-31 October 2008
Cunha, A. (2000), A Política Agrícola Comum e o Futuro do Mundo Rural, Pub: Plátano, Lisboa
Direcção Geral de Agricultura, Portuguese Ministry of Agriculture and Fisheries, different years European Commission, EUROSTAT, Agrícolas Agricultural Statistics, different years
Gatti, S., Giraud-Héraud, E., and Mili, S. (eds) (2003), Wine in the Old World, Franco Angeli, Milano, Italy
Gülümser, A. A., Baycant-Levent, T., and Nijkamp, P. (2008), “A Comparative Analysis of Rurality at the EU Level and Turkey” in: De NoronhaVaz, M.T., Nijkamp, P. and Rastoin, J.L. (eds), Traditional food production and rural sustainable development: A European Challenge, Ashgate, Aldershot, UK (forthcoming)
IGP, Instituto de Geografia Português, Carta Administrativa Oficial de Portugal, versão 6.0 INE, Instituto Nacional de Estatística, Estatísticas Agrícolas, INE, Lisboa, different years INE, Instituto Nacional de Estatística, Contas Nacionais, INE, Lisboa, different years
Girão, J. A. (2001) A Agricultura Portuguesa: Em Passeio Aleatório ou em Regime Estacionário? in Instituto, Financeiro, Agricultura ,Economia e Sociedade, Lisboa, IFADAP, 2001
Longley, P. A., Goodchild, M. F., Maguire, D. J., and Rhind, D. W. (eds) (2005), Geographic Information Systems and Science, John Wiley & Sons, 2nd Edition
Paínho, M., and Caetano, M. (2006), Cartografia de Ocupação do Solo: Portugal Continental, 1985-2000: CORINE Land Cover 2000, Instituto do Ambiente
Tobler, W. (1975), Spatial Interaction Patterns, IIASA Research Reports, Laxenburg
van Huylenbroeck, G. and Durand, G. (eds), (2004), Multifunctional Agriculture: a New Paradigm for European Agriculture and Rural Development, Aldershot, Ashgate
van Leeuwen, E. (2008), “Towns Today: Contemporary Functions of Small and Medium-sized Towns in the Rural Economy”, Habiforum, the Netherlands
van Leeuwen, E. and Nijkamp, P. (2006), ‘The Urban-Rural Nexus; A Study on Extended Urbanization and the Hinterland’, Studies in Regional Science, 36, no.2, pp. 283-303 Vaz, E. (2008), GIS from a Cultural Heritage Perspective: When Past and Future Collide, MSc
Thesis, Superior Institute of Statistics and Information Management, New University of Lisbon
Vaz, E., and Nijkamp, P. (2008), Historico-cultural sustainability and urban dynamics – A geo-information science approach to the Algarve area in: Giovanni Maciocco (ed), Place for Leisure/Place for the City, Series: Urban and Landscape Perspectives, Springer-Verlag, Berlin (forthcoming)
Vaz, M.T.N. (2008), The Portuguese Agriculture and Fisheries at the Start of the Millennium: Is There a Way Out? Options Méditerranéennes, Serie B/nº61, CIHEAM, Montpellier, France pp. 383-408
Vaz, M.T.N. and Nijkamp, P. (2009), “The Multitask Functioning of the Rural World: technological change and sustainability”, International Journal of Environmental Technology and Management, Special Issue on “Sustainability and Rurality” (forthcoming)
Vaz, M.T.N. and Urban, L. (2000) "Régions périphériques, stratégies agroalimentaires et globalisation", Economie et Societé, Série "Systèmes agroalimentaires", AG, nº 24, Pgs 49 – 60, L'ISMÉA, France
16 ANNEX 1
Changes in agricultural land, 1990 – 2000
Types of land cover
Pixels 1990 % CLC 1990 Pixels 2000 % CLC 2000 %Variation
North dry lands 15274079 44.95 14996963 42.72 -1.81
irrigated lands 2300579 6.77 2269421 6.46 -1.35 rice fields 0 0.00 0 0.00 0.00 vineyards 7826307 23.03 8975078 25.57 14.68 fruit trees 2486244 7.32 2716682 7.74 9.27 olives 4507380 13.27 4565293 13.00 1.28 pastures 1582459 4.66 1582619 4.51 0.01 Total 33977048 35106056 3.32
Lisbon dry lands 1324335 3.90 982054 2.80 -25.85
irrigated lands 1061423 3.12 1853100 5.28 74.59 rice fields 294938 0.87 333559 0.95 13.09 vineyards 1064852 3.13 1111742 3.17 4.40 fruit trees 66779 0.20 58879 0.17 -11.83 olives 53638 0.16 40873 0.12 -23.80 pastures 774485 2.28 267035 0.76 -65.52 Total 4640450 4647242 0.15
Centre dry lands 14798109 43.55 14239093 40.56 -3.78
irrigated lands 3086741 9.08 3749816 10.68 21.48 rice fields 1214193 3.57 1223383 3.48 0.76 vineyards 8828776 25.98 9235840 26.31 4.61 fruit trees 3536422 10.41 3604428 10.27 1.92 olives 7810756 22.99 7526179 21.44 -3.64 pastures 620847 1.83 631089 1.80 1.65 Total 39895844 40209828 0.79
Alentejo dry lands 83800186 246.64 77960361 222.07 -6.97
irrigated lands 5610184 16.51 11265299 32.09 100.80 rice fields 4069514 11.98 3779804 10.77 -7.12 vineyards 2800732 8.24 3816999 10.87 36.29 fruit trees 595240 1.75 688492 1.96 15.67 olives 15423883 45.40 14879431 42.38 -3.53 pastures 2191896 6.45 1103688 3.14 -49.65
Total 1.14E+08 1.13E+08 -0.87
Algarve dry lands 1249355 3.68 1099069 3.13 -12.03
irrigated lands 231919 0.68 295215 0.84 27.29 rice fields 4968 0.01 0.00 0.00 -100.00 vineyards 68972 0.20 143693 0.41 108.34 fruit trees 2823058 8.31 2921376 8.32 3.48 olives 13112 0.04 16623 0.05 26.78 pastures 141112 0.42 194037 0.55 37.51 Total 4532496 4670013 3.03