Brazilian Journal of Geophysics (2019) 37(4): 357-368 © 2019 Sociedade Brasileira de Geofísica ISSN 0102-261X
www.rbgf.org.br
DOI: 10.22564/rbgf.v37i4.2014
SEISMIC STRATIGRAPHY OF TRAPANDÉ BAY (SOUTHERN BRAZIL) TO STUDY SEA-LEVEL
CHANGES AND DEPOSITION EVOLUTION IN THE UPPER QUATERNARY
Vinicius S. Rodrigues
1, Daniel P. V. Alves
1, Luigi Jovane
1and Luis A. P. de Souza
2ABSTRACT. The Quaternary relative sea-level in the Southeastern Brazilian margin is mostly studied using a sedimentary approach. In this work, we used high-resolution seismic and bathymetric data to study the depositional evolution in the Quaternary of Trapandé Bay, in São Paulo State, Brazil. Using seismic stratigraphy, we have analyzed over 198 km of seismic sections and we interpreted 6 seismic horizons which defined 5 seismic units. The oldest unit (U1) is related to the highstand deposits developed during Marine Isotope Stages (MIS) 5. The horizon H1 represents the erosional surface formed during the regression that culminated in the Last Glacial Maximum (LGM). After that, during the first stabilization period of sea-level rise, unit U2 formed and was subsequently eroded by a rapid flood of the bay, forming the erosional surface H2. During middle and late Holocene, it was identified a transgressive tract in the unit U3 and a progradational facies in unit U4, limited to the more coastal regions. Finally, unit U5 developed in Late Holocene, with depositional characteristics similar to those of present time. We found none seismic expression of Late Holocene high-frequency relative sea-level oscillations.
Keywords: seismic stratigraphy, Quaternary oceanography, paleochannels, Cananéia-Iguape, Holocene Transgression, relative sea-level.
RESUMO.As variações relativas do nível do mar na margem sudeste do Brasil são estudadas principalmente a partir de uma abordagem sedimentológica. Neste trabalho, foram utilizados dados batimétricos e sísmicos de alta resolução para o estudo da evolução deposicional do Quaternário na Baía de Trapandé, no Estado de São Paulo, Brasil. Utilizando uma análise sismoestratigráfica, foram analisados mais de 198 km de seções sísmicas e interpretados 6 horizontes sísmicos que definiram 5 unidades sísmicas. A unidade mais antiga (U1) está relacionada com os depósitos de mar alto desenvolvidos durante o Estágio Isotópico 5. O horizonte H1 representa a superfície erosiva formada durante a regressão marinha que culminou no Último Máximo Glacial. Em seguida, durante a primeira estabilização da subida do nível do mar, a unidade U2 se depositou e em seguida foi erodida por um rápido afogamento da baía, formando a superfície erosiva H2. Durante o Holoceno médio e tardio, foram identificados um trato transgressivo na unidade U3 e fácies progradacionais na unidade U4, sendo estas últimas limitadas às áreas mais costeiras. Finalmente, a unidade U5 se desenvolveu durante o Holoceno tardio, com características deposicionais similares àquelas atuais. Não foram encontradas expressões sísmicas das oscilações de alta frequência do nível do mar do Holoceno tardio.
Palavras-chave: sismoestratigrafia, oceanografia do Quaternário, paleocanais, Cananéia-Iguape, Holoceno Transgressão, nível do mar relativo.
Corresponding author: Vinicius S. Rodrigues
1Universidade de São Paulo, Instituto Oceanográfico, Praça do Oceanográfico, 191, 05508-120, São Paulo, SP, Brazil – E-mails: [email protected], [email protected], [email protected]
INTRODUCTION
The reconstruction of the sedimentary evolution of coastal plains can provide information about paleoenvironmental changes driven by glacio-eustasy and climate (Rossi et al., 2011). The climate variability in the Quaternary retains great importance in the global sea-level changes due to the melting and freezing of continental polar ice influenced by Milankovitch cycles (McHugh et al., 2017). During the alternated regressive and transgressive sequences generated by these oscillations in the Quaternary, coastal processes driven by hydrodynamic mechanisms, atmospheric circulation and rivers run-off interacted with geological and geomorphological processes, as those connected with tectonic and eustatic movements, resulting in the formation and evolution of Brazilian sedimentary plains (Suguio et al., 1985).
The sea-level changes observed during the Quaternary have been usually inferred through cores samples and biochronostratigraphy (Suguio et al., 1985; Angulo et al., 2006), however, the use of the seismic stratigraphy can also provide evidences of sea-level changes (Mitchum et al., 1977; Vail et al., 1977; Yoo & Park, 2000; Koša, 2015; Yoo et al., 2016), particularly studying the spatial distribution of the sedimentary formations during those events (Koša, 2015; Liu et al., 2016). The high-resolution shallow seismic stratigraphy is a geophysical method for visualization of recent geological events, like the ones that occurred during the Quaternary (Souza, 2006). Moreover, it offers the possibility of a regional analysis of the sedimentary packages, as the records are acquired in high vertical and horizontal resolutions in seismic sections of hundreds of meters. The Cananéia-Iguape system is a UNESCO Biosphere Reserve since 1991 (Mahiques et al., 2013) and the comprehension of its depositional history is essential to better understand how it could change in the future. Presently, the knowledge about the sea-level oscillations during the Late Quaternary in the region is based on an ancient curve developed by Suguio et al. (1985), which is based on sedimentological data. In order to add to the knowledge of those oscillations, this work brings new contributions to the study of the processes that formed and changed the southernmost portion of the estuarine/lagoon complex of Cananéia-Iguape, in the Trapandé Bay. High-resolution seismic data aided the creation of one deposition model for the Trapandé Bay regarding the sea-level oscillations from the Upper Pleistocene. Furthermore, this study aims to rebuild the paleotopography of Trapandé Bay
and to comprehend how it influenced the deposition changes through time.
STUDY AREA
Located in the southern coast of São Paulo State (Brazil, Fig. 1), the Cananéia-Iguape complex consists in a lagoonal and an estuarine system combined with several channels and a dense mangrove vegetation. It has a great environmental and economic importance, as it is nursery for several species (Mahiques et al., 2013). In addition, the whole system suffered huge changes since the 19th century after the opening of the Valo Grande artificial channel, which connected the Ribeira de Iguape River to the system (Geobrás, 1966; Cornaggia et al., 2018).
The whole Cananéia-Iguape system is connected to the Ribeira de Iguape River drainage basin, the largest of the S-SE Brazilian coast, which comprises about 25,000 km² (Mahiques et al., 2013), and is the most extensive coastal plain of Quaternary sedimentation from the entire São Paulo State shore (Suguio & Barcelos, 1978). The Cananéia-Iguape sedimentary plain is bordered by a Precambrian crystalline metamorphic basement arc, named Serra do Mar which is bounded to the Açungui Group (Souza et al., 1996; Tessler, 1982) and is marked by uplifting of a series of Mesozoic intrusive alkaline complexes. As an example, the Cananéia alkaline rock massif (São João Hill) is a small elevation densely vegetated, with 137 m maximum height and about 450 m² area (Cornaggia et al., 2018). Furthermore, Comprida Island also hosts a smaller rocky massif namely Morrete (Riccomini, 1995).
This work was developed in the Trapandé Bay, a 25 km² area in the southernmost portion of the Cananéia-Iguape system, between 24°40’S to 25°05’S and 47°25’W to 48°10’W (Fig. 1), formed by the confluence of three channels: Cubatão Sea, Cananéia Sea and Ararapira Channel. The bay is also enclosed by three islands: the Cananéia Island to the west, the Comprida Island to the east and the Cardoso Island to the south. North of the bay, the Ribeira de Iguape River outflow reaches the system in two places: the Valo Grande Channel (55 km northwards) and the river mouth itself (15 km north of Valo Grande).
The sea-level changes in the coastal plain of Cananéia have been studied in several works, as Suguio & Barcelos (1978), Suguio & Martin (1978), Suguio et al. (1985), Angulo et al. (2006), Suguio et al. (2003). In summary, the formation of the Cananéia-Iguape plain involved, at least, 5 main stages (Suguio et al. 2003): (1) during the Cananéia Transgression (about 120 ka) the sea-level was about 8±2 meters above present level and reached the foot of Serra do Mar hills, indeed the high sea-level
RODRIGUES VS, ALVES DPV, JOVANE L & SOUZA LAP
359
Figure 1 – Aerial view from Trapandé Bay, located in the south portion of Cananéia-Iguape Estuarine-Lagoon System, São Paulo – Brazil. The pink lines represent the
acquisition track lines from the survey.
condition allowed the deposition of fine-grained sediments; (2) in the following regression, several beach-ridges formed along the area; (3) following this, the relative sea-level fell to about -110 m during the Last Glacial Maximum, around 17.5 ka (Corrêa, 1996), as a consequence, the rivers eroded the sand deposits of the last transgression; (4) after that, sea-level raise until the last transgressive maximum (Santos Transgression, about 5.2-5.5 ka), when the high sea-level reached about 4 to 5 meters above present level, therefore forming an extensive lagoon system, with clayey-sandy sediments and often rich in organic matter; (5) finally, after that maximum, it is suggested that some short-term oscillations may have occurred and allowed the deposition of new beach-ridges. Related to the last two stages, Angulo et al. (2006) suggest that the last Holocene maximum was about 3 meters and it fell to the present level was much smoother than previously indicated (Fig. 2).
In an earlier seismic stratigraphic study of the Cananéia-Iguape system, Souza (1995) identified two main
seismic horizons: (1) a deeper one related to the regressive event of about 17 ka; and (2) a shallower one related with the base of Santos Transgression recent sedimentary packages. In addition, Gandolfo et al. (2001), using ground penetrating radar, identified sedimentary sequences related to regressive and transgressive events from the Holocene. Giannini et al. (2009) recognized the deeper acoustic reflector founded by Gandolfo et al. (2001) as being the contact between two different sand units, probably from the Holocene and Pleistocene.
METHODS
In two campaigns (October/2011 and July/2014) we acquired 214 high-resolution seismic sections in the Trapandé Bay, using a Meridata MD-DSS system for both acquisitions, resulting in over 198 km of seismic data. In the 2011 campaign, we used 0.3-1.5 kHz boomer seismic profiler with a single channel 50-meter streamer, a 2-9 kHz chirp seismic profiler, and a 24 kHz pinger echosounder, with a DGPS system for positioning. In the 2014
Figure 2 – Relative sea-level curves for (a) the last 120 ky globally (Hobbs et al., 2015); and for the Brazilian coast (b) for the last 35 ky (Curray, 1965; Milliman &
Emery, 1968; Kowsmann & Costa, 1974; Corrêa, 1996); (c) for the last 7 ky (Martin et al., 1980; Angulo et al., 2006); and (d) since the LGM (Furtado, 2013).
campaign, we repeated the seismic sources and replaced the 24 kHz pinger by a two-frequency echosounder (28 and 200 kHz) system. However, due to the low penetration of chirp seismic signal in the sediments, in this work, we only used boomer data in our interpretation, besides the echosounder data for the bathymetry.
We used the software Meridata SView4 and Seismic Unix (Stockwell, 1999; Cohen & Stockwell, 2017) for seismic data processing and visualization. For boomer seismic data, we applied the following process flow: (1) Bandpass filter in the range 0.35 to 1.25 kHz; (2) Time Varied Gain (TVG), which compensates the seismic signal with time differences; and (3) Automatic Gain Control (AGC), which compensates fast temporary changes in the reflection amplitudes. The multiple reflections were not removed from the single channel seismic data.
For data interpretation and horizon mapping, we used Meridata MDPS software to develop a stratigraphic model relying on the seismic horizons and units identified in the seismograms, according to the general principles of seismic described by authors as Mitchum et al. (1977), Vail et al. (1977) and Posamentier & Allen (1999), and summarized by Catuneanu et al. (2009). Those principles consisted mainly of determining reflectors terminations, truncation, and erosional surfaces. For surface data visualization, we created Digital Terrain Models (DTM) from the seismic horizons using Quantum GIS (QGIS, 3.2),
using the triangular irregular network as the interpolation method. In addition, we calculated the isopach maps for the seismic units U1 and U2, by raster subtraction also in QGIS. Before that, for time-depth conversion, we used an average sound velocity of 1,500 m.s-1, both for water column and the sediments, which is
consistent with sandy and silt-sandy sediments (Hamilton, 1970, 1978; Kim et al., 2001). Paleotopographic maps for horizons H3 and H4, and isopach maps for units U3 and U4 were not calculated because of the lack of continuity and short distribution of horizons H3 and H4 across Trapandé Bay.
RESULTS
Five seismic horizons and the acoustic basement top (AB) were interpreted on most of the seismic sections. The seismic horizons were named from the deepest to the shallowest H1, H2, H3, H4, and the seabed, defining 5 seismic units: U1, from AB to H1; U2, from H1 to H2; U3, from H2 to H3; U4, from H3 to H4; and U5, from H4 to seabed. Among the several seismic sections studied, two sections are here presented in order to exemplify the seismic facies found on the data (Figs. 2 and 3 and Tab. 1). AB presents chaotic and/or transparent reflections, with acoustic signal loss with depth. In some places, the acoustic basement consists of a sharp conical-shaped body while in others tabular with a flat top. Defined between AB and H1, the seismic unit U1 has consistent laterally continuity and it was identified in several
RODRIGUES VS, ALVES DPV, JOVANE L & SOUZA LAP
361
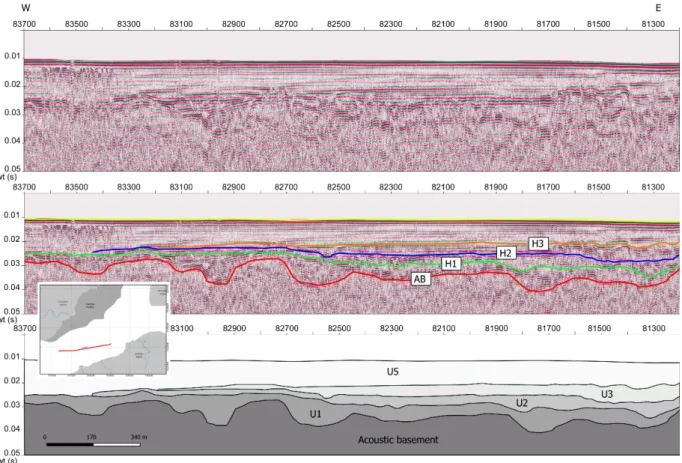
Figure 3 – Seismic section (above) of line 124447, with a longitudinal orientation in relation to the channel, showing the seismic horizons interpreted: AB in red, H1
in green, H2 in blue, H3 in orange and the seabed in yellow. Below, the interpreted seismic units U1, U2, U3, and U5, as well as the acoustic basement.
seismic sections. H1 represents an unconformity surface related to an erosional event, as we observed truncation of the underlying reflectors. Internally, the unit has sub-parallel reflectors with a high amplitude acoustic signal. The unit U2 is defined between H1 and H2, which also represents an erosional surface. Internally, U2 has parallel to sub-parallel reflectors with medium to high amplitudes. Interpreted in few seismic sections, the unit U3 has sub-parallels to minor areas with sigmoidal reflectors, generally discontinuous and with medium to high amplitudes. Unit U3 top surface (H3) follows the seabed morphology with high amplitude. Also interpreted in few seismic sections, unit U4 has H4 as its top surface, with homogeneous and continuous plane-parallel reflectors with downlap terminations onto horizons H2 and H3. The seismic unit U5 comprises the sediment layer between H4 and the seabed. As well as U4, U5 has plane-parallel low amplitude inner reflectors.
Present bathymetry (Fig. 5a) and paleotopographic maps (Figs. 5b, 5c, and 5d, in meters below present sea-level) were developed in order to position the present and ancient seabed in
relation to sea-level during the Pleistocene and Holocene. For H2 surface (Fig. 5b), most of the bay area is located over 20 mbsl, excluding the central channel and the entrance of the bay. For H1 surface (Fig. 5c), most of the bay area is below 30 mbsl, showed by blueish colors. The acoustic basement is located mostly below 50 mbsl, with the exception to the innermost region where it reaches between 5 and 10 mbsl.
The isopach maps for the units U1 and U2 (Fig. 6) show very different thickness for both units that can be related to the different characteristics of the depositional sequence. Whereas unit U1 has a maximum thickness of 26 meters and an average of 9 meters, unit U2 has a maximum thickness of 14 meters and an average of 6 meters. The thicknesses distribution of U1 is explained by the topography of AB (Fig. 5d), as the deposition during U1 development filled the deepest regions of AB top surface, resulting in areas with thicker sedimentary package concentrated in the deeper regions of AB and thinner layers on the paleo-heights. On the other hand, the U2 thickness distribution
Table 1 – Seismic facies from seismic units and horizons interpreted in the Trapandé Bay area.
Unit/Horizons Amplitudes Seismic facies Seismic examples
1 AB to H1 High amplitudes
AB presents chaotic reflections (right) of low amplitude with both tabular and conical morphologies; H1 has with irregular morphology and it truncates the reflectors below it. Reflections in U1 follows the geometry of AB (left).
2 H1 to H2 Medium to high
amplitudes
Sigmoidal reflections (left) with some consistent parallel reflector in some areas; H2 has with irregular morphology and it truncates the reflectors below it (right).
3 H2 to H3 Medium amplitudes
Sub-parallel reflections (left) but with some minor regions with sigmoidal reflection; morphology of H3 tend to follow the ones from H2 and H1. Horizon H3 follows the seabed morphology and truncates the reflectors below it.
4 H3 to H4 Medium to high
amplitudes
Sub-parallel to parallel reflections; horizon H4 truncates the reflectors below it.
5 H4 to seabed Low amplitudes Parallel reflections following the current seabed morphology.
has a low gradient, with lower differences between thicker and thinner regions.
DISCUSSION
Pleistocene and Early Holocene
The acoustic basement was interpreted as the horizon AB and it is related to the base of the Upper Quaternary development of the Trapandé Bay deposition. Although it may present some seismic characteristics similar to the crystalline basement, it is more likely that this horizon is related to a sedimentary layer, as the crystalline basement is probably much deeper in the Trapandé Bay and Cardoso Island region, as shown by Souza et al. (1996) with gravimetric data. Because of its irregular morphology, AB top surface influenced the sedimentary deposition in the area, as represented by the distribution and morphology of H1 and H2 horizons.
The paleotopographic maps for the seismic surfaces show important morphologic structures identified in the seismic data, as paleochannels, basement heights and lows, and gas occurrence, which prevented the interpretation of seismic reflections in the area (Fig. 5). This shallow gas occurrence is limited to the innermost area of Trapandé Bay, from near Cananéia Island coastline to the middle of the channel, towards to Ararapira
Channel. The gas signature in the seismic sections is the acoustic blanking, an acoustic feature commonly related to shallow gas in sediments (Davis, 1992; Schroot & Schüttenhelm, 2003; Iglesias & García-Gil, 2007) and very significant in estuaries, lagoons and rias (Benites et al., 2015).
During the Pleistocene and Holocene, the coastal plain of Cananéia-Iguape system witnessed several events of sea-level changes, with transgressions and regressions that eroded the seabed in different phases (Suguio & Petri, 1973; Suguio & Barcelos, 1978; Mahiques et al., 2010). The seismic horizons interpreted in the Trapandé Bay are related to the erosional surfaces formed during those relative sea-level variations and the internal reflections and terminations are a response to the progradational and retrogradational character of each period. The horizons H1 and H2 consist of clear discontinuities in most of the study area and are marked by good lateral continuity and truncation of the underlying reflectors. In coastal systems, this irregular reflection pattern can be related to an erosional surface caused by relative sea-level fall events, when the sea bottom was exposed to subaerial continental dynamic processes (Vital et al., 2010; Weschenfelder et al., 2010).
H1 and H2 are also characterized by incised structures linked to drainage channels, deep and wide enough to transport
RODRIGUES VS, ALVES DPV, JOVANE L & SOUZA LAP
363
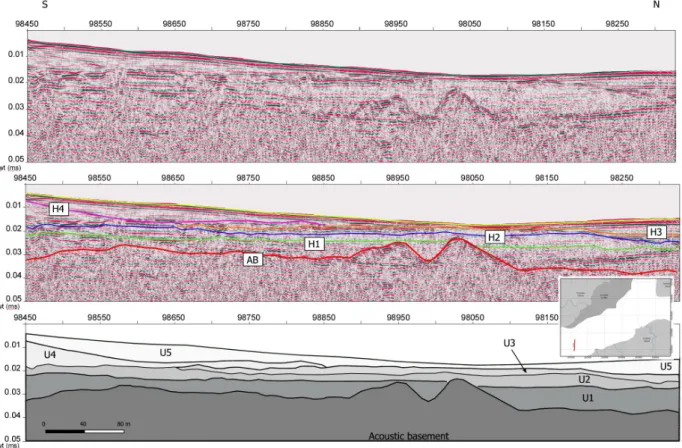
Figure 4 – Seismic section (above) of line 160931, in a cross section of the channel, showing the seismic horizons interpreted: AB in red, H1 in green, H2 in blue, H3
in orange, H4 in purple and the seabed in yellow. Below, the interpreted seismic units U1, U2, U3, U4, and U5, as well as the acoustic basement.
water and sediments to the Trapandé Bay basin. Depositional features like those formed during lowstand sea-level periods and might also be related to drier/cooler periods. The width of the channels in H1 surface varies from 120 to 300 meters and their depths from 3 to 7 meters (Figs. 2 and 3).
In both U1 and U2 units, the seismic facies and internal reflections point to depositional features related to the sediments filling from the previously eroded surfaces. The top surfaces of U1 and U2 units – H1 and H2, respectively – have irregular morphology with presence paleochannels records, as cut-and-fill structures. Hence, it is reasonable to assume that the surfaces of both horizons correspond to erosional surfaces formed during sea-level lowstands or even seabed exposure.
The paleotopography of the H1 surface (Fig. 5c), U1 seismic facies and the isopach map for seismic unit U1 (Fig. 6a) point to the development of U1 during a highstand period, filling the lower regions of AB and maintaining an overall similar topography. The overall depths of H1 surface (Fig. 5c) are over 30 mbsl, what, besides the plane-parallel reflectors of U1, puts
U1 deposition during the highstand stages in MIS 5 (Fig. 2a and 2b). Therefore, the sediments of U1 are probably related to the Cananéia Formation (Suguio & Petri, 1973). We also observed a direct relationship between the areas of higher thickness and the proximity of Cardoso Island and the Jaguapariu, Paneminha, and Perequê rivers (Fig. 6a), showing they may have worked as sediment suppliers for the Trapandé Bay since the Upper Pleistocene.
The horizon H1 represents an erosional surface associated to the regressions and lowstand periods occurred after the end of the transgressions from MIS 5e (Cananéia Transgression, in ~120 ka), MIS 5c and MIS 5a. Considering its depths (Fig. 5c), the erosion that formed H1 may have occurred in several stages since the MIS 5 until the Last Glacial Maximum (LGM). After these marine regressions, the condition of relative low sea-level, or even the seafloor exposure, lead to the erosion of the Cananéia Formation sediments deposited during the previous highstand periods of the Upper Pleistocene, resulting in the paleochannels structures and truncation of reflectors of alluvial
Figure 5 – Topographic maps from Trapandé Bay built from the interpolation of the horizons defined in the seismograms: bathymetry (a), horizon H2 (b), horizon H1
(c) and Acoustic Basement (d). In green, the region with shallow gas occurrence. All depth values are in meters below sea-level (mbsl).
RODRIGUES VS, ALVES DPV, JOVANE L & SOUZA LAP
365
deposits we recognize in unit U1. Gandolfo et al. (2001) found similar horizons in the southernmost region of Comprida Island and Mahiques & Souza (1999) found seismic units in the north coast of São Paulo State which they also linked to the Upper Pleistocene deposits.
There is not yet a consensus about the relative sea-level between MIS 4 and MIS 3 in the São Paulo State coast (Mahiques et al., 2010). Even with doubts about the position that the relative sea-level reached during those two stages (Klein, 2005; Veiga, 2005; Mahiques et al., 2010) we consider that the deposition of unit U2 developed after LGM, during the rapid and stepped sea-level rise in the Holocene. Hence, unit U2 is formed by sediments from the Upper Pleistocene and Early Holocene, as Mahiques & Souza (1999) have also found in São Paulo State north coast.
The Holocene sea-level rise in the Brazilian coast was stepped since the LGM with periods of stabilization (or very slow rise) between 16 and 11 ka (Fig. 2d; Furtado, 2013). The seismic facies and thickness of unit U2 are related to a stable stage in sea-level rise, with deposition during stable sea-level. Its top erosive surface (H2) is then related to the following faster sea-level rise between 11 and 7 ka (Fig. 2d; Furtado, 2013), and the ravinement erosion caused by the rapid flooding of the Trapandé Bay. The thickness of U2 (Fig. 6b) also corroborates with its development during a basin filling and stabilization period, with filling of depressions in H1 surface, particularly in the proximities of Jaguapariu and Paneminha rivers, but also north in the Cananéia Sea. The overall thinner sedimentary packages from U2 in comparison with U1 is further corroboration of unit U2 formation during a short-time stabilization at a low sea-level, followed by an erosion (surface of horizon H2). This erosional surface ends unit U2 deposition, representing an increase in sea-level rise velocity after 11 ka. As H1 surface, H2 surface also presents features as paleochannels and truncation of reflectors of U2 alluvial deposits.
Late Holocene
After the first stabilization, during the middle and late Holocene, the relative sea-level rose faster culminating in the Santos Transgression maximum in ~5.5-5.2 ka. During this transgression, the sea invaded the eroded highstand deposits of units U1 and U2. These new highstand deposits filled the paleochannels and the alluvial features, with plane-parallels internal reflections typical of highstand deposition found on units U3 and U4. Although both units were deposited during highstand periods, U3 is much thinner than U4 (Figs. 2 and 3) and we
assume that U3 represents the transgressive deposition, similar to a transgressive tract (Vail et al., 1977; Posamentier, 1988). Therefore, U3 deposition occurred right after the erosion of U2, during the faster sea-level rise after 11 ka.
There is no consensus between authors about the sea-level during those last 5 millennia. Some authors suggest a rapid regression around 3.5 ka (Suguio et al., 1985; Corrêa, 1996; Martin et al., 2003) while others suggest that the sea-level decreased steadily after the Holocene maximum (Angulo & Lessa, 1997; Angulo et al., 2006) (Fig. 2). Either way, seismic units U4 and U5 represent the highstand deposition developed after the maximum of Santos Transgression. U4 is restricted to the proximal areas of the bay, close to the shore, and, therefore, a high sea-level would be necessary for its deposition. Unit U4 is mainly characterized by progradational seismic facies (Fig. 4), especially in regions near the present coast. Unit U5, on the other hand, represents the Late Holocene and present deposition in the Trapandé Bay. The plane-parallel reflectors and spatial distribution of the unit points to its deposition in a stable and high sea-level condition
We miss any seismic feature that could be related to an erosional event. Therefore, our seismic data show a smoother decrease of relative sea-level to present level during the Late Holocene, as proposed by Angulo & Lessa (1997) and Angulo et al. (2006).
CONCLUSIONS
With aid of the seismic stratigraphy of the Trapandé Bay, we present records of the two latest great transgressions recognized in the Brazilian southeastern coast in the Upper Pleistocene (~120 ka) and in the Holocene (~5.5-5.2 ka). We also show the erosional surfaces related to the regression that culminated in the LGM and with the stepped sea-level rise during the Holocene.
After the Cananéia Transgression, highstand depositional processes filled the Trapandé Bay Pleistocene basement. During this period (MIS 5), sediments of unit U1 filled the paleodepths and paleochannels formed during the preceding exposure period, creating thick sedimentary packages. Unit U1 top horizon H1 represents the erosional surface formed during the regression phases of MIS 4 and MIS 2. It is unclear if any deposits from MIS 4 remained in the basin because of the extent of MIS 2 regression. After the LGM, the sea-level rose with periods of stabilization in the Brazilian coast, with the deposition of unit U2 during the first of those stabilizations, between 16 and 11 ka. The overall thinner U2 sedimentary packages (compared to U1) corroborate with its formation during this sort stabilization interval. After that, with
an increase in the velocity of sea-level rise, the rapid flood of the bay eroded U2, forming erosional surface H2. The maximum thickness of units U1 and U2 have relation to the Jaguapariu and Paneminha rivers and with the northern sector of the area.
During the middle Holocene, unit U3 sediments deposited as a transgressive tract with a thin and horizontally limited layer, during the rapid flood the Trapandé Bay. After Santos Transgression maximum, during the subsequent highstand period, the unit U4 deposited in progradational sequences limited to near the coast, showing high sea-level. Above it, unit U5 represents the late Holocene and present sedimentation in Trapandé Bay. During the relative sea-level fall to the present level, we found none erosional surfaces or truncated reflectors which could be related to short-term relative sea-level oscillations during the last 3,000 years.
ACKNOWLEDGEMENTS
The authors acknowledge Fundação de Amparo à Pesquisa do Estado de São Paulo (FAPESP) processes 11/22018-3 and 16/24946-9. This study was financed in part by the Coordenação de Aperfeiçoamento de Pessoal de Nível Superior - Brazil (CAPES) Finance Code 001 and Ciências do Mar II -Paleoceanografia da Margem Equatorial Brasileira.
REFERENCES
ANGULO RJ & LESSA GC. 1997. The Brazilian sea-level curves: a critical review with emphasis on the curves from the Paranaguá and Cananéia regions. Mar. Geol., 140: 141–166. doi: 10.1016/S0025-3227(97)00015-7
ANGULO RJ, LESSA GC & SOUZA MC. 2006. A critical review of mid-to late-Holocene sea-level fluctuations on the eastern Brazilian coastline. Quat. Sci. Rev., 25: 486–506. doi: 10.1016/j.quascirev.2005.03.008 BENITES M, ALVES DPV, SANTOS MALY ML & JOVANE L. 2015. Shallow gas occurrence in a Brazilian ría (Saco do Mamanguá, Rio de Janeiro) inferred from high-resolution seismic data. Cont. Shelf Res., 108: 89–96. doi: 10.1016/j.csr.2015.08.022
CATUNEANU O, ABREU V, BHATTACHARYA JP, BLUM MD, DALRYMPLE RW, ERIKSSON PG, FIELDING CR, FISHER WL, GALLOWAY WE, GIBLING MR, GILES KA, HOLBROOK JM, JORDAN R, KENDALL CGSC, MACURDA B, MARTINSEN OJ, MIALL AD, NEAL JE, NUMMEDAL D, POMAR L, POSAMENTIER HW, PRATT BR, SARG JF, SHANLEY KW, STEEL RJ, STRASSER A, TUCKER ME & WINKER C., 2009. Towards the standardization of sequence stratigraphy. Earth-Science Rev., 92: 1–33. doi: 10.1016/j.earscirev.2008.10.003 COHEN JK & STOCKWELL JW. 2017. The CWP/SU: Seismic Unix Release 44R2: a free package for seismic research and processing.
CORNAGGIA F, JOVANE L, ALESSANDRETTI L, FERREIRA PAL, FIGUEIRA RCL, RODELLI D, BERBEL GBB & BRAGA ES. 2018. Diversions of the Ribeira River flow and their influence on sediment supply in the Cananéia-Iguape Estuarine-Lagoonal system (SE Brazil). Front. Earth Sci., 6: 1–10. doi: 10.3389/feart.2018.00025
CORRÊA ICS. 1996. Les variations du niveau de la mer durant les derniers 17.500 ans BP: l’exemple de la plate-forme continentale du Rio Grande do Sul-Brésil. Mar. Geol., 130: 163–178. doi: 10.1016/0025-3227(95)00126-3
CURRAY JR. 1965. Late Quaternary history, continental shelves of the United States. In: WRIGHT HE & FREY DG (Eds.). The Quaternary of the United States. Princeton University Press, Princeton, pp. 723–735. DAVIS AM. 1992. Shallow gas: an overview. Cont. Shelf Res., 12: 1077–1079.
FURTADO VV. 2013. Upper Quaternary Sea Level Fluctuations and Stillstands on the Continental Shelf of São Paulo State, Brazil: a Summary. Revista Brasileira de Geofísica, 31(Supl. 1): 43–48. GANDOLFO OCB, SOUZA LAP, TESSLER MG & RODRIGUES M. 2001. Estratigrafia rasa da Ilha Comprida (SP): Um exemplo de aplicação do GPR. Revista Brasileira de Geofísica, 19: 251–262. doi: 10.1590/S0102-261X2001000300002
GEOBRÁS. 1966. Complexo Valo Grande, Mar Pequeno, Rio Ribeira de Iguape. São Paulo, Brazil.
GIANNINI PCF, GUEDES CCF, NASCIMENTO JR DR, TANAKA APB, ANGULO RJ, ASSINE ML & SOUZA MC. 2009. Sedimentology and Morphological Evolution of the Ilha Comprida Barrier System, Southern São Paulo Coast, In: DILLENBURG SR & HESP PA. Geology and Geomorphology of Holocene Coastal Barriers of Brazil. Springer, Berlin, pp. 177–224. doi: 10.1007/978-3-540-44771-9
HAMILTON EL. 1970. Sound Velocity and Related Properties of Marine Sediments, North Pacific. J. Geophys. Res., 75: 4423–4446.
HAMILTON EL. 1978. Sound velocity-density relations in sea-floor sediments and rocks. J. Acoust. Soc. Am., 63: 366–377. doi: 10.1121/1.381747
HOBBS CH, KRANTZ DE & WIKEL GL. 2015. Coastal Processes and Offshore Geology. In: BAILEY C (Ed.). Geology of Virginia. College of William and Mary, pp. 1–44.
IGLESIAS J & GARCÍA-GIL S. 2007. High-resolution mapping of shallow gas accumulations and gas seeps in San Simón Bay (Ría de Vigo, NW Spain). Some quantitative data. Geo-Marine Lett., 27: 103–114. KIM DC, SUNG JY, PARK SC, LEE GH, CHOI JH, KIM GY, SEO YK & KIM JC. 2001. Physical and acoustic properties of shelf sediments, the South Sea of Korea. Marine Geology, 179: 39–50.
RODRIGUES VS, ALVES DPV, JOVANE L & SOUZA LAP
367
KLEIN DA. 2005. Registros de variações ambientais no Canal de São Sebastião (Estado de São Paulo), durante o Último Ciclo Glacial. Master Dissertation. Universidade de São Paulo. SP, Brazil. 85 pp.
KOŠA E. 2015. Sea-level changes, shoreline journeys, and the seismic stratigraphy of Central Luconia, Miocene-present, offshore Sarawak, NW Borneo. Mar. Pet. Geol., 59: 35–55. doi: 10.1016/j.marpetgeo.2014.07.005
KOWSMANN RO & COSTA MPA. 1974. Paleolinhas de costa na plataforma continental das regiões Sul e Norte brasileira. Rev. Bras. Geociências, 4: 215–222.
LIU Q, ZHU X, YANG Y, GENG M TAN M, JIANG L & CHEN L. 2016. Sequence stratigraphy and seismic geomorphology application of facies architecture and sediment-dispersal patterns analysis in the third member of Eocene Shahejie Formation, slope system of Zhanhua Sag, Bohai Bay Basin, China. Mar. Pet. Geol., 78: 766–784. doi: 10.1016/j.marpetgeo.2015.11.015
MAHIQUES MM, DE MELLO E SOUSA SH, FURTADO VV, TESSLER MG, DE LIMA TOLEDO FA, BURONE L, FIGUEIRA RCL, KLEIN DA, MARTINS CC & ALVES DPV. 2010. The Southern Brazilian shelf: General characteristics, quaternary evolution and sediment distribution. Brazilian J. Oceanogr., 58: 25–34. doi: 10.1590/S1679-87592010000600004 MAHIQUES MM, FIGUEIRA RCL, SALAROLI AB, ALVES DP. V & GONÇALVES C. 2013. 150 years of anthropogenic metal input in a Biosphere Reserve: The case study of the Cananéia-Iguape coastal system, Southeastern Brazil. Environ. Earth Sci., 68: 1073–1087. doi: 10.1007/s12665-012-1809-6.
MAHIQUES MM & SOUZA LAP. 1999. Shallow seismic reflectors and upper Quaternary sea level changes in the Ubatuba region, São Paulo State, Southeastern Brazil. Rev. Bras. Oceanogr., 47: 1–10. doi: 10.1590/S1413-77391999000100001
MARTIN L, DOMINGUEZ JML & BITTENCOURT ACSP. 2003. Fluctuating Holocene sea levels in eastern and southeastern Brazil: Evidence from multiple fossil and geometric indicators. J. Coast. Res., 19: 101–124. MARTIN L, SUGUIO K, FLEXOR J-M, BITTENCOURT ACSP & VILAS-BOAS G. 1980. Le Quaternaire Marin Brésilien (Littoral Pauliste, Sud Fluminense et Bahianais). Cah. O.R.S.T.O.M. Sér. Geol., 11: 95–124.
MCHUGH CM, FULTHORPE CS, HOYANAGI K, BLUM P, MOUNTAIN GS & MILLER KG. 2017. The sedimentary imprint of Pleistocene glacio-eustasy: Implications for global correlations of seismic sequences. Geosphere, 14: 265–285. doi: 10.1130/GES01569.1 MILLIMAN JD & EMERY KO. 1968. Sea Levels during the Past 35,000 Years. Science, 162(3858): 1121–1123.
MITCHUM RM, VAIL PR & SANGREE JB. 1977. Seismic stratigraphy and global changes of sea level: Part 6. Stratigraphic interpretation of seismic
reflection patterns in depositional sequences: Section 2. Application of seismic reflection configuration to stratigraphic interpretation. POSAMENTIER HW.1988. In: WILGUS CK, HASTINGS BS, KENDALL CGSC, POSAMENTIER HW, ROSS CA, VAN WAGONER JC (Eds.). Sea Level change – an integrated approach. SEPM Special Publication. POSAMENTIER HW & ALLEN GP. 1999. Siliciclastic sequence stratigraphy: concepts and applications. SEPM (Society for Sedimentary Geology) Tulsa.
RICCOMINI C. 1995. Padrão de faturamentos do maciço alcalino de Cananéia, Estado de São Paulo: relações com a tectônica mesozóica-cenozóica do sudeste do Brasil. Rev. Bras. Geociências, 25: 79–94.
ROSSI V, AMOROSI A, SARTI G & POTENZA M. 2011. Influence of inherited topography on the Holocene sedimentary evolution of coastal systems: An example from Arno coastal plain (Tuscany, Italy). Geomorphology, 135: 117–128. doi: 10.1016/j.geomorph.2011.08.009 SCHROOT BM, SCHÜTTENHELM RTE. 2003. Shallow gas and gas seepage: expressions on seismic and otheracoustic data from the Netherlands North Sea. J. Geochem. Explor., 78–79: 305–309. SOUZA LAP. 2006. Revisão crítica da aplicabilidade dos métodos geofísicos na investigação de áreas submersas rasas. PhD Thesis, Universidade de São Paulo. SP, Brazil. 283 pp.
SOUZA LAP. 1995. A planície costeira Cananéia-Iguape, litoral sul do Estado de São Paulo: um exemplo de utilização de métodos geofísicos no estudo de áreas costeiras. Master Thesis, Universidade de São Paulo. SP, Brazil.
SOUZA LAP, TESSLER MG & GALLI VL. 1996. O gráben de Cananéia. Rev. Bras. Geociências, 26: 139–150.
STOCKWELL JW. 1999. The CWP/SU: Seismic Un(*)x package. Comput. Geosci., 25: 415–419. doi: 10.1016/S0098-3004(98)00145-9 SUGUIO K & BARCELOS JH. 1978. Quaternary sedimentary environments in Comprida Island, state of São Paulo, Brazil. Bol. IG. Inst. Geociências, 9: 203–211.
SUGUIO K & MARTIN L. 1978. Quaternary marine formation of the states of São Paulo and Southern Rio de Janeiro. In: Int. Symp. Coast. Evol. Quat. Special Publication. São Paulo, Brazil: SBG. 5 pp.
SUGUIO K, MARTIN L & BITTENCOURT A. 1985. Flutuações do nível relativo do mar durante o Quaternário Superior ao longo do litoral brasileiro e suas implicações na sedimentação costeira. Rev. Bras. Geociências, 15: 273–286.
SUGUIO K & PETRI S. 1973. Stratigraphy of the Iguape-Cananéia Lagoonal region sedimentary deposits, São Paulo State, Brazil. Part I: Field observations and grain size analysis. Bol. IG. Inst. Geociências, 4: 1–20.
SUGUIO K, TATUMI SH, KOWATA EA, MUNITA CS & PAIVA RP. 2003. Upper Pleistocene deposits of the Comprida Island (São Paulo State) dated by thermoluminescence method. An. Acad. Bras. Ciênc., 75: 91–96. doi: 10.1590/S0001-37652003000100010
TESSLER MG. 1982. Sedimentação atual na região lagunar de Cananéia – Iguape, Estado de São Paulo. Master Dissertation. Universidade de São Paulo. SP, Brazil.
VAIL PR, MITCHUM RM & THOMPSON III S. 1977. Seismic stratigraphy and global changes of sea level: Part 3. Relative changes of sea level from Coastal Onlap: section 2. Application of seismic reflection Configuration to Stratigraphic Interpretation. In: PAYTON CE. (Ed.). Memoir 26: Seismic Stratigraphy-Applications to Hydrocarbon Exploration. pp. 63–81.
VEIGA FA. 2005. Processos morfodinâmicos e sedimentológicos na plataforma continental rasa paranaense. PhD Thesis. Universidade Federal do Paraná, Brazil. 193 pp.
VITAL H, FURTADO SFL & GOMES MP. 2010. Response of the Apodi-Mossoró Estuary-incised valley system (NE Brazil) to sea-level fluctuations. Brazilian J. Oceanogr., 58: 13–24. doi: 10.1590/S1679-87592010000600003
WESCHENFELDER J, CORRÊA ICS, ALIOTTA S & BAITELLI R. 2010. Paleochannels related to late Quaternary sea-level changes in southern Brazil. Brazilian J. Oceanogr., 58: 35–44. doi: 10.1590/S1679-87592010000600005
YOO DG & PARK SC. 2000. High-resolution seismic study as a tool for sequence stratigraphic evidence of high-frequency
sea-level changes: latest Pleistocene-Holocene example
from the Korea Strait. J. Sediment. Res., 70: 296–309. doi: 10.1306/2dc40912-0e47-11d7-8643000102c1865d
YOO DG, CHANG TS, LEE GS, KIM GY, KIM SP & PARK SC. 2016. Late Quaternary seismic stratigraphy in response to postglacial sea-level rise at the mid-eastern Yellow Sea. Quat. Int., 392: 125–136. doi: 10.1016/j.quaint.2015.07.045
Recebido em 9 de julho de 2019 / Aceito em 13 de novembro de 2019 Received on July 9, 2019 / Accepted on November 13, 2019