António Afonso, Jorge Silva
Debt crisis and 10-year sovereign yields in
Ireland and in Portugal
WP06/2017/DE/UECE
_________________________________________________________
De pa rtme nt o f Ec o no mic s
W
ORKINGP
APERS1
Debt crisis and 10-year sovereign yields in
Ireland and in Portugal
*
António Afonso,
$Jorge Silva
+ #Abstract
We assess the determinants of the 10-year sovereign yield for the period 2000-2015, in Portugal and in Ireland. Results show that the long-term Portuguese sovereign yield increased with the rise of the 10-year Bund yield and during the Securities Markets Programme, but decreased due to financial integration. Additionally, during the period of the economic and financial adjustment programme, there was evidence of additional rises (decreases) due to increases (decreases) in the 3-month Euribor rate, and the level of public debt. EU/IMF funding reduced sovereign yield.
Keywords: 10-year sovereign yield, economic and financial adjustment programme, Portugal, Ireland.
JEL: C20, E44, E62, G01.
* The opinions expressed are those of the authors and are not necessarily those of the respective employers. $ ISEG/UL – Universidade de Lisboa, Department of Economics; UECE – Research Unit on Complexity
and Economics. UECE is supported by Fundação para a Ciência e a Tecnologia (The Portuguese Foundation for Science and Technology). email: aafonso@iseg.utl.pt.
+ ISEG/UL – University of Lisbon, email:jorgefariasilva@gmail.com.
2
1. Introduction
As fall out from the 2009-2010 economic and financial crisis, Portugal and Ireland
needed financial support to roll over public debt and they both adopted economic and
financial adjustment programmes in 2011.1 These euro area countries had external
deficits and were more vulnerable to external shocks than those euro area countries that
recorded external surpluses. In this paper we assess the determinants of 10-year sovereign
yields in Portugal and in Ireland, notably in this context of crisis.
In the related literature, Lane (2012) argues that at the moment of the crisis, the euro
area had a low degree of fiscal and banking union, with identified risks of multiple
equilibria when sovereign debt is high. This “bad equilibrium” leads to the risk of
self-fulfilling speculative attacks, i.e. an increase in perceptions of default risk induces
investors to demand higher yields. Therefore, the rollover of public debt is more difficult
and makes default more likely. On the other hand, the European Stability Mechanism and
the ECB’s programme to purchase sovereign bonds could attenuate such dire market
conditions.
Altavilla, Giannone and Lenza (2014) studied the macroeconomic effects of the
Outright Monetary Transaction (OMT) programme announced during the period of
July-September 2012, focussing on four countries: France, Germany, Italy and Spain.
Regarding the 2-year government bond yields, the OMT announcements decreased the
Italian and Spanish yields by about 200 bp, and left unchanged the bond yields of the
same maturity in Germany and France. The reduction of 10-year government bond yields
in Italy and Spain (about 100 bp) was smaller than the decrease in 2-year bond yields.
Garcia-de-Andoain et al. (2016) studied the effect of liquidity provision by the ECB
on the overnight unsecured interbank markets for the period 2008-2014. They report
evidence that the ECB acted as lender-of-last-resort for the banking system. Furthermore,
there were two effects of central bank liquidity: the replacement of the demand for
liquidity in the interbank market (financial crisis 2008-2010), and an increase in the
supply of liquidity in the interbank market in Greece, Italy and Spain (the debt crisis of
2011-2013).
With regards to the impact of the unconventional monetary policy on the private sector,
Ferrando, Popov and Udell (2015) studied the effects on small firms during the period of
the debt crisis (2009Q1-2014Q1). The authors concluded that small firms in the stressed
1 The economic and financial adjustment programmes were implemented in different periods: Ireland
3
countries were more likely to be credit-rationed through price and quantity. However,
there was evidence that the OMT decreased the share of credit-rationed firms.
Andrade et al. (2016) analysed the effects of the expanded asset purchase programme
(APP) on the economy, sovereign yields and transmission channels. The APP was
announced in January 2015 and it decreased sovereign yields on long-term bonds, as well
as increased the share prices of banks. The results are consistent with the portfolio
rebalancing channel due to the removal of duration risk as well as the relaxation of
leverage constraints for financial intermediaries.
Our results show that the Portuguese 10-year sovereign yield decreased due to the
reduction of the 10-year Bund yield, as well as on account of the increase of financial
integration in euro area government bonds. During the period under the Securities
Markets Programme (SMP), there was a strong increase of sovereign yield. Throughout
the economic and financial adjustment programme (EFAP), additional decreases
(increases) of the 3-month Euribor rate decreased (raised) 10-year sovereign yield.
Furthermore, the Portuguese public debt-to-GDP ratio had a non-linear effect on the
dependent variable. The EU/IMF funding also reduced the10-year sovereign yield. The
results for Ireland are less statistically significant.
2. Methodology and data
Equation (1) presents the dependent variable - the q-o-q variation of the 10-year
sovereign yield, decomposed between external and domestic factors:
− ∗ 100= 0+ 1 + 2 ! " #+ $ , (1)
where % & ' is the set of external variables, and ()* + ,- includes domestic
variables.
During the period between the run up to the introduction of the Euro and the financial
crises, there was a reduction of the sovereign yield spread between Germany and the
peripheral countries. Figure 1 presents a negative correlation between the main indicator
for the cost of long term funding and the indicator of financial integration (cross-holdings
of government debt). Furthermore, we can see how the implementation of the SMP by
the ECB (May 2010 – September 2012) led to a reduction of cross holdings of
government debt.Figure 2 details the public debt-to-GDP ratio and the 3-month Euribor
rate. After the financial crisis, an accommodative monetary policy stance prevailed,
4
EFAP there was an increase of the public debt ratio for Portugal and Ireland. The gap
between the Portuguese 10-year sovereign yield and the 3-month Euribor rate was at its
highest in 2012Q1 (1218 basis points), and lowest in 2007Q4 (-27 bp).
[Figure 1]
[Figure 2]
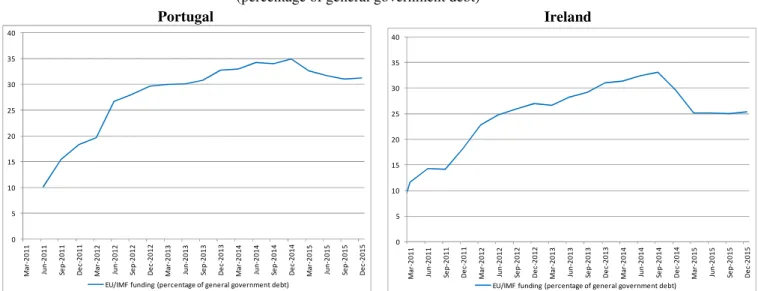
Figure 3 shows the value of total liabilities outstanding related to the loans from the
international institutions since the EFAP. In Portugal, the EU/IMF funding-to-total public
debt was higher than that of Ireland.
[Figure 3]
In line with economic theory, we included several domestic and external explanatory
variables:
• Domestic factors: general government debt-to-GDP, structural budget balance,
potential output growth, inflation and dummy for the EFAP;
• Financial volatility: composite indicator of systemic stress (CISS) as measure of financial stress in Europe and VIX, and as a proxy for global financial volatility;
• Financial fragmentation/integration: the share of monetary and financial institutions cross-border holdings of euro area sovereign debt securities;
• Monetary policy: 3-month Euribor - the rate for the main refinancing operations
and dummy-related to the SMP;
• Control variables related to S&P 500, dummy of the financial crisis since 2009, and the Bund yield as a benchmark of government bond yield for the euro area.
3. Empirical analysis
We estimate (1) in first differences in order to avoid non-stationary of some variables.
Therefore, the q-o-q variation of the 10-year government bonds is the dependent variable.
The following determinants are statistically significant in the case of Portugal (Table 1):
5
• External factors: the 10-year Bund yield, which is a benchmark for the costs of
funding in the euro area, and the financial integration/fragmentation of the euro
area sovereign debt. During the EFAP, the 3-month Euribor.
Regarding regression (8) (Table 1), there was evidence that the Portuguese sovereign
yield rose (87 bp) due to increases in the 10-year Bund yield (100 bp). During the SMP,
the dependent variable increased (90 bp per quarter), in spite of the ECB’s attempt to
subdue the yield spike brought about by the sudden stop in capital flows. Throughout the
EFAP, the level of debt ratio had a non-linear impact on the sovereign yield. In fact, a
public debt ratio of up to 126% increased the dependent variable. During the same period,
a q-o-q variation of the 3-month Euribor (by 100 bp) increased the sovereign yield (by
371 bp). The EU/IMF funding, although marginally statistically significant, contributed
to decrease the yield spread, and the effect also resulting from the cross-holdings of euro
area sovereign debt.
[Table 1]
For Ireland (Table 2), regression (5) shows that the q-o-q variation of the 10-year
sovereign yield was also explained by changes in the 10-year Bund yield.2 During the
SMP, the dependent variable increased 105 bp per quarter. In addition, throughout the
EFAP period, the variation of the 3-month Euribor (100 bp) increased the dependent
variable (246 bp). Inflation, CISS, potential output, structural budget balance and
financial integration had no statistical significance.
[Table 2]
4. Conclusions
We studied the determinants of 10-year sovereign yields, focussing on domestic and
external factors during the period 2000-2015. We assessed the Portuguese and Irish cases,
which are two small open economies in the euro area, which had to implement economic
adjustment programmes due to the European sovereign debt crisis.
Our results show that both the Portuguese and Irish 10-year government bond yields
were determined by the q-o-q variation of the 10-year Bund yield, as well as by financial
2 The estimations for Ireland include a first-order autoregressive coefficient of the error term (ρ) to solve
6
integration. During the SMP, the Portuguese sovereign yield rose, in spite of the ECB’s
purchases of government bonds.
Throughout the EFAP, the level of public debt-to-GDP was a determinant for the
increase of the sovereign yield for Portugal, and the 3-month Euribor, which is a proxy
for monetary policy stance, was also a determinant for the variation of sovereign yields,
both in Portugal and in Ireland. The existence of EU/IMF funding decreased the
Portuguese 10-year yield, but this was not the case for the Irish 10-year yield.
5. References
Altavilla, Carlo, Domenico Giannone and Michele Lenza. “The financial and
macroeconomic effects of OMT announcements.” ECB Working Paper August
2014.
Andrade, Philippe, et al. “The ECB's asset purchase programme: an early assessment.”
ECB Working Paper September 2016.
European Commission. “The Economic Adjustment Programme for Ireland.” Occasional
Papers 76 February 2011.
—. “The Economic Adjustment Programme for Portugal.” Occasional Papers 79 June
2011.
Ferrando, Annalisa, Alexander Popov and Gregory F. Udell. “Sovereign stress,
unconventional monetary policy, and SME access to finance.” ECB Working
Paper June 2015.
Garcia-de-Andoain, Carlos, et al. “Lending-of-last-resort is as lending-of-last-resort does:
Central bank liquidity provision and interbank market functioning in the euro
area.” ECB Working Paper February 2016.
Lane, Philip R. “The European Sovereign Debt Crisis.” Journal of Economic Perspectives
7
Figure 1 – 10-year sovereign yield and financial integration indicator
(percentage)
Portugal Ireland
Sources: ECB and own calculations. The vertical lines denote the period of the SMP.
Figure 2 – General government debt and 3-month Euribor rate
(percentage of GDP and percentage)
Portugal Ireland
Sources: Eurostat, ECB and own calculations. The vertical lines denote the period of the EFAP for Portugal and Ireland. There was a strong denominator effect in Ireland due to upward revisions of Irish GDP in 2015, related to the relocation of large companies. 0 5 10 15 20 25 30 0 2 4 6 8 10 12 14 M a r-2 0 0 0 D e c -2 0 0 0 S e p -2 0 0 1 Ju n -2 0 0 2 M a r-2 0 0 3 D e c -2 0 0 3 S e p -2 0 0 4 Ju n -2 0 0 5 M a r-2 0 0 6 D e c -2 0 0 6 S e p -2 0 0 7 Ju n -2 0 0 8 M a r-2 0 0 9 D e c -2 0 0 9 S e p -2 0 1 0 Ju n -2 0 1 1 M a r-2 0 1 2 D e c -2 0 1 2 S e p -2 0 1 3 Ju n -2 0 1 4 M a r-2 0 1 5 D e c -2 0 1 5
10-year yield (left) Cross holdings of government bonds (right)
0 5 10 15 20 25 30 0 2 4 6 8 10 12 M a r-2 0 0 0 D e c -2 0 0 0 S e p -2 0 0 1 Ju n -2 0 0 2 M a r-2 0 0 3 D e c -2 0 0 3 S e p -2 0 0 4 Ju n -2 0 0 5 M a r-2 0 0 6 D e c -2 0 0 6 S e p -2 0 0 7 Ju n -2 0 0 8 M a r-2 0 0 9 D e c -2 0 0 9 S e p -2 0 1 0 Ju n -2 0 1 1 M a r-2 0 1 2 D e c -2 0 1 2 S e p -2 0 1 3 Ju n -2 0 1 4 M a r-2 0 1 5 D e c -2 0 1 5
10-year yield (left) Cross holdings of government bonds (right)
-1 0 1 2 3 4 5 6 0 20 40 60 80 100 120 140 M a r-2 0 0 0 D e c -2 0 0 0 S e p -2 0 0 1 Ju n -2 0 0 2 M a r-2 0 0 3 D e c -2 0 0 3 S e p -2 0 0 4 Ju n -2 0 0 5 M a r-2 0 0 6 D e c -2 0 0 6 S e p -2 0 0 7 Ju n -2 0 0 8 M a r-2 0 0 9 D e c -2 0 0 9 S e p -2 0 1 0 Ju n -2 0 1 1 M a r-2 0 1 2 D e c -2 0 1 2 S e p -2 0 1 3 Ju n -2 0 1 4 M a r-2 0 1 5 D e c -2 0 1 5
General government debt-to-GDP (left) Euribor 3 months (right)
-1 0 1 2 3 4 5 6 0 20 40 60 80 100 120 140 M a r-2 0 0 0 D e c -2 0 0 0 S e p -2 0 0 1 Ju n -2 0 0 2 M a r-2 0 0 3 D e c -2 0 0 3 S e p -2 0 0 4 Ju n -2 0 0 5 M a r-2 0 0 6 D e c -2 0 0 6 S e p -2 0 0 7 Ju n -2 0 0 8 M a r-2 0 0 9 D e c -2 0 0 9 S e p -2 0 1 0 Ju n -2 0 1 1 M a r-2 0 1 2 D e c -2 0 1 2 S e p -2 0 1 3 Ju n -2 0 1 4 M a r-2 0 1 5 D e c -2 0 1 5
8
Figure 3 – Loans from the EU/IMF funding
(percentage of general government debt)
Portugal Ireland
Source: Portuguese Treasury and Debt Management Agency, National Treasury Management Agency, Eurostat and own calculations. 0 5 10 15 20 25 30 35 40 M a r-2 0 1 1 Ju n -2 0 1 1 Se p -2 0 1 1 D e c -2 0 1 1 M a r-2 0 1 2 Ju n -2 0 1 2 Se p -2 0 1 2 D e c -2 0 1 2 M a r-2 0 1 3 Ju n -2 0 1 3 Se p -2 0 1 3 D e c -2 0 1 3 M a r-2 0 1 4 Ju n -2 0 1 4 Se p -2 0 1 4 D e c -2 0 1 4 M a r-2 0 1 5 Ju n -2 0 1 5 Se p -2 0 1 5 D e c -2 0 1 5
EU/IMF funding (percentage of general government debt)
0 5 10 15 20 25 30 35 40 M a r-2 0 1 1 Ju n -2 0 1 1 Se p -2 0 1 1 D e c -2 0 1 1 M a r-2 0 1 2 Ju n -2 0 1 2 Se p -2 0 1 2 D e c -2 0 1 2 M a r-2 0 1 3 Ju n -2 0 1 3 Se p -2 0 1 3 D e c -2 0 1 3 M a r-2 0 1 4 Ju n -2 0 1 4 Se p -2 0 1 4 D e c -2 0 1 4 M a r-2 0 1 5 Ju n -2 0 1 5 Se p -2 0 1 5 D e c -2 0 1 5
9
Table 1 – Estimations of the q-o-q quarterly change of 10-year Portuguese government bonds
(basis points)
Notes: t-statistics in brackets. *, **, *** denote significance at 10, 5 and 1% levels. Heteroskedasticity and Autocorrelation Consistent Covariance (HAC) or Newey-West estimator. Regressions were estimated by OLS. EFAP - economic and financial adjustment programme.
Variable (1) (2) (3) (4) (5) (6) (7) (8)
constant 1.96 -1.73 -2.14 -6.33 -15.87 -1.64 -2.20 -3.54
(0.5) (-0.6) (-0.8) (-1.1) (-1.7) (-0.6) (-0.4) (-1.2)
Δ 10 year Bund 82.02*** 92.53*** 88.42*** 87.96*** 88.51*** 101.61*** 88.32*** 87.21***
(4.7) (4.4) (4.6) (4.6) (4.7) (5) (4.2) (5)
Portuguese General Government debt-to-GDP * EFAP 12.46*** 8.64*** 8.66*** 8.48*** 8.59*** 8.45*** 8.66*** 12.59***
(6.7) (4.2) (4.3) (4.3) (4.3) (4) (3.8) (5)
(Portuguese General Government debt-to-GDP) 2 * EFAP -0.1*** -0.07*** -0.07*** -0.07*** -0.07*** -0.07*** -0.07*** -0.1***
(-6.4) (-4.2) (-4.3) (-4.3) (-4.2) (-4.1) (-3.8) (-5.1)
Δ Euribor 3 months * EFAP 329*** 332.85*** 335.51*** 332.4*** 328.22*** 314.87*** 335.54*** 371.47***
(4.5) (4.9) (5) (5) (4.8) (5.2) (4.9) (7)
Δ cross holdings of government bonds -20.06** -9.1* -9.97* -9.91** -6.58 -9.09
(-2.4) (-1.8) (-1.9) (-2.1) (-1.1) (-1.6)
Dummy SMP 82.14*** 72.42*** 75.43*** 65.17*** 76.37*** 72.39*** 90.45***
(5.6) (4.4) (4.6) (3.7) (4.5) (4.7) (5)
Structural budget balance -2.79
(-1.5)
Potential output growth 3.69
(1.2)
Δ CISS 83.81
(1.4)
Δ EU/IMF loans-to-GDP -13.16*
(-2.2)
HICP variation 0.11
(0)
R-square 0.65 0.70 0.71 0.71 0.71 0.71 0.71 0.74
Durbin-Watson 1.76 2.05 2.08 2.09 2.09 2.13 2.08 2.06
Observations 64 64 64 64 64 64 64 64
10
Table 2 – Estimations of the q-o-q quarterly change of 10-year Irish government bonds
(percentage points of GDP)
Notes: t-statistics in brackets. *, **, *** denote significance at 10, 5 and 1% levels. Heteroskedasticity and Autocorrelation Consistent Covariance (HAC) or Newey-West estimator. Regressions were estimated by OLS. EFAP - economic and financial adjustment programme.
Variable (1) (2) (3) (4) (5) (6) (7) (8)
constant 6.92 0.94 1.01 4.59 -7.43 0.64 1.69 0.80
(0.6) (0.2) (0.2) (0.5) (-1.3) (0.1) (0.2) (0.2)
Δ 10 year Bund 73.17*** 96.86*** 98.46*** 98.66*** 99.6*** 92.91*** 99.61*** 97.12***
(4.2) (3.7) (3.7) (3.7) (3.8) (4) (3.7) (3.5)
Irish General Government debt-to-GDP * EFAP 2.04 -2.01* -1.94 -1.89 -1.83 -1.99 -1.93 -1.87
(0.9) (-1.7) (-1.7) (-1.6) (-1.5) (-1.6) (-1.6) (-1.2)
(Irish General Government debt-to-GDP) 2 * EFAP -0.02 0.01 0.01 0.01 0.01 0.01 0.01 0.01
(-1.1) (1.2) (1.2) (1.1) (1.1) (1.2) (1.1) (0.9)
Δ Euribor 3 months * EFAP 194.2*** 251.66*** 244.47*** 244.79*** 245.89*** 250.78*** 244.54*** 248.65***
(2.8) (3.6) (3.5) (3.6) (3.9) (3.4) (3.5) (3)
Δ cross holdings of government bonds 0.95 8.99 8.89 10.61 8.57 8.63
(0.1) (1.2) (1.1) (1.4) (1.2) (1)
Dummy SMP 101.32*** 109.63*** 106.99*** 105.08*** 109.65*** 109.71*** 101.25***
(3.3) (3.7) (3.5) (3.5) (3.7) (3.7) (3.3)
Structural budget balance -2.01
(-1.5)
Potential output growth -0.60
(-0.9)
Δ CISS -30.09
(-0.4)
Δ EU/IMF loans-to-GDP -0.41
(-0.1)
HICP variation -1.3
(-0.2)
ρ 0.42* 0.3** 0.34** 0.33** 0.3** 0.36** 0.34** 0.3*
(1.8) (2.1) (2.2) (2.2) (2.1) (2.2) (2.2) (2)
R-square 0.55 0.66 0.67 0.67 0.68 0.67 0.67 0.66
Durbin-Watson 1.82 1.74 1.73 1.72 1.74 1.70 1.73 1.74
Observations 63 63 63 63 63 63 63 63