Getting smaller: size dynamics of employer enterprises in Portugal
1Elsa de Morais Sarmento2 Alcina Nunes3
We describe the size dynamics of active employer enterprises´ in Portugal, from 1985 to 2007, by applying
to the Quadros de Pessoal dataset the methodology and definitions of the OECD/Eurostat Manual on
Business Demography Statistics. We observe that firm size has been decreasing in Portugal over all broad
sectors, regions and entrants and exiters from the market and also that firm size distribution is
right-skewed, evolving over time towards a lognormal distribution.
1. Introduction
Firm size distribution has always drawn a great deal of attention in Portugal, often related to the so-called
lack of performance and competitiveness, in comparison to bigger sized international firms4, due to the
overall small dimension of the internal market (especially for nontradeables) and to the country’s type of
specialisation model. In fact during the last decades, there has been an increasing number of smaller
sized enterprises and a decrease of firm size across all main sectors, for both observed entrants and
exiters in the market.
The increasing predominance of small firms in the total enterprise population is not unique to Portugal, it is
a phenomena shared by other countries (Eurostat, 2009; OECD, 2008; Núñez, 2004; Consejo Superior de
Cámaras de Comercio, Industria y Navegación de España, 2003; Cabral, 2007; Bartelsman et al., 2005a).
There is a great amount of evidence in other developed economies, of the shift in the firm size distribution
towards small production units since the 1970s, after years of dominance of the economies of scale in
production. Why this change has taken place is not so clear, though. From a theoretical point of view,
there is not a single theory of the firm that is able to fully explain the reasons for optimal firm size change.
Different theories are then put forward, by different authors that incorporate one or several possible
approaches (You, 1995). It most probably is a consequence of the combination of a whole set of factors
which concern both specialisation effects and within sector effects, which differ according to the
specificities of the country or sector of activity considered. Still, we are able to frame this phenomenon into
three main dimensions. The first, is the result of the combination of an intensified global competition
(mostly from Asian countries and Eastern Europe, which has been responsible for successive waves of
downsizings over the last years) with the acceleration of technological change, which has contributed to
the reduction of the minimum scale of entry5. The second is the increase in the degree of uncertainty,
triggered by episodes of oil price shocks and price instability in raw material markets. Some authors claim
that this might have impacted the mass production system directly, thus promoting smaller scale and more
flexible production units, where smaller firms develop a comparative advantage relatively to their larger
counterparts. Thirdly, the increased globalisation and the digital economy revolution, which shifted
1 The opinions and analysis in this work are the sole responsibility of the authors.
The authors would like to thank Gabinete de Estratégia e Planeamento of the Portuguese Ministry of Labour and Social Security for the provision of data and the helpful assistance.
2
Departamento de Economia, Gestão e Engenharia Industrial, Universidade de Aveiro; Gabinete de Estratégia e Estudos do Ministério da Economia e da Inovação.
3
Escola Superior de Tecnologia e Gestão do Instituto Politécnico de Bragança; Gabinete de Estratégia e Estudos do Ministério da Economia e da Inovação.
4
“It is often said there are too many small firms in Portugal, and that average firm size is too small” (Cabral, 2007). 5
comparative advantages towards knowledge-based economic activities, where the individual is at the
centre of the knowledge chain, as opposed to the firm6.
This work consists on the application of the methodology and definitions comprehended in the Manual on
Business Demography Statistics (OECD/Eurostat, 2007) to the Quadros de Pessoal dataset (Employment
Administrative Records by the Portuguese Ministry of Labour and Social Security). Accordingly, the
analysis focuses on a specific subsample of Quadros de Pessoal, consisting only of the population of
active enterprises7 with at least one paid employee. This is the so-called employer enterprise population8.
The next section describes the main patterns of firm size evolution in Portugal over the last 22 years,
section 3 looks at the decomposition of firm size into specialisation and within sector effects, section 4
highlights the importance of employment creation by small firms, section 5 approaches the issue of firm
size distribution over time and broad sectors, and finally, section 6 concludes.
2. Patterns of firm size evolution in Portugal
The size of the small business sector in a country is often used as a proxy for entrepreneurial activity. The
number of enterprises by size class (Figure 1) highlights the growing importance of small and medium
(SME) sized enterprises in Portugal, which are considered a key source of dynamism and innovation in
developed and emerging economies, thus making important contributions to job creation, economic growth
and productivity (OECD, 2005).
In most countries, firms with less than ten employees represent around three quarters of the employer
enterprise total population. Portugal does not seem to be an outlier, as the population of firms is
dominated by small and micro units in a wide range of countries (Eurostat, 20099; Bartelsman et al.,
2005b; Bartelsman et al., 2004).
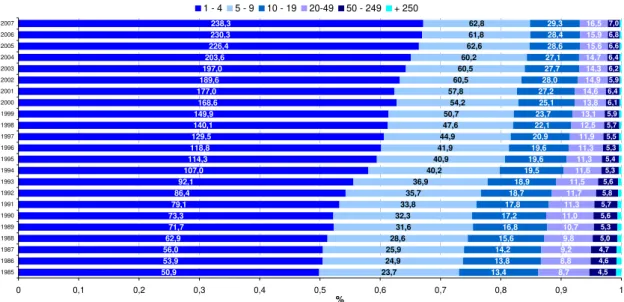
In Portugal, the number of active employer enterprises with fewer than 5 employees (micro-firms) went
over the 200.000 threshold after 2004 (Table A.1 in Annex), but they already represented a significant
share of the employer enterprise universe. Since 1996, more than 60% of all employer enterprise firms in
Portugal are micro firms, and more than 81% have fewer than 10 employees. There is a clear tendency for
small firms, with less than 10 employees, to increase its share in the total population, throughout all the
observed period (74% in 1986, 82% in 1997 and 85% in 2007). In 2007, 97,8% of the Portuguese
enterprises present in our dataset employed less than 50 workers, compared to 95% in 1985.
6
This can lead to situations where individuals who have acquired a specific technological knowledge, leave the incumbent firm to create his or her own new firm, where this knowledge starts being commercialised.
7
An enterprise, according to the Eurostat/OECD Manual (2007) is the “smallest combination of legal units that is an organisational unit producing goods or services, which benefits from a certain degree of autonomy in decision-making, especially for the allocation of its current resources”. An enterprise carries out one or more activities at one or more locations and may be a sole legal unit.
8 The OECD, the Eurostat and the EU member states have agreed that the collection of data on enterprises that have paid employment can improve the compatibility of enterprise birth and death rates among all OECD countries and some EU countries (Eurostat/OECD, 2007). This methodology is intended to be consistent and to complement other methodological guidelines such as statistical business registers and structural business statistics.
9
Figure 1 – Population of Active Employer enterprise population, by size class (in thousand enterprises and %)
50,9 53,9 56,0 62,9 71,7 73,3 79,1 86,4 92,1 107,0 114,3 118,8 129,5 140,1 149,9 168,6 177,0 189,6 197,0 203,6 226,4 230,3 238,3 23,7 24,9 25,9 28,6 31,6 32,3 33,8 35,7 36,9 40,2 40,9 41,9 44,9 47,6 50,7 54,2 57,8 60,5 60,5 60,2 62,6 61,8 62,8 13,4 13,8 14,2 15,6 16,8 17,2 17,8 18,7 18,9 19,5 19,6 19,6 20,9 22,1 23,7 25,1 27,2 28,0 27,7 27,1 28,6 28,4 29,3 8,7 8,8 9,2 9,8 10,7 11,0 11,3 11,7 11,5 11,6 11,3 11,3 11,9 12,5 13,1 13,8 14,6 14,9 14,3 14,7 15,6 15,9 16,5 4,5 4,6 4,7 5,0 5,3 5,6 5,7 5,8 5,6 5,3 5,4 5,3 5,5 5,7 5,9 6,1 6,4 5,9 6,2 6,4 6,6 6,8 7,0
0 0,1 0,2 0,3 0,4 0,5 0,6 0,7 0,8 0,9 1
1985 1986 1987 1988 1989 1990 1991 1992 1993 1994 1995 1996 1997 1998 1999 2000 2001 2002 2003 2004 2005 2006 2007 %
1 - 4 5 - 9 10 - 19 20-49 50 - 249 + 250
Source: Own calculations, based on Quadros de Pessoal, GEP, Ministério do Trabalho e da Solidariedade Social.
The increasing presence of small firms in Portugal is considerable and visible throughout all broad
economic sectors, both in terms of the number of enterprises and the number of employees (Table 1).
During the period of 1995 to 2007, 92,5% of total enterprises in the economy employed fewer than 20
workers and all sectors, except for manufacturing (81,5%), have a share of over 90%. From the first
(1995-1999) to the second sub-period (2000-2007), the number of small enterprises rises in all sectors, but
manufacturing displays the highest increase in this size class, above the total economy’s, indicating a
faster reduction in enterprise size.
On the other hand, the employment share of small firms is much lower, as already verified for other
countries (Bartelsman et al., 2005a). This stylised fact, whereby small enterprises constitute the vast
majority of firms, but account for proportionally less employment, is common in the literature and is also
verified for this universe of employer enterprises.
In parallel to the evolution of the number of enterprises, employment also shows a tendency to rise in all
sectors of activity of this size class, except for services. This trend is not only influenced by the level of
economic activity10, but also by the industry structure, as an economy with a large service sector such as
Portugal (Table A.2), is more likely to have a higher share of small enterprises in total employment (Table
8).
Table 1 - Share of enterprises with fewer than 20 employees, in the total population of firms and in
total employment11
(enterprises with fewer than 20 employees as a % of sector’s total)
Total economy
Agriculture
and Fishing Manufacturing Services Construction Total economy
Agriculture
and Fishing Manufacturing Services Construction
1995-2007 92,5% 96,5% 81,5% 94,7% 92,9% 39,1% 67,2% 25,1% 42,9% 52,1%
1995-1999 91,5% 95,6% 79,6% 94,6% 92,2% 36,6% 61,7% 22,5% 43,8% 46,5%
2000-2007 92,9% 96,9% 82,6% 94,8% 93,1% 40,4% 70,0% 26,8% 42,5% 54,4%
Enterprises Employment
Source: Own calculations based on Quadros de Pessoal, GEP, MTSS.
10 We have found that the economic cycle highly correlates with enterprise births and deaths cycles. In different regression models we have found that GDP is consistently a statistically significant variable.
11
By combining the regional with the size class dimension, we may also observe the predominance of small
firms in most regions at the NUT II level (Tables 2 and 3), in particular in the Algarve12, the Açores and the
Alentejo. Since 1995, all regions display a similar trend of increasing share of firms with fewer than 20
employees and of employment, except for Alentejo and Açores (from 1995 to 2007).
Table 2 - Share of active employer enterprises with fewer than 20 employees in total number of enterprises by NUT II region (%)
Regions 1995 1996 1997 1998 1999 2000 2001 2002 2003 2004 2005 2006 2007
Norte 46,9 47,4 47,4 48,3 49,4 49,4 49,9 51,3 52,8 55,1 56,4 57,1 57,6
Algarve 52,8 53,4 53,9 54,7 58,2 58,4 60,6 62,0 63,8 65,7 67,0 67,0 67,7
Centro 49,3 50,4 50,5 51,2 52,4 52,2 53,7 54,9 56,2 59,1 60,6 61,4 61,8
Lisboa 51,0 51,2 51,3 51,6 52,3 52,1 53,1 53,8 54,8 57,7 59,1 59,9 60,2
Alentejo 52,9 54,8 54,7 57,1 58,6 58,5 59,7 60,2 61,9 63,6 65,3 65,1 66,7
Açores 66,6 66,2 66,4 66,4 65,2 64,5 64,9 64,8 63,8 65,1 67,6 68,4 68,2
Madeira 47,4 48,4 47,8 49,4 50,3 52,2 53,9 55,3 55,1 57,6 57,6 57,8 57,7
Portugal 49,9 50,5 50,5 51,3 52,3 52,2 53,2 54,3 55,5 58,0 59,4 60,1 60,6
Enterprise share of size Class of fewer than 20 employees
Table 3 - Share of employment in active employer enterprises with fewer than 20 employees in total regional employment by NUT II region (%)
Regions 1995 1996 1997 1998 1999 2000 2001 2002 2003 2004 2005 2006 2007
Norte 34,7 35,2 36,2 37,5 38,6 40,4 41,0 43,2 43,3 43,0 43,5 42,8 42,4
Algarve 58,2 59,4 60,3 59,9 59,7 60,0 59,6 62,2 61,1 60,8 60,5 59,5 58,4
Centro 41,4 42,4 43,3 44,1 45,4 46,6 47,3 50,5 50,7 49,5 49,8 49,4 49,1
Lisboa 27,9 28,7 28,9 28,6 28,8 29,2 29,1 30,9 30,5 29,6 28,9 28,6 28,4
Alentejo 55,5 54,7 54,5 55,2 55,4 57,0 56,4 58,2 57,5 54,6 55,5 54,2 54,9
Açores 47,8 46,8 47,4 44,7 45,3 44,2 43,4 43,5 44,5 42,9 43,3 44,3 42,0
Madeira 39,2 37,7 38,4 39,5 41,0 42,9 42,5 42,0 42,1 42,0 42,5 43,2 43,2
Portugal 35,1 35,9 36,6 37,1 37,9 39,0 39,3 41,6 41,5 40,7 40,8 40,2 39,9
Employment share of size class 1 to 19 employees
Source: Own calculations based on Quadros de Pessoal, GEP, MTSS.
3. Firm size across and within sectors
The decrease in firm size reflects the influence of both specialisation effects and within sector effects in the
economy. Concerning the former, we observe that more small enterprises are born in Portugal each year,
in particular in the service sector (Table A.3), which holds a lower average firm size than the manufacturing
sector (Table A.5). By comparing different time frames across size classes, we also observe that firm
rotation decreases with size13. More firms are born within the 1-4 size class (77,9% share of total
enterprises in 1987-2000 compared to 80,3% in 1989-2007) and firms with fewer than 20 employees have
also been increasing over the past decades (Table 4).
12 Even when firms with fewer with less than 50 employees are considered, the Algarve and the Alentejo are still the regions with the highest share of small enterprises in 2007.
13
Table 4 – Average employer enterprise births14 by periods and firm size Period
1 - 4 1 - 9 1 - 19 1-49 1 - 249 ALL
1987-2000 31.368 24.442 28.900 30.476 31.147 31.347 31.368
% of total 100 77,9 92,1 97,2 99,3 99,9 100,0
1987-2007 36.803 29.555 34.256 35.885 36.574 36.781 36.803
% of total 100 80,3 93,1 97,5 99,4 99,9 100,0
1992-1999 33.383 26.483 30.982 32.511 33.162 33.363 33.383
% of total 100 79,3 92,8 97,4 99,3 99,9 100,0
2000-2007 48.259 40.287 45.543 47.286 48.011 48.233 48.259
% of total 100 83,5 94,4 98,0 99,5 99,9 100,0
Cumulative by Size Class (nº employees) Average
entreprise births
Source: Own calculations based on Quadros de Pessoal, GEP, MTSS.
On the other hand, there has been an overall decrease in within sector’s average size, for all broad sectors
of the economy, and particularly for manufacturing (Table 5). While the average size of manufacturing
firms still is at least twice as large than services15 (Table A.2), it tends to decrease faster between the two
sub-periods than the remaining sectors (from 20,8 average employees before 2000, to 17,4 afterwards)16.
Table 5 - Average firm size by broad sectors and periods
(number of employees)
Total economy
Agriculture
and Fishing Manufacturing Services Construction
1995-2007 10,0 4,9 18,9 8,4 8,9
1995-2000 10,9 5,5 20,8 8,6 9,5
2000-2007 9,4 4,5 17,4 8,3 8,3
Source: Own calculations based on Quadros de Pessoal, GEP, MTSS.
Moreover, the average number of employees across all main sectors has decreased, for both observed
entrants and exiters in the market. Entrants and exiters are on average of smaller size than incumbent
firms (ranging from 35% to 45% for entrant’s size and 39% to 50% for exiters, over the period). A typical
entrant is smaller than the industry average17, and the difference in size compared to the incumbent has
been closing down in all the sub-periods considered (Table 6).
14 According to the OECD, the core measure of births reflects the concept of employer enterprise birth. A birth amounts to the “creation of a combination of production factors with the restriction that no other enterprises are involved in the event” (Eurostat/OECD, 2007). Births do not include entries into the population which result from break-ups, spit-offs, mergers, restructuring14 of enterprises or reactivations of units which are dormant within a period of two years14. This population thus consists of enterprises that have at least one paid employee in its birth year and also of enterprises that, despite existing before the year in consideration, were below the one employee threshold. An employer enterprise entry is thus counted in the dataset as a birth of an employer enterprise after it recruits its first employee, while complying with the above mentioned requisites.
15
A known stylised fact is that there is a substantial sectoral component in firms size and that manufacturing firms tend to be larger than services firms (Bartelsman et al, 2005a).
16 Bartelsman et al. (2005a) divides firm’s size across countries and places Portugal in the group of the largest sized countries (US, France and Germany) where the average size is of 15 employees in the total business sector. They obtain an average of 16,8 employees per firm in Portugal for the period 1989-1994. Although we obtain different averages, we also observe that average firm size in services is clearly below the economy’s average and that the ratio of manufacturing firm size relative to total economy is 1,8, the same obtained by Bartelsman et al. (2005a).
Table 6 - Average number of employees per firm
Period Total
economy Entrants Exiters
1987-2007 11,9 4,6
1987-2000 13,2 5,0 5,8
2000-2005 9,5 4,0 4,2
1985-2005 12,8 5,5
1985-2000 13,9 5,9
2000-2007 9,4 3,9
Source: Own calculations based on Quadros de Pessoal, GEP, MTSS.
In Portugal, entrants size is less than half of the economy´s average size, in line with the results obtained
for other developed countries (Cabral, 2007; Bartelsman et al., 2005b; López-Garcia and Puente, 2006) for
all the observed periods, exception made for the Agriculture and Fishing sector and for the Construction
sector after 200. Still, according to Cabral (2005), Portugal has one of the lowest ratios of entrant and
exiter size with respect to total average size.
In order to properly assess the contribution of the sectoral specialisation versus the within sector to the trend of decreasing average firm size, we follow a decomposition18 inspired by Bartelsman et al. (2005a) and Bartelsman et al. (2004). In our analysis, the decomposition of average firm size is measured against the 1995 benchmark, in order to understand how much of the deviation in average firm size can be accrued to the fact that Portugal is specialised in sectors that display specific characteristics which impact in firm size and how much can be accrued to the within sectors discrepancies in average size.
Table 7 - Shift share analysis of the determinants firm size for Portugal
(Benchmark year = 1995)
Sectoral Composition
Average size of firms
Interaction between sectoral composition and
size
Total
1996 0,02 -0,30 -0,04 -0,32
1997 0,05 -0,59 -0,09 -0,63
1998 0,26 -0,37 -0,14 -0,25
1999 0,11 -0,87 -0,21 -0,98
2000 0,11 -1,34 -0,36 -1,59
2001 0,23 -1,32 -0,50 -1,59
2002 0,81 -1,87 -0,49 -1,55
2003 -0,21 -1,95 -0,18 -2,34
2004 -0,31 -1,98 -0,07 -2,36
2005 -0,20 -2,23 -0,27 -2,71
2006 -0,20 -2,21 -0,20 -2,62
Contribution coming from differences in:
Source: Own calculations based on Quadros de Pessoal, GEP, MTSS. Note: Done at a two digit level of the Classification of Economic Activities Rev. 2.1.
18 This decomposition exploits the difference between the mean in a given year and a benchmark mean. The formula considers an expression where
s
t is the annual average firm size for the total economy, ands
95 is the overall totaleconomy average in 1995, considered as the benchmark year.
Thus, the difference between the benchmark year and the overall mean in a given year, can be decomposed as follows:
95 95 95
(
95)
95(
95)
95(
95)(
95)
i i i i i i i i i i i i i i
t i t t i i t i t i t t
s s
s
s
s
s
s
s
s
s
s
Where
accounts for the sectoral composition,
sfor the differences within sectors and
sfor the relationship between size and sectoral composition, similar to a covariance measure. A positive term means that size and sectoral composition deviate from the 1995 benchmark in the same direction.In the expression ti ti i
s
,s
ti is the average firm size of sub-sector i at the 2 digit level of the Classification of Economic Activities Rev. 2.1. in year t and
ti is the share of firms in sub-sector i with respect to the total number ofOur findings show that the within sector effect plays a more important role in explainning differences in firm
size across the period 1995-2006, as the absolute value of its composition term is greater in absolute
value than that from the sectoral composition, and this effect is more expressive over time (Table 7). Even
controlling for sectoral specialisation, intrinsic characteristics of sectors are a fundamental determinant of
size structure. This can also indicate that the same sectors can be characterised by different and evolving
size structures over time19. The interaction term points to a somehow volatile correlation between the two
terms, indicating that possibly no strong correlation exits as the interaction term stays negative, despite the
signal change of the sectoral composition term after 200320. The total component values indicate that
overall firm size has been decreasing over time. The year of 2006 points to a stabilization in the evolution
of all the components.
Bartelsman et al. (2004 and 2005a) and Pagano and Schivardi (2003) have done a within sector
comparison of size differences between different countries, observing that the overall differences in
average firm size bettween countries do not solely reflect specialistion differences, but rather variations in
size within sectors. The mostl important finding of the industry decomposition for the manufacturing sector,
undertook by Bartelsman et al. (2005a), is that the within sector differences play the most importan role in
explaining differences in size across countries. This component is much larger than the one of sectoral
composition for almost all countries, including Portugal. In Bartelsman et al. (2004), those conclusions are
again underlined, but the overall sectoral composition now seems to play a more relevant role in countries
such as Portugal, Denmark and France. The interaction terms are correlated positively in both studies,
indicating a possible link between size structure and sectoral specialistion, which is not found in our
calculations.
4. Employment creation
There is considerable policy interest in the way in which enterprises grow and create employment,
particularly for small firms, which play a key role in labour creation and reallocation. If a country’s
environment tends to favour small sized firms, this should induce a proportional higher employment share
in sectors where technological factors favour small size (Pagano and Schivardi, 2000).
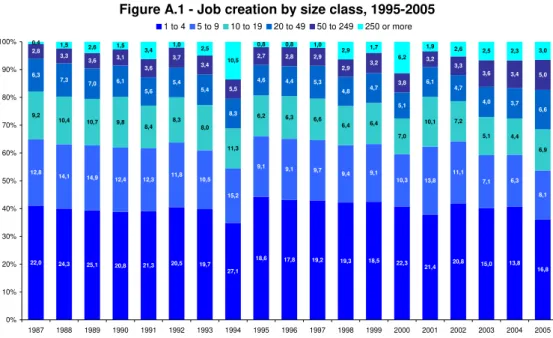
In Portugal, the important contribution to aggregate employment growth of the smallest size is sustained
by the outstanding employment performance of new firms (Figure A.1), as well as by the amount of
employment creation of small established firms. Over the whole period 1987-2005, firms with fewer than
20 employees created 2.828.287 jobs (65,7% of total) and are responsible for almost a quarter (23,4%) of
all job creation in the dataset from 1987-2005 (Table 8). The annual net rate of labour allocation of these
firms has been positive since 1987, which means small firms create more jobs than they destroy, even in
periods of economic downturn.
19
Firm size, summarised by average size and dispersion have an important sectoral component. The sectors with the largest standard deviation are “Electricity, gas and water supply” because of its heavily regulation and legal monopolies and “Financial activities” and “Public Administration, Defence and Social Security”, “Fishing” and “Education”. These are also the sectors with the average highest size. The less dispersed is “Gross and retail commerce” and “Hotels and restaurants”. Manufacturing standard deviation is twice as large as total deviation, in line with other countries (Bartelsman et al., 2005a).
When the coefficient of variation is used, the dispersion is highly reduced, with most sectors presenting a higher coefficient of variation than the country’s average.
Table 8 - Employment creation, by size class
1987-2005 Total employment
creation
Employment creation by entries
Employment destruction by exits
Net job gains by existing firms
Percentage created by firm rotation
Percentage created by existing firms
1 2 3 4=1-2+3 5=-(4-1)/1*100 6=4/1*100
1 to 4 1.401.816 1.068.780 704.531 1.037.567 26,0 74,0
5 to 9 818.107 575.004 378.679 621.782 24,0 76,0
10 to 19 608.364 414.043 312.102 506.423 16,8 83,2
20 to 49 590.713 386.045 340.473 545.141 7,7 92,3
50 to 249 539.847 363.199 387.057 563.705 -4,4 104,4
250 or more 342.969 317.208 307.236 332.997 2,9 97,1
Total 4.301.816 3.124.279 2.430.078 3.607.615 16,1 83,9
Source: Own calculations based on Quadros de Pessoal, GEP, MTSS.
The ratio composed by the annual growth rate of employees over the growth rate of employer enterprises
(Table A.4), shows that while small firms with fewer than 20 employees create a substantial amount of
employment, annual enterprise growth is higher than employment’s. A ratio below one is also
systematically obtained in the service sector from 1995 onwards, where small firms still account for a
larger share of employment than in manufacturing, because of the determinant role played by economies
of scale and technological factors. This fact also sheds some light on the evolution of firm size towards
smaller size classes.
5. Has firm size distribution changed in Portugal?
Cabral and Mata (2007) reveal that age also plays an important role in the process of shaping firm size
distribution. Although a deeper analysis of firm age and survival would be useful, it is not within the scope
of this analysis. We provide instead an overview of the time series perspective of the data, confirming that
average firm size has been markedly decreasing since 1988, for all the observed survival21 cohorts, from 1
to 5 years of survival (Figure 2). The gap in average firm size between the firms that managed to survive
for 1 and 5 years in 1992 (7 and 11 employees, respectively) is higher than that of 2007 (4 and 6
employees, respectively). Over time, there has been a closing of the gap of average firm size between the
first and the fifth year of survival, and particularly from the second to third year of survival, indicating that
firms that manage to survive longer do not necessarily grow in size.
21
Figure 2 – Average firm size of employer enterprises by years of survival after birth (number of employees)
6,9 6,8 7,3
6,9 7,2
5,9 6,0 7,3
4,9 5,1 5,1 5,4 5,1 5,5 5,0 4,5 4,9 4,8 5,2 4,3 8,1 8,1 8,4 7,9 7,8 6,7 6,6 8,4 5,7 5,8
6,0 6,3 6,2 6,1
5,3 5,0 5,6 5,5 9,1 8,8 9,1 8,3 8,6 7,2 7,3 9,4 6,4 6,6 6,8 7,4 6,8 6,8 5,7 5,4 6,1 9,9 9,5 9,8 9,0 9,4 7,7 8,0 10,5 7,3 7,3 7,6 7,9 7,2 7,3 6,1 5,8 6,8 10,8 9,6 10,8 9,5 9,9 8,3 8,5 11,3
8,2 8,2 8,0 8,1
7,5 7,9 6,4 6,0 5,9 5,6 4 5 6 7 8 9 10 11 12
1988 1989 1990 1991 1992 1993 1994 1995 1996 1997 1998 1999 2000 2001 2002 2003 2004 2005 2006 2007
N u m b e r of employees
After 1 year After 2 years After 3 years After 4 years After 5 years
Source: Own calculations based on Quadros de Pessoal, GEP, MTSS.
Therefore, an employer enterprise created in 1987, which survived for 5 years, had in 1992 an average 11
employees, compared to an average of 6 employees in 2007, for the same survival period (Figure 3).
Figure 3 – Average Firm size, 1992 and 2006 cohorts, number of employees (%)
0 2 4 6 8 10 12 After 1 year
After 2 years
After 3 years After 4 years
After 5 years
1992 2007
Source: Own calculations based on Quadros de Pessoal, GEP, MTSS.
Turning to firm size distribution, it is important to keep in mind that this distribution does depend heavily on
the type of data source considered (Cabral, 2007). Cabral and Mata (2003)22 tested the hypothesis that
more comprehensive data sets (which consider micro data as Quadros de Pessoal does) are described by
firm size distributions that evolve over time and are skewed to the right, thus being distinct from the
lognormal distribution curve23. Following the same methodology, we applied a nonparametric estimation
method, a gaussian kernel density smoother with a bandwidth of 0,5 to the logartithm of firm size to test if
firm size (expressed as the log of the employment of the firm) distribution is stable and approximately
lognormal for the population of active enterprises, births and deaths24.
22
They also refer that several feature of the Portuguese datasets are consistent with findings from other countries. 23 The lognormal distribution seems to empirically fit well data from commonly used databases and theoretically supports growth rates being independent from firm size.
24
We have found a distribution with a distinct shape from the Normal distribution, confirming Cabral and
Mata´s (2003) conclusions. Our results also show that firm size distribution is skewed to the right and that
the distribution is not stable over time. The whole firm size distribution has indeed been shifting to the
smallest size classes both in the service, manufacturing and construction sectors (Figure 4).
Figure 4 – Firm size distribution in 1985, 1995 and 2007
0
.1
.2
.3
.4
.5
.6
.7
.8
.9
1
De
n
s
it
y
0 1 2 3 4 5 6
Firm Size (Log10)
1985 Normal 1995 2007
kernel = gaussian, bandwidth = 0.5000
Source: Own calculations based on Quadros de Pessoal, GEP, MTSS.
In order to eliminate the possibility of missing out on relevant sector specific effects, we introduce the firm
size distribution in the manufacturing and service sector in Annex (Figures A.2 and A.3),
The visual results are confirmed by the normality test implemented, as described by D’Agostino, Balanger
and D’Agostino, Jr. (1990). The D’Agostino’s K2 test allows rejection of the normality, for all the
distributions presented in Table A.6 in Annex. The firm size distribution is thus positively skewed when
compared to the Normal distribution. Again, this pattern of right skewdness is not unique to Portugal
(Bartlesman et al., 2003; Cabral, 2007).
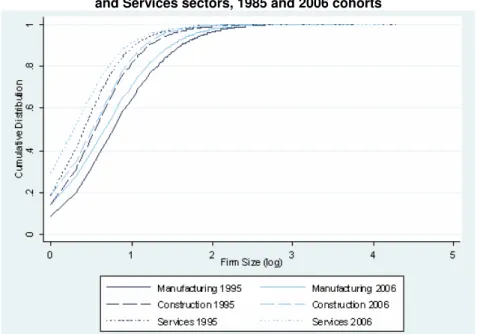
Considering the evolution of the firm size density distribution, it is also possible to observe that it becomes
biased to the left, with smaller rather than larger firms becoming predominant in all broad sectors
considered. Throughout time, this process drives the population of employer enterprises to smaller units
Figure 5 - The cumulative distribution function of firms size for the Manufacturing, Construction and Services sectors, 1985 and 2006 cohorts
Source: Own calculations based on Quadros de Pessoal, GEP, MTSS.
6. Final remarks
Over a period of more than 20 years, we find an overall decreasing average size for employer enterprises
in Portugal, which is extended to all broad sectors, NUT II regions, entrants and exiters in the market.
Given the growing importance of small enterprises, both in terms of the number of small employer
enterprises and their share in employment creation, it is important to address what kind of policy
implications should be drawn from the observed dynamics, given that small sized firms are usually the
BIBLIOGRAPHY
Ahn, S. (2001), “Firm dynamics and Productivity Growth: a review of micro evidence from OECD countries”, OECD
Economics Department Working Paper n. 297, Paris.
Bartelsman, E.J., S. Scarpetta, and F. Schivardi, (2005a), "Comparative Analysis of Firm Demographics and Survival:
Evidence from Micro-level Sources in OECD Countries", Industrial and Corporate Change, 14(3): 365–391.
Bartelsman, E.J., J. Haltiwanger, and S. Scarpetta (2004), "Microeconomic Evidence of Creative Destruction in
Industrial and Developing Countries", IZA Discussion Paper Series, No. 1374, October.
Consejo Superior de Cámaras de Comercio, Industria y Navegación de España (2003), “Creación y consolidación de
empresas. Políticas de apoyo”, Publicaciones.
Eurostat/OECD (2007), "Eurostat/OECD Manual on Business Demography Statistics".
Núñez, Soledad Ramos (2004), “Salida, entrada y tamaño de las empresas españolas”, Boletín económico - Banco de
España, Nº. 3, 2004, pag. 53.
OECD (2008), "Measuring Entrepreneurship: A digest of indicators".
OECD (2005), "The 2005 OECD SME and Entrepreneurship Outlook", Paris.
Pagano, P. and F. Schivardi (2003), “Firm Size Distribution and Growth”, Scandinavian Journal of Economics, 105 (2):
255-274.
López-Garcia, P. and Sergio Puente (2009), "Employment generation by small firms in Spain", Documentos de Trabajo
nº 903, Banco de España.
ANNEX - Tables and figures
Table A.1 - Active Employer enterprises population, by size class (number)
Total 1 - 4 5 - 9 10 - 19 20-49 50 - 249 + 250
1985 102.031 50.886 23.671 13.409 8.650 4.538 877
1986 106.741 53.851 24.861 13.780 8.805 4.586 858
1987 110.842 55.970 25.944 14.172 9.180 4.718 858
1988 122.754 62.914 28.586 15.583 9.834 5.007 830
1989 137.133 71.735 31.641 16.840 10.667 5.342 908
1990 140.293 73.273 32.286 17.237 11.017 5.570 910
1991 148.578 79.096 33.779 17.810 11.263 5.705 925
1992 159.175 86.380 35.729 18.690 11.711 5.774 891
1993 165.860 92.135 36.927 18.892 11.491 5.585 830
1994 184.297 106.955 40.156 19.534 11.562 5.287 803
1995 192.242 114.284 40.872 19.564 11.339 5.372 811
1996 197.546 118.815 41.885 19.563 11.250 5.251 782
1997 213.582 129.473 44.917 20.946 11.918 5.539 789
1998 228.816 140.128 47.613 22.051 12.498 5.720 806
1999 244.238 149.921 50.745 23.702 13.119 5.911 840
2000 268.689 168.588 54.217 25.131 13.827 6.089 837
2001 284.002 177.027 57.830 27.200 14.648 6.399 898
2002 299.788 189.648 60.494 28.017 14.922 5.879 828
2003 306.561 196.986 60.484 27.731 14.335 6.178 847
2004 312.938 203.642 60.226 27.093 14.713 6.380 884
2005 340.775 226.362 62.590 28.591 15.649 6.639 944
2006 344.021 230.318 61.776 28.359 15.872 6.756 940
2007 354.920 238.304 62.846 29.281 16.539 6.988 962
Source: Own calculations based on Quadros de Pessoal , GEP, MTSS.
Table A.2 - Average firm size number of employees (Number of employees /Active employer enterprises)
1995 1996 1997 1998 1999 2000 2001 2002 2003 2004 2005 2006
Agriculture and Fishing 5,7 5,8 5,5 5,4 5,3 5,0 5,0 5,0 4,8 4,7 3,6 3,7
Manufacturing 22,5 22,0 20,9 20,4 19,8 18,9 18,5 17,4 17,1 17,1 16,6 16,4
Services 8,8 8,6 8,6 8,6 8,6 8,4 8,5 8,0 8,0 8,0 8,0 8,1
Construction 10,5 10,4 10,0 9,2 8,6 8,1 8,6 8,2 7,9 8,1 8,1 8,2
Total 11,6 11,3 11,0 10,8 10,6 10,0 10,0 9,4 9,3 9,3 9,0 9,0
Source: Own calculations based on Quadros de Pessoal , GEP, MTSS.
Note: This disaggregation is only provided after 1995 due to the start of SEC 95, and up to 2006 due to the problems of compatibility with CAE Rev. 3 after 2007.
Table A.3 - Share of Enterprise births, by broad sectors in total economy (%)
1995 1996 1997 1998 1999 2000 2001 2002 2003 2004 2005 2006
Agriculture and Fishing 4,5 4,6 5,2 4,1 3,8 3,5 3,5 3,7 3,9 4,3 14,9 5,8
Manufacturing 15,5 14,6 15,0 14,3 14,1 12,2 14,2 11,6 10,4 9,8 8,7 9,2
Services 68,9 68,9 66,1 65,9 64,7 65,4 59,5 65,2 71,4 72,4 64,5 71,6
Construction 11,1 11,9 13,7 15,7 17,4 19,0 22,8 19,4 14,2 13,5 11,9 13,3
Source: Author’s calculations based on Quadros de Pessoal GEP, MTSS
Table A.4 - Growth rates of employees and active employer enterprises in enterprises with fewer than 20 employees and ratio of growth rates
1986 1987 1988 1989 1990 1991 1992 1993 1994 1995 1996 1997 1998 1999 2000 2001 2002 2003 2004 2005 2006 2007
Growth rate of employees in active employer enterprises with fewer than
20 employees
4,0 3,7 10,3 10,3 2,2 4,7 5,9 3,1 8,5 2,4 1,9 7,4 6,4 6,8 7,8 6,4 4,6 0,7 -0,2 6,0 -0,3 2,7 Growth rate of active employer
enterprises with fewer than 20 employees
5,6 4,1 11,7 13,0 2,1 6,9 8,2 5,7 14,0 5,5 3,6 8,5 7,7 6,9 11,0 5,4 6,5 2,9 2,5 9,5 1,1 3,1 Ratio of Employment over Enterprise
growth rate 0,7 0,9 0,9 0,8 1,0 0,7 0,7 0,5 0,6 0,4 0,5 0,9 0,8 1,0 0,7 1,2 0,7 0,2 -0,1 0,6 -0,3 0,9 Source: Author’s calculations based on Quadros de Pessoal GEP, MTSS
Table A.5 - Firm size across industries and time
Industry Year Mean employment Standard deviation of employment Coefficient of variation
Share of industry employment in total
employment (%)
Share of enterprises in total
economy (%)
1995 5,7 13,0 2,3 2,0 4,0
1996 5,8 12,6 2,2 2,1 4,0
1997 5,5 11,9 2,2 2,1 4,2
1998 5,4 12,8 2,3 2,1 4,1
1999 5,3 9,8 1,8 2,0 3,9
2000 5,0 9,3 1,9 1,9 3,7
2001 5,0 7,5 1,5 1,9 3,7
2002 5,0 6,6 1,3 2,0 3,7
2003 4,8 4,7 1,0 1,9 3,6
2004 4,7 4,1 0,9 1,9 3,7
2005 3,6 3,3 0,9 2,2 5,6
2006 3,7 2,9 0,8 2,1 5,2
1995 22,5 130,2 5,8 39,3 20,4
1996 22,0 130,6 5,9 39,3 19,4
1997 20,9 116,3 5,6 37,0 19,4
1998 20,4 109,5 5,4 35,7 18,9
1999 19,8 95,9 4,8 34,6 18,4
2000 18,9 73,9 3,9 32,8 17,4
2001 18,5 54,7 3,0 30,8 16,7
2002 17,4 57,6 3,3 29,3 15,8
2003 17,1 54,6 3,2 28,4 15,5
2004 17,1 45,0 2,6 27,6 15,0
2005 16,6 35,8 2,2 26,0 14,1
2006 16,4 32,2 2,0 25,0 13,7
1995 8,8 23,2 2,6 49,1 65,0
1996 8,6 22,1 2,6 49,1 65,7
1997 8,6 19,4 2,3 50,7 65,1
1998 8,6 17,9 2,1 51,8 64,9
1999 8,6 16,9 2,0 52,9 64,7
2000 8,4 15,0 1,8 53,9 64,7
2001 8,5 13,4 1,6 54,3 64,5
2002 8,0 14,6 1,8 55,3 65,1
2003 8,0 13,1 1,6 56,9 66,0
2004 8,0 12,0 1,5 57,8 66,8
2005 8,0 9,6 1,2 59,2 66,3
2006 8,1 9,6 1,2 60,3 67,3
1995 11,6 61,3 5,3 100 100
1996 11,3 61,0 5,4 100 100
1997 11,0 54,5 5,0 100 100
1998 10,8 51,3 4,8 100 100
1999 10,6 45,3 4,3 100 100
2000 10,0 35,6 3,5 100 100
2001 10,0 27,2 2,7 100 100
2002 9,4 28,4 3,0 100 100
2003 9,3 26,9 2,9 100 100
2004 9,3 22,7 2,5 100 100
2005 9,0 18,6 2,1 100 100
2006 9,0 17,0 1,9 100 100
Agriculture and Fishing
Manufacturing
Services
Total economy
Source: Own calculations based on Quadros de Pessoal , GEP, MTSS.
Note: Done for sectors at one letter level of the Portuguese Classification of Economic Activities (CAE Rev. 2.1.).
Figure A.1 - Job creation by size class, 1995-2005
22,0 24,3 25,1 20,8 21,3 20,5 19,7 27,1
18,6 17,8 19,2 19,3 18,5 22,3
21,4 20,8 15,0 13,8 16,8 12,8
14,1 14,9 12,4 12,3 11,8 10,5 15,2 9,1 9,1 9,7 9,4 9,1 10,3 13,8 11,1 7,1 6,3 8,1 9,2
10,4 10,7 9,8 8,4
8,3 8,0
11,3
6,2 6,3 6,6
6,4 6,4 7,0 10,1 7,2 5,1 4,4 6,9 6,3 7,3 7,0 6,1 5,6 5,4 5,4 8,3
4,6 4,4 5,3
4,8 4,7 5,1 6,1 4,7 4,0 3,7 6,6 2,8 3,3 3,6 3,1 3,6 3,7 3,4 5,5
2,7 2,8 2,9
2,9 3,2 3,8
3,2 3,3
3,6 3,4 5,0
0,4 1,5 2,6 1,5
3,4 1,0 2,5 10,5
0,8 0,8 1,0
2,9 1,7 6,2
1,9 2,6
2,5 2,3 3,0
0% 10% 20% 30% 40% 50% 60% 70% 80% 90% 100%
1987 1988 1989 1990 1991 1992 1993 1994 1995 1996 1997 1998 1999 2000 2001 2002 2003 2004 2005 1 to 4 5 to 9 10 to 19 20 to 49 50 to 249 250 or more
Figure A.2 and A.3 - Firm size distribution in 1995, 2000 and 2006 in the manufacturing and service sector
0
.1
.2
.3
.4
.5
.6
.7
.8
.9
1
De
n
s
it
y
0 1 2 3 4 5 6
Firm Size (log10)
1995 Normal 2000 2006
kernel = gaussian, bandwidth = 0.5000
Population Firm Size Distribution in 1995, 2000 and 2006 - Manufacturing
Source: Own calculations based on Quadros de Pessoal, GEP, MTSS.
0
.1
.2
.3
.4
.5
.6
.7
.8
.9
1
De
n
s
it
y
0 1 2 3 4 5 6
Firm Size (log10)
1995 Normal 2000 2006
kernel = gaussian, bandwidth = 0.5000
Population Firm Size Distribution in 1995, 2000 and 2006 - Services
Source: Own calculations based on Quadros de Pessoal, GEP, MTSS.
Figure A.4, A.5 and A.6 - Firm size distribution for the 1990, 1995 and 2000 cohorts
0
.1
.2
.3
.4
.5
.6
.7
.8
.9
1
De
n
s
it
y
-1 0 1 2 3 4
Firm Size (Log10)
1990 Normal 1995 2000 2005
kernel = gaussian, bandwidth = 0.5000
Firm Size Distribution - Cohort 1990
0
.1
.2
.3
.4
.5
.6
.7
.8
.9
1
De
n
s
it
y
-1 0 1 2 3 4
Firm Size (Log10)
1995 Normal 2000 2005
kernel = gaussian, bandwidth = 0.5000
Firm Size Distribution - Cohort 1995
0
.1
.2
.3
.4
.5
.6
.7
.8
.9
1
De
n
s
it
y
-1 0 1 2 3 4
Firm Size (Log10)
2000 Normal 2005 2007
kernel = gaussian, bandwidth = 0.5000
Firm Size Distribution - Cohort 2000
Table A.6 – Normality Tests
. sktest l10_pemp if N==1 & ano==1985, noadjust
Skewness/Kurtosis tests for Normality --- joint ---
Variable | Pr(Skewness) Pr(Kurtosis) chi2(2) Prob>chi2 ---+---
l10_pemp | 0.000 0.000 16642.01 0.0000
. sktest l10_pemp if N==1 & ano==1995, noadjust
Skewness/Kurtosis tests for Normality --- joint ---
Variable | Pr(Skewness) Pr(Kurtosis) chi2(2) Prob>chi2 ---+---
l10_pemp | 0.000 0.000 31632.23 0.0000
. sktest l10_pemp if N==1 & ano==2007, noadjust
Skewness/Kurtosis tests for Normality --- joint ---
Variable | Pr(Skewness) Pr(Kurtosis) chi2(2) Prob>chi2 ---+---
l10_pemp | 0.000 0.000 62901.32 0.0000
. sktest l10_pemp if B==1 & ano==1987, noadjust
Skewness/Kurtosis tests for Normality --- joint ---
Variable | Pr(Skewness) Pr(Kurtosis) chi2(2) Prob>chi2 ---+---
l10_pemp | 0.000 0.000 2451.56 0.0000
. sktest l10_pemp if B==1 & ano==1997, noadjust
Skewness/Kurtosis tests for Normality --- joint ---
Variable | Pr(Skewness) Pr(Kurtosis) chi2(2) Prob>chi2 ---+---
l10_pemp | 0.000 0.000 6770.69 0.0000
. sktest l10_pemp if B==1 & ano==2007, noadjust
Skewness/Kurtosis tests for Normality --- joint ---
Variable | Pr(Skewness) Pr(Kurtosis) chi2(2) Prob>chi2 ---+---
l10_pemp | 0.000 0.000 13754.89 0.0000
. sktest l10_pemp if D==1 & ano==1985, noadjust
Skewness/Kurtosis tests for Normality --- joint ---
Variable | Pr(Skewness) Pr(Kurtosis) chi2(2) Prob>chi2 ---+---
l10_pemp | 0.000 0.000 2195.88 0.0000
. sktest l10_pemp if D==1 & ano==1995, noadjust
Skewness/Kurtosis tests for Normality --- joint ---
Variable | Pr(Skewness) Pr(Kurtosis) chi2(2) Prob>chi2 ---+---
l10_pemp | 0.000 0.000 4932.89 0.0000
. sktest l10_pemp if D==1 & ano==2005, noadjust
Skewness/Kurtosis tests for Normality --- joint ---
Variable | Pr(Skewness) Pr(Kurtosis) chi2(2) Prob>chi2 ---+---