EIRASS International Conference 9th-12th July 2006
Budapest - Hungary
DIRECT SELLING: FINDING CONSUMER SEGMENTS
Bráulio Alturas 1 Maria da Conceição Santos 2
Rui Brites 3
ISCTE – Business School (Lisbon - Portugal)
1
Auxiliary Professor of ISCTE, Av. das Forças Armadas 1600-083 LISBOA, Portugal, Phone: (+351)217903066, Fax: (+351)217903099, E-mail: [email protected]
Direct selling: Finding Consumer Segments
Abstract
This paper considers the segmentation of direct selling customers applying a quantitative approach with cluster analysis. Direct selling has been exhibited in the last decade a substantial growth in sales revenues and number of salespeople involved. Also the acceptance of the consumers is increasing; in spite of they are showing more and more demanding and informed. The literature reveals that some segmentation had been made, but we haven’t found any cluster analysis. The results show that three clusters have been identified with different characteristics. These results can have great importance for direct salespeople who seek better understanding and predict post consumption behaviours.
Keywords: direct selling, consumer behaviour, segmentation, cluster analysis
1. Introduction
Direct Selling is a marketing method defined as “face-to-face selling away from fixed retail location” (May 1979; Peterson & Wotruba 1996; Brodie et al 2002b, Wotruba et al 2005). Direct Selling typically includes home selling situations such as door-to-door solicitations, appointments, referrals and product parties, as well as catalogues and the Internet to disseminate information (Alturas 2003). According to the Direct Selling Association US, direct selling organizations (DSO’s) in the USA grew in sales volume from $14,98 billion in 1993 to $29,55 billion in 2003, and the number of salespeople participating in this activity in the USA grew from 5,7 million in 1993 to 13,3 million in 2003 (Direct Selling Association US 2004). In the European Union sales reached 7597 euros ($9442) from the efforts of over 2,3 million (83% women) in 2003 (Federation of European Direct Selling Associations 2004). Worldwide sales by direct selling organizations reached $88,87 billion from the efforts of over 49 million salespeople in 52 countries (World Federation of Direct Selling Associations 2004).
By design, direct selling firms rely more on the selling skills of their sales force than on indirect communications such as advertising (Vander Nat & Keep 2002). Direct salespeople “are usually independent contractors, not company employers, and opportunities with direct selling companies are open to persons from all backgrounds, experience levels, and personal characteristics. Clearly, direct selling is a business activity of significant importance both in financial and human terms” (Brodie et al 2002b, p.67).
Some earlier studies tried to identify consumer segments of direct selling customers (Darian 1987; Peterson et al 1989). The results indicate that the following groups are most likely to be in-home shoppers: house-wives and part-time female workers with preschool children, single males under 40 years old, households where the female head is aged 40-49 years, and households in the middle income groups (Darian 1987). Purchasers also tended to be younger, more educated, and more affluent than no purchasers (Peterson et al 1989). But in the literature which has been studied we didn’t find any cluster analysis to define those segments.
2. A view of direct selling
Despite being the oldest method of commercial distribution known to mankind, direct selling is not well understood (Albaum 1992; Peterson & Wotruba 1996). At times, direct selling is improperly equated with undesirable manifestations like the pyramid scheme (Ella 1973; Vander Nat & Keep 2002), and frequently direct selling is confused with direct marketing (Bauer & Miglautsch 1992). Direct marketing is defined as “Relational marketing process of prospecting, conversion, and maintenance that involves information feedback and control at the individual level by using direct response advertising with tracking codes” (Bauer & Miglautsch 1992). So we can find several methods of commercial distribution which are direct marketing but not direct selling, as teleshopping, mail order, etc.
Almost all direct selling organizations (DSO’s) use self-employed independent contractors who undertake the selling function, typically on a part-time basis (Bone 2006). Usually the salespersons begin with high expectations but in many cases the work is harder than they think, leading to high sellers’ turnover (Wotruba & Tyagi 1991; Brodie et al 2002a).
DSO’s can use personal selling or group selling. Major modes of direct selling include one-on-one selling at home, one-on-one selling at a workplace, a sales party at a consumer’s home, and a sales party at a workplace, church, or other location (Peterson et al 1989). The products that are successfully marketed through direct selling should (ideally) possess some form of distinctiveness, require some demonstration, and generate repeated sales (Peterson & Wotruba 1996). Several types of products can be sold by direct selling. The products can be “big ticket” or “low ticket” products. Apart from big ticket direct sales such as vacuum cleaners, where DSOs tend to use well-trained, full-time direct sellers, most DSOs rely on those whom direct selling is a part-time occupation (Berry 1997).
DSOs can use two types of organization structures, identified as multilevel and single level (Biggart 1989; Peterson & Wotruba 1996; Berry 1997; Brodie et al 2002a, 2002b). “In a multilevel (ML) organization (also called network marketing organization); direct salespeople recruit, train, and supervise other direct salespeople who become part of the recruiter’s organization. In return, the recruiting salesperson receives compensation on the sales of organization members as well as on his or her sales. In a single level (SL) organization, the salespeople do not build their own organizations via recruiting and training, but rather focus their efforts on selling and achieving compensation based on their own sales” (Brodie et al 2002b, p.67)
Several authors have undertaken research on direct selling, either on the DSOs side (Crawford & Garland 1988; Wotruba 1990; Wotruba & Tyagi 1991), or on the consumer side (Peters & Ford 1972; Cunningham & Cunningham 1973; Gillett 1976; Taylor 1978; Darian 1987; Frenzen & Davis 1990; Sargeant & Msweli 1999); some studies found advantages and disadvantages of direct selling for the consumers (Peterson et al 1989; Barnowe & McNabb 1992; Kustin & Jones 1995; Wotruba & Pribova 1996), but in the literature reviewed we don’t find any research that presents a cluster analysis of direct selling consumer’s. The segmentation – from the marketing managerial point of view – is an obvious need, in order to cope with the large diversity of specific consumer evaluations and behaviours.
3. The relationship between the consumer and the salesperson
Direct selling is usually undertaken by the sales forces of the DSOs involved in the industry. These sales forces are largely made up of self-employed, part-time, independent contractors (ICs). However these ICs usually trade under the 'banner', or logo, of a larger enterprise. Many of the well-known DSOs such as Avon Cosmetics, Amway, Herbalife, Mary Kay Cosmetics and Tupperware are, in fact, major, multi-national corporations with sales revenues measured in billions of dollars (Brodie et al 2004). As ICs direct salespeople are, for the most part, part-time working women. Despite their numbers little previous academic research has been conducted into this sizeable army of nominally self-employed individuals. Though often referred by the DSOs themselves as “sales force”, their legal status is self-employed and their income based predominantly on sales commissions of the branded goods sold for the companies they serve (Stanworth et al 2004).
The influence of the salesperson on the consumer satisfaction is quite important because direct selling can be defined as “the obtaining of orders and the supply of consumer goods to private individuals away from normal retail premises, usually in their homes, or place of work, in transactions initiated by a salesperson” (Berry 1997, p.xxi). So the DSO’s rely mainly on personal relationship to obtain sales. The main advantages attributed to direct selling by the consumers are: convenience, personal attention and the ability to examine products (Peterson et al 1989; Wotruba & Pribova 1996).
Also the salesperson influence can reduce the perceived risk of shopping experiences. Research has shown that the willingness to purchase products is inversely related to the amount of perceived risk associated with a purchase decision (Sharma et al 1983; Mitchell & Prince 1993). A research undertaken on the United States shows that buying from direct selling is perceived as less risky than other non-store shopping modes such as telephone shopping (Peterson et al 1989). Also recent research shows that there is a negative correlation between perceived risk and direct selling acceptance and a positive correlation between direct selling acceptance and satisfaction (Alturas & Santos 2004).
4. Methodological considerations
In order to find the consumer segments we designed a two-phase research methodology: 1. Exploratory phase, including in-depth interviews with a sample of 11 managers of DSO’s (from the 36 that we found operating in Portugal), and interviews with salespersons and costumers of the same DSO’s.
2. Empiric phase, based on a questionnaire developed through the contribution of the literature review and the interviews of the previous phase. In this questionnaire we made questions to verify the purchase frequency, the intention to buy, the characteristics of the purchase, the consumer characteristics and also we include some questions to compare direct selling with other forms of non-store retailing. The theoretical universe for this research is the adult Portuguese consumer from the urban metropolitan area of Lisbon. To collect data we use two different ways: cooperation was obtained from students of a Lisbon high school who applied the questionnaire on their family and neighbours; and through our colleague professors from our University. We obtained a sample of 378 responses to the questionnaire from a total of 1200 potential respondents (response rate of 31.5%).
In order to evaluate the importance of the purchase characteristics respondents were asked to rate a set of 40 items (9 about the DSO, 14 about the contextual factors, 7 about the product and 10 about the sales person) in a 5-point Likert scale anchored by 1 (not important at all) to 5 (extremely important). Also a 5-point Likert scale was used for the intention to buy (from 1 “absolutely yes” to 5 “absolutely no”) and for the satisfaction (from 1 “not satisfied at all” to 5 “extremely satisfied”) (Alturas et al 2005). We decided not to derive any hypotheses because, although hypotheses have the advantage of forcing researchers to think systematically about what they want to study, they exhibit a potential disadvantage in the way that they may divert a researcher’s attention too far away from other interesting facets of the collected data (Bryman & Cramer 2001, p.4). The principal aspect of interest to approach was the segmentation of the market of the direct selling, segmentation which had already been proposed previously (Peterson et al 1989; Frenzen & Davis 1990). In order to accomplish that segmentation we compute a cluster analysis with the objective of identifying the existence of different profiles of consumers. Those profiles or segments will be representative if the clusters become homogeneous and clearly identified, or if the found clusters should be homogeneous internally and heterogeneous in some relation to the other ones (Van Raaij & Verhallen 1994).
5. Findings
The preliminary results show that 13.5% of the respondents will by sure (absolutely yes) buy some products by direct selling in the next 12 months, and 19.3% will most probably buy some products. Also 38.6% will probably buy some products, 20.4% will not most probably buy some products and finally 7.7% will not buy any product.
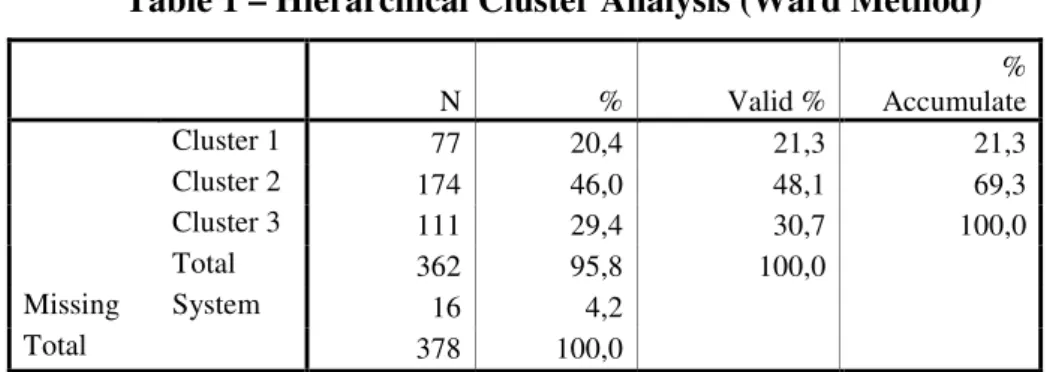
After the data collection we computed a principal component factor analysis to reduce our data and we found three composites about the importance of the DSO: Credibility (Cronbach Alpha of 0.74), Availability of Products (Cronbach Alpha of 0.86) and Company Image (Cronbach Alpha of 0.66); four composites about the importance of Contextual Factors: Purchase in Group (Cronbach Alpha of 0.86), Product Selection (Cronbach Alpha of 0.88), Convenience (Cronbach Alpha of 0.75) and Flexibility (Cronbach Alpha of 0.68); two composites about the importance of the Product: Value for Money (Cronbach Alpha of 0.75) and Specificity of the Product (Cronbach Alpha of 0.63); three composites about the Sales Person: Professionalism (Cronbach Alpha of 0.89), Pressure to Buy (Cronbach Alpha of 0.80) and Trust (Cronbach Alpha of 0.73). Then it was computed a hierarchical cluster analysis using the Ward’s method of grouping which optimize the minimum variance inside the groups, containing the objects to provoke a minimum increase of the sum of squares of the mistakes and has tendency to constitute groups with identical dimensions. This method allowed obtaining the gathering coefficients, and starting from the coefficients with higher value we opted for a solution of three clusters as we can verify on Table 1.
Table 1 – Hierarchical Cluster Analysis (Ward Method) N % Valid % % Accumulate Cluster 1 77 20,4 21,3 21,3 Cluster 2 174 46,0 48,1 69,3 Cluster 3 111 29,4 30,7 100,0 Total 362 95,8 100,0 Missing System 16 4,2 Total 378 100,0
The shopping characteristics lead to the identification of consumer clusters. This methodology was already used in other studies of consumer clusters (Reynolds & Beatty 1999; Balabanis & Reynolds 2002). So the chosen variables to accomplish the cluster analysis were the components of the purchase characteristics (DSO, contextual factors, product and sales person), as we can verify on the graph of Figure 1.
Figure 1 – Graphic of clusters characterization
Tru st P re ss ure to B uy P rofe ssio na lism Fle xib ility V alu e for m on ey Fle xib ility C on vin ien ce P ro du ct se le ction P urc ha se in g ro up C om pa ny im age A va ila bility C re dib ility 5,0 4,5 4,0 3,5 3,0 2,5 2,0 1,5 1,0
Clusters
1 2 3The twelve variables used in the cluster analysis are the ones which constitute the constructs that characterize the purchase through direct selling. By this way it was possible to obtain three clusters clearly different which represent three different purchase profiles. Of noticing that, in spite of the differences among the clusters the three characteristics to which more importance is attributed are the same for all the clusters: "credibility", "value for money" and "professionalism".
To better characterize the clusters a variance analysis (ANOVA) was accomplished to verify the effect of the clusters on the purchase frequency. A larger purchase frequency was verified on the part of cluster 1 (average = 1,45), being followed by cluster 2 (average = 1,43), both quite distant of cluster 3 (average = 1,28) that sharply is constituted by individuals who accomplish less purchases than the one of the other two clusters, the result showed that exists a significant effect of the clusters on the purchase frequency: F(2,303) = 3,32; p = 0,04.
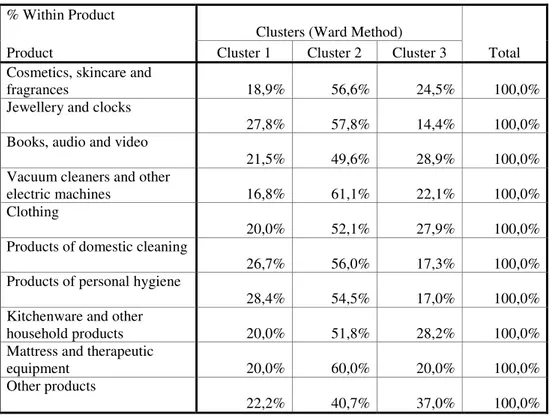
To complete the previous analysis, the crossing of the clusters was accomplished with the products bought by the respondents. It was verified that the individuals of cluster 2 buy more of all types of products. The individuals of cluster 1 buy more "jewellery and clocks", "products of domestic cleaning" and "products of personal hygiene" than the individuals of cluster 3, and these buy more of all the remaining types of products than the individuals of cluster 1, as we can observe on Table 2.
Table 2 – Characterization of the Clusters for bought products % Within Product
Clusters (Ward Method)
Product Cluster 1 Cluster 2 Cluster 3 Total
Cosmetics, skincare and
fragrances 18,9% 56,6% 24,5% 100,0%
Jewellery and clocks
27,8% 57,8% 14,4% 100,0%
Books, audio and video
21,5% 49,6% 28,9% 100,0%
Vacuum cleaners and other
electric machines 16,8% 61,1% 22,1% 100,0%
Clothing
20,0% 52,1% 27,9% 100,0%
Products of domestic cleaning
26,7% 56,0% 17,3% 100,0%
Products of personal hygiene
28,4% 54,5% 17,0% 100,0%
Kitchenware and other
household products 20,0% 51,8% 28,2% 100,0%
Mattress and therapeutic
equipment 20,0% 60,0% 20,0% 100,0%
Other products
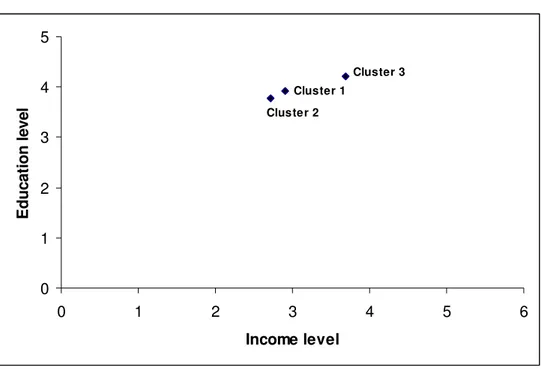
Continuously a socio-economical characterization of the three clusters was accomplished. For that effect the crossing of the clusters was accomplished with the variables which characterize socio-economically the respondents. We compute tests to verify if the differences obtained in the values for the several clusters were significant: Test of the Pearson qui square in the case of nominal variables and test of Kruskal Wallis in the case of the ordinal variables. As we can observe on Table 3 the three clusters are clearly constituted by different individuals. Cluster 1 has older people, with secondary teaching and medium incomes. Cluster 2 has younger people, with less literary qualifications and incomes relatively low. Cluster 3 has people between 30 and 50 years old with superior formation and higher incomes. The relative positioning can be observed on Figure 2.
Table 3 – General Characterization of the Clusters Clusters (Ward Method)
Cluster 1 Cluster 2 Cluster 3
Less men
More than 50 years old Younger people (less to 30 years) Between 30 and 50 years
Secondary education Basic education Higher education
More independent workers More entrepreneurs, students, reformed and domestic
More workers due to somebody else and unemployed
More widowers and unions More married and separated /
divorced people More married people
Incomes up to 1000 € and
among 1500 € and 2000 € Income among 1000 € and 1500 € Income more than 2000 €
Figure 2 – Positioning of the clusters
Cluster 3 Clus te r 2 Cluster 1 0 1 2 3 4 5 0 1 2 3 4 5 6 Income level E d u c a ti o n l e v e l
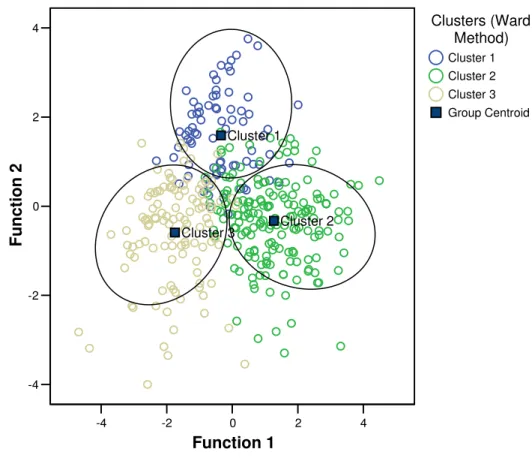
It was also accomplished a discriminant analysis, that is a multivariate technique which can be used when we intend to classify individuals with based in a categorical variable that registers a certain occurrence. In the present case the discriminant analysis was accomplished with the objective of validate and confirm the classifications obtained in the cluster analysis. In the discriminant analysis it was used as categorical variable the classification in the clusters and the variables of the constructs which characterize the purchase (DSO, contextual factors, product and sales person) as independent variables. We have verified that 89,2% of the cases are well classified, and so worth the obtained clusters. With the discriminant analysis we obtained two canonical discriminant functions, having verified that Function 1 has larger discriminant power than Function 2 although both are plenty significant (sig = 0,000). The canonical discriminant functions can be observed on Figure 3.
Figure 3 – Canonical Discriminant Functions
-4 -2 0 2 4 Function 1 -4 -2 0 2 4 F u n c ti o n 2 Cluster 1 Cluster 2 Cluster 3 Clusters (Ward Method) Cluster 1 Cluster 2 Cluster 3 Group Centroid
These empirical evidences could be relevant for DSO’s and their direct salespeople who seek better understanding and predict post consumption behaviours, looking for a model which explains why a customer would probably select direct selling to buy a specific product and why he probably will become satisfied with some DSO or brand.
6. Key references
Albaum, Gerald (1992), “Current Status and Future Directions for Research on Direct Selling Channels”, Journal of Marketing Channels, 2, 2, 95-117.
Alturas, Bráulio (2003), “Direct Selling: From door to door to e-commerce”, WWW/Internet 2003, IADIS International Conference Proceedings, Algarve: Pedro Isaías & Nitya Karmakar, 1153-1157.
Alturas, Bráulio and Maria da Conceição Santos (2004), “Direct Selling: The role of risk in consumer’s acceptance and satisfaction”, Virtue in Marketing, Proceedings of the Academy of Marketing Annual Conference, Cheltenham, UK, 39.
Alturas, Bráulio; Maria da Conceição Santos and Ivo Pereira (2005), “Determinants of consumers' satisfaction and acceptance of direct selling”, Marketing: Building Business, Shaping Society, Proceedings of the Academy of Marketing Annual Conference, Dublin, Ireland, 91.
Balabanis, George & Nina Reynolds (2002), “E-store Satisfaction and Loyalty: The Impact of Shopping Clusters”, Marketing in a Changing World, 31st EMAC Conference Proceedings, Braga: Minoo Farhangmehr, 83.
Barnowe, J. Thad and David E. McNabb (1992), “Consumer Responses to Direct Selling: Love, Hate… Buy?”, Journal of Marketing Channels, 2, 2, 25-40.
Bauer, Connie L. and John Miglautsch (1992), “A conceptual definition of direct marketing”, Journal of Direct Marketing, 6, 2 (Spring), 7-17.
Berry, Richard (1997), “Direct Selling: From door to door to network marketing”, Oxford: Butterworth-Heinemann.
Biggart, Nicole Woolsey (1989), “Charismatic Capitalism – Direct Selling Organizations in America”, Chicago: University of Chicago Press.
Bone, John (2006), “The longest day: 'flexible' contracts, performance-related pay and risk shifting in the UK direct selling sector”, Work, Employment & Society, 20, 1, (March); 109.
Brodie, Stewart; John Stanworth and Thomas R. Wotruba (2002a), “Direct Sales franchises in the UK: A self-employment grey area”, International Small Business Journal, 20, 1 (February), 53-76.
Brodie, Stewart; John Stanworth and Thomas R. Wotruba (2002b), “Comparisons of Salespeople in Multilevel vs. Single Level Direct Selling Organizations”, Journal of Personal Selling & Sales Management, 22, 2 (Spring), 67-75.
Brodie, Stewart; Gerald Albaum; Der-Fa Robert Chen; Leonardo Garcia; Rowan Kennedy; Pumela Msweli-Mbanga; Elina Oksanen-Ylikoski and Thomas R. Wotruba (2004), “Public Perceptions of Direct Selling: An International Perspective”, London: University of Westminster Press.
Bryman, Alan & Duncan Cramer (2001), “Quantitative Data Analysis with SPSS release 10 for Windows: A guide for social scientists”, London: Routledge.
Crawford, John C. and Barbara C. Garland (1988), “A Profile of a Party Plan Sales Force”, Akron Business & Economic Review, 19, 4 (Winter), 28-37.
Cunningham, Isabella C. M. and William Hughes Cunningham (1973), “The Urban In-home Shopper: Socio-economic and Attitudinal Characteristics”, Journal of Retailing, 49, 3 (Fall), 42-50.
Darian, Jean C. (1987), “In-Home Shopping: Are There Consumer Segments?”, Journal of Retailing, 63, 2 (Summer), 163-186.
Direct Selling Association US (2004), “DSA’s 2004 Growth & Outlook Survey”, http://www.dsa.org/research/numbers.htm.
Ella, Vincent G. (1973), “Multi-Level or Pyramid Sales Schemes: Fraud or Free Enterprise”, South Dakota Law Review, 18 (Spring), 358-393.
Federation of European Direct Selling Associations (2004), “International Statistics 2004”, http://www.fedsa.be/.
Frenzen, Jonathan K. and Harry L. Davis (1990), “Purchasing Behavior In Embedded Markets”, Journal of Consumer Research, 17, 1 (June), 1-12.
Gillett, Peter L. (1976), “In-Home Shoppers – An Overview”; Journal of Marketing, 40, 4 (October), 81-88.
Kustin, Richard A. and Robert A. Jones (1995), “Research note: a study of direct selling perceptions In Australia”, International Marketing Review, 12, 6, 60-67.
May, Eleanor G. (1979), “The Growth of Non-Store Retailing: Implications for Retailers, Manufacturers and Public Policy Makers”, New York: Institute of Retail Management, 6-18.
Mitchell, V-M and G. S. Prince (1993), “Retailing to Experienced and Inexperienced Consumers: A Perceived Risk Approach”, International Journal of Retail & Distribution Management, 21, 5, 10-21.
Peters, William H. and Neil M. Ford (1972), “A Profile of Urban In-home Shoppers: The Other Half”, Journal of Marketing, 36, 1 (January), 62-64.
Peterson, Robert A.; Gerald Albaum and Nancy M. Ridgway (1989), “Consumers Who Buy from Direct Sales Companies”, Journal of Retailing, 65, 2 (Summer), 273-286.
Peterson, Robert A. and Thomas R. Wotruba (1996), “What is Direct Selling? – Definition, Perspectives, and Research Agenda”, Journal of Personal Selling & Sales Management, 16, 4 (Fall), 1-16.
Reynolds, Kirsty E. & Sharon E. Beatty (1999), “A Relationship Customer Typology”, Journal of Retailing, 75, 4 (Winter), 509-523.
Sargeant, Adrian and P. Mswelli (1999), “Network Marketing In South Africa: An exploratory study of consumer perceptions”, Journal of International Consumer Marketing, 11, 3, 51-66. Sharma, Subhash; William O. Bearden and Jesse E. Teel (1983), “Differential Effects of
In-Home Shopping Methods”, Journal of Retailing, 59, 4 (Winter), 29-51.
Stanworth, John; Stewart Brodie; Thomas R. Wotruba and David Purdy (2004), “Outsourcing salesforces via self-employment: the case of Direct Selling in the UK”, Journal of Small Business and Enterprise Development, 11, 1, 50-59.
Taylor, Rex (1978), “Marilyn’s friends and Rita’s customers: A study of party-selling as play and as work”, Sociological Review, 26, 3 (August), 573-594.
Vander Nat, Peter J. and William W. Keep (2002), “Marketing fraud: An approach for differentiating multilevel marketing from pyramid schemes”, Journal of Public Policy & Marketing, 21, 1 (Spring), 139-151.
Van Raaij, W. Fred & Theo M. M. Verhallen (1994), “Domain-specific market segmentation”, European Journal of Marketing, 28, 10, 49-66.
World Federation of Direct Selling Associations (2004), “International Statistics 2004”, http://www.wfdsa.org/statistics.
Wotruba, Thomas R. (1990), “The Relationship of Job Image, Performance and Job Satisfaction to Inactivity-Proneness of Direct Salespeople”, Journal of the Academy of Marketing Science, 18, 2 (Spring), 113-121.
Wotruba, Thomas R. and Pradeep K. Tyagi (1991), “Met Expectations and Turnover In Direct Selling”, Journal of Marketing, 55, 3 (July), 24-35.
Wotruba, Thomas R. and Marie Pribova (1996), “Direct Selling in an emerging market economy: a comparison of Czech/Slovak and US market characteristics and buying experiences”. The International Review of Retail, Distribution and Consumer Research, 6, 4 (October), 415-435.
Wotruba, Thomas R.; Brodie, Stewart and Stanworth, John (2005), “Differences in Turnover Predictors between Multilevel and Single Level Direct Selling Organizations”. The International Review of Retail, Distribution and Consumer Research, 15, 1 (January), 91-110.