Photonics 2020, 7, 48; doi:10.3390/photonics7030048 www.mdpi.com/journal/photonics Article
Design of a Reconfigurable THz Filter Based on
Metamaterial Wire Resonators with
Applications on Sensor Devices
João Pedro Pavia 1,2,*, Nuno Souto 1,2 and Marco Alexandre Ribeiro 1,2
1 Department of Information Science and Technology, ISCTE—Instituto Universitário de Lisboa, Av. das Forças Armadas, 1649-026 Lisbon, Portugal; Nuno.Souto@iscte-iul.pt (N.S.);
Marco.Ribeiro@iscte-iul.pt (M.A.R.)
2 Radio Systems Group, Instituto de Telecomunicações, Av. Rovisco Pais, 1049-001 Lisbon, Portugal * Correspondence: Joao_Pedro_Pavia@iscte-iul.pt
Received: 31 May 2020; Accepted: 7 July 2020; Published: 10 July 2020
Abstract: A study on the design, simulation and characterization of a reconfigurable terahertz (THz)
filter, composed of two frequency-selective surfaces (FSSs) with applications on sensor devices in general and highly sensitive stress sensors, is presented in this paper. Using the developed theoretical model, we found out that by careful tuning the wire parameters, it is possible to control the filter sensitivity and also the energy transmission and reflection that passes through the structure. Numerical modelling of both the mechanical and electromagnetic components (using the elasticity equation and Maxwell’s equations, respectively) has been undertaken for two types of the device assemblies based on different thermoplastic polymers transparent to the THz radiation, namely: high-density polyethylene (HDPE)and polytetrafluoroethylene (PTFE), operating in a THz window from 395 to 455 GHz. The numerical results allowed us to characterize the relation between the reflectance/transmittance and the amount of force required to obtain a specific frequency shift along that window. It was found that the device assembled with HDPE presents a more linear response and it is able to pass from a full transparency to almost full opacity using only its linear operating zone. Due to its characteristics, this THz filter might be an interesting solution not only for THz sensors based on reconfigurable filters but also for optical modulators for the THz domain.
Keywords: filters; metamaterials; frequency-selective surfaces (FSSs); stress sensors; terahertz (THz)
1. Introduction
Terahertz (THz) is a rapidly emerging field in science with many potential applications but where there is an urgent need for new ways of producing sources, detectors and other devices such as filters, sensors and modulators. Artificial materials, such as metamaterials, play an important role in THz because they make it possible to design and manufacture very compact, sensitive and extremely selective structures surpassing the existing materials in nature [1,2]. Over the last few years, the scientific community has focused on several research areas, such as all-dielectric metamaterials, reconfigurable metamaterials, flexible metamaterials, metadevices, graphene metamaterials, tunable metamaterials and metasurfaces [1,3]. According to [2], for sensing applications, it is necessary that metamaterials are capable of fulfilling a set of requirements such as the ability to provide spoof surface plasmons with localized electric field enhancement and have high quality factor values (Q-factor), while preserving a high sensitivity, even when subjected to minor changes due to external factors. Some classes of metamaterials have gained a significant prominence for this type of applications, namely metasurfaces, absorbers, metallic mesh devices and
metamaterial-based thin films, due to their potentialities in terms of shape design, geometry, orientation, maximization of the excited electric/magnetic field, tuneability, sensitivity and also the possibility of being manufactured using lithography and nanoprinting technologies [1,3]. Successful applications have been reported in the literature with an emphasis on biosensing, microfluid devices, THz detectors and plasmonic toroidal metamodulators [2–5]. Architectonically speaking, most of these devices are based on split ring resonators (SRRs) and frequency-selective surfaces (FSSs), whose geometric and quality parameters can be adjusted to efficiently control resonant modes, quality factor, sensitivity, selectivity, responsivity and also to minimize losses. However, new trends in this field report a paradigm change in which the inclusion of nanomaterials in metamaterial sensors and the use of graphene plasmon and graphene metamaterial devices and topological insulators induced THz surface are expected in the near future [1].
THz filters are a key component in optimizing the performance of THz sensing devices, since they can eliminate undesirable background radiation and enhance the signal-to-noise ratio as well as spectral resolution in practical applications such as THz spectroscopy and imaging [6,7]. Several designs of broadband and narrowband THz bandpass filters based on metamaterials have been studied over the last decade [8–12]. Narrowband THz filters are especially important since they are the centerpiece of a wide range of ultrasensitive THz sensors due to their capability for selecting the radiation only in a narrow spectrum around a target frequency [10]. There is a wide range field where those sensors are essential, such as health, industry, science, telecommunications and security [6,7,10]. Several approaches related to the design of THz filters as well as to their tunability, have been reported since then. Some examples that stand out include the architectures based on photonic crystals, thin-film stacks, Bragg reflectors, FSSs, waveguides and resonant cavities [13–17]. The performance of most of these filters can be controlled following the same methodologies used in metamaterials, being also possible to control them mechanically (by adjusting the thickness or the distance of the components of the unit cells) or through the action of temperature as described in [6,15]. Metrics such as dynamic range, Q-factor, full width at average maximum (FWHM), dephasing time of the induced spectral line shapes (
t
d ), figure of merit (FoM
) and insertion loss (IL) arewidely used to evaluate THz filters [5,6,13,14,17].
The utilization of THz technologies for stress sensing applications is very recent, but some approaches have already been reported in the literature [18–21]. The sensors of those systems must be accessible, light and discrete, so as not to impose cost and weight on the structure as well as not to interfere with the structural resistance [19]. Most of these requirements can be easily accomplished through the use of FSSs in the design of micro-electro-mechanical system (MEMS) sensors, since they can offer higher sensitivity and resolution and also possess a greater potential to deliver the strong enhancement and localization of fields, being especially suitable for the development of wireless strain sensors that can operate in the microwave and terahertz ranges [18,21]. The development of THz stress sensors based on metal mesh filters and FSSs is described in [21]. The resonances of this type of sensor are obtained thanks to the periodicity of the unit cells in the direction of propagation and, according to the authors, can be used in several applications, including structural health monitoring (SHM). Their integration into the structures allow us to detect cracks and other kinds of damage, since, in this type of critical situation, it is known that the reflectance/transmittance values of the sensors decrease abruptly.
This paper aims to present a detailed study about the characterization, design and simulation of a reconfigurable THz filter with high sensitivity and selectivity for sensor devices such as stress sensors. Our filter has a simpler design when compared to the approaches referred above, since it is composed by only two FSSs based on metamaterial wire resonators. Despite being a novel approach, the proposed device can provide a higher dynamic range, an enhanced frequency selectivity and requires less force to cause a frequency shift. The remainder of the paper is organized as follows: Section 2 describes the filter theory and respective design. The mechanical model and respective simulation method is introduced in Section 3, while Section 4 presents the numerical results obtained from the electromagnetic and mechanical point of view. Finally, the conclusions are outlined in Section 5.
2. Filter Theory and Design Decisions
In this section, the required tools are introduced in order to design a highly selective structure (HSS) that is the centerpiece of the sensor. This HSS works as a reconfigurable selective THz window in which only radiation of certain desired frequencies is allowed to pass. In literature, as described in [21], this kind of behavior is obtained using a technique related to the periodicity of the unit cells of the structure in the direction of propagation. Here, a much simpler approach, where the resonances are obtained from the propagation in a THz HSS composed by two arrays of gold wires, is used. The goal is therefore to study the interaction between the waves and the wires to be able to understand the principle of operation of the HSS. More specifically we intend to devise a method to optimize the relation between the radius of the wires and the distance between wires and adjust the sensitivity and selectivity of the device. Moreover, for simplicity, we shall assume that the structure is composed by two arrays of wires because using a single array would not be sufficient to achieve the desired degree of selectivity. Based on the variation of the distance between wires and the mechanical stress experienced by the structure, it will be possible to predict how the transmittance is decreasing to the operating frequency, since, when the transmittance is very low when compared to the initial one, it is known that the structure has a problem.
2.1. Working Principle
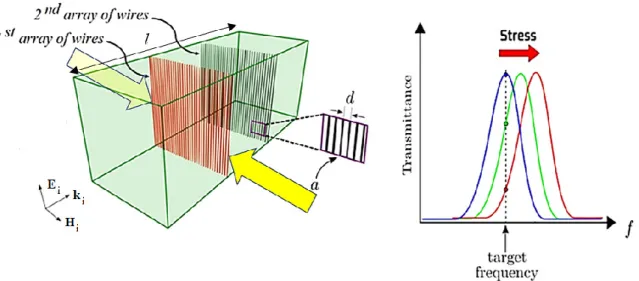
In this paper, we propose a new design for a reconfigurable THz filter that can be used to implement an electro-mechanical sensor. As can be seen in Figure 1, the device is composed of two FSSs (arrays of wires) within a dielectric host material. Note that the selective character of the wire arrays gives rise to a bell-shaped frequency response. The working principle is presented in Figure 1, in which it can be seen that by applying compression along the x axis, the distance between wires
d
will decrease and, therefore, the frequency response of the sensor will change, as does its transmittance. The sensor is settled to operate at the target frequency and, as it experiences compression, it becomes possible to adjust the sensor response from full transparency to complete opacity, including all degrees of transparency in between. The red curve corresponds to maximum compression and the green curve to half compression.Figure 1. Overview of the working principle of the proposed reconfigurable filter.
By allowing a lateral compression instead of a uniaxial compression, the device becomes more functional and easier to implement. It is also more selective since its working principle is based on the resonance of two arrays in the propagation directions. This selectivity can be accomplished through the careful design of the
d
/
a
ratio of the wire arrays (a is the radius of the wires), whichThis double grid structure can be represented by a simplified two-port network model, as can be seen Figure 2 [22]. The arrays of wires are described as admittances
Y
in the equivalent circuit and the dielectric slab is represented by three sections of transmission line with equal lengthl
/ 3
(note that the total length of the structure is
l
).Figure 2. Equivalent microwave network circuit of the terahertz (THz) filter.
In this model,
Z
p is the impedance of the port,Z
is the characteristic impedance of thedielectric slab material and β is the propagation constant. In the next section, we will show how to determine the expression for admittance
Y
.2.2. Circuit Theory
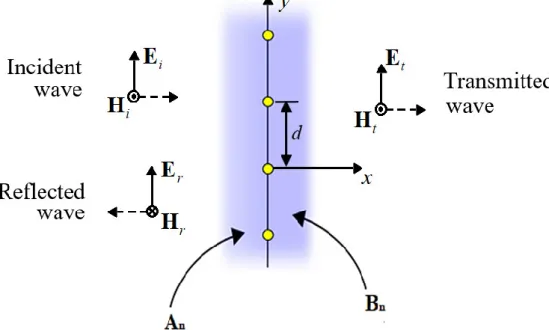
In all wave propagation problems, where there are transitions between media, we can always identify incident waves at the interface, which give rise to reflected and transmitted waves. As it is well known from electromagnetic theory, the reflectance and transmittance of a dielectric slab have a comb like frequency response [22]. However, in this situation, the arrays of wires will introduce a filter-like response in the frequency domain. We must study this problem in order to understand the interactions between electromagnetic waves and the array of wires, as can be seen in Figure 3. By studying the problem, we will be able to find out what will be the structure’s response in the frequency domain and how can we tune the filter.
2.2.1. Equivalent Circuit Admittance for the Wire Arrays
For propagation in the z direction and for time harmonic fields of the form
e
j t , theHelmholtz equation is:
2 2 2 2 2
0
z z zE
E
k E
x
y
, (1)where
k
c
is the magnitude of the wave vector andE
z is the z component of the electricfield, parallel to the wires. Solutions of (1) can be written in the form
E x y
z( , )
X x Y y
( ) ( )
,
where
1cos
y
2sin
y
Y y
c
k y
c
k y
. (2)The second term on the right-hand side vanishes because
Y y
( )
Y
y
. This condition results from the symmetry along the y axis. Moreover, since the structure is periodic in they
direction with lattice constantd
, the possible solutions fork
y, in the Fourier plane are restricted to2
yk
n d
, where n is the number of the propagation mode. The condition in this case is
(
)
Y y d
Y y
. Thus, we can write:1
2
( )
cos
n y
Y y
c
d
. (3)For the x component of the wavevector, we have
k
x
j
x, where2 2 2 2
4
2
xn
n
k
d
d
. (4)This follows from
k
2
k
x2
k
y2 if we take into account thatd
/ 2
, which corresponds to the case where it is not possible to resolve details in the structure according to Abbe limit. The solutions forX x
( )
are of the forme
xx ande
xx, which describe evanescent waves that onlyexist in the vicinity of the wires. The electric field for
x
0
is then given by:0 0 1
2
cos
xx jkx jkx j t z i r n nn y
E
E e
E e
A e
e
d
, (5)where
E
0i andE
0r are the complex amplitudes of the incident and reflected waves, respectively, and the coefficientsA
n account for the evanescent fields. Forx
0
the electric field is obtained bycombining the transmitted wave with the evanescent field:
0 1
2
cos
xx jkx j t z t n nn y
E
E e
B e
e
d
. (6)Close to the wires we have
x
, where
2 0 0 12
0
(1
)
(1
)
cos
n x j t d z i r n nn y
E x
e
E
jkx
E
jkx
A e
d
, (7) and
2 0 12
0
(1
)
cos
n x j t d z t n nn y
E x
e
E
jkx
B e
d
. (8)At the wires (
x
0
), the tangential component of the electric field must be continuous. We have: 0 0 1 12
2
cos
cos
oi r n t n n nn y
n y
E
E
A
E
B
d
d
, (9)Which, according to Fourier’s theory implies that:
0t 0i 0r
E
E
E
,B
n
A
n. (10)For cylindrical wires, it is convenient to introduce the following function:
1
2
2
( , )
ln 2 cosh
cos
2
x
y
u x y
d
d
, (11)which has the geometric property of being approximately constant on the surface of the thin wires. By Taylor expansion we find:
2 1
2
cos
n x d nx
e
n y
u
d
n
d
, (12)where the
sign holds forx
0
and the
sign forx
0
. Based on this expansion, we can assumeA
n
B
n
A n
1 and write the electric fieldE
z in terms ofu
as
0 0 1 0 1,
(1
)
(1
)
,
,
0
(1
)
,
.
0
j t z i r tE
x y e
x
E
jkx
E
jkx
A u x y
x
d
x
E
jkx
A u x y
x
d
. (13)To determine
A
1 in terms ofE
0t , we impose the continuity of zE
x
atx
0
. With the aidof the Equations (10) and (13), we find:
1 0 r
jkd
A
E
. (14)Up to this point, we have neglected the boundary conditions on the surface of the wires, where the tangential component of the electric field
E
z must vanish. Considering wires with radiusa
, itresults from (14) and using (13) with
x
0
andy a
that:0 11 0
1
2
1
ln 2 1 cos
2
r iE
S
E
jkd
a
d
, (15)where we have also used (11) to determine
u
0,
a
. From network theory [22], we known that theABCD
parameters of a two port circuit consisting of an admittanceY
G
jB
areA D
1
,0
0 0 11 0 0 0
1
2
1
B
A
CZ
D
Z
S
B
A
CZ
D
Z
YZ
. (16)Here,
Z
0 is the characteristic impedance of the dielectric slab material. Hence, (16) iscompatible with (15) and we can easily determine the admittance.
1 0
2
2
ln 2 1 cos
Z
Y
j
d
a
d
. (17)2.2.2. Transmission Matrix of the Filter
Let
T
1 andT
2 be the transmission matrices of a section of the slab of sizel
/ 3
and of atwo-port network consisting of an admittance
Y
, respectively. Then, theABCD
parameters for the equivalent circuit in Figure 2 can be written in the form:1 1 2 1 2 3 3 1 2 1 2 1 2 3 3
1
1
1
z
z z
z
z
Z
A
B
z
z
T T T T T
C
D
z
Zz
z
, (18)where
z
1,z
2 andz
3 are the following normalized impedances:1
1 2
z
z
EF
,z
3
F
1 (19)with coefficients
E
andF
defined as:
2 2
3
2 2
3
3
4
cos
3
cos
3
sin
4
sin
1,
E
Z Y
l
Z Y
l
j ZY
l
j ZY
l
(20) and
3 2 2 2 2 3
4
cos
2
cos
3
sin
4
sin
F
ZY
l
ZY
l
j
Z Y
l
j
Z Y
l
. (21) Knowing theABCD
parameters of the network, one can determine the scattering matrix using the formulas for the conversion between two-port network parameters [22]:2 1 1 3 1 11 2 1 1 3 1 3 1
2
2(
) 2
z z z
z z
z
S
z
z
z z z
z z
z
(22) and 3 12 2 1 1 3 1 3 12
2(
) 2
z
S
z
z
z z z z z z
. (23)where
z Z Z
/
0 is the normalized impedance of the slab with respect to free-space. By symmetry2.3. Parameters’ Choice
The theory described above was used to determine a starting point for the device parameters assuming a frequency window in the THz range between 395 and 455 GHz. From the theoretical model, it is possible to verify that the bandwidth decreases as
Y
increases. Moreover, as we approach the limita d
/
1 / 6
, theY
will grows to . However, this value cannot be reached due to theresistance of the wires and because in that limit the formula is only an approximation (formula is only valid for
d
anda
d
). After performing several electromagnetic simulations to fit tune the initials parameters, a set that fulfill our requirements was found: Length (
l
) = 1.42 mm; Radius of the wires (a) = 0.2 μm;
Distance between wires (
d
) ∈ [15; 20] μm.The distance between wires is expressed as a range, since the previous study proved that it is possible to control the behavior of the filter in the desired frequency range by varying this parameter and to compress the device without deforming or cracking the structure [21]. As mentioned above, the device must have some robustness and a good degree of sensitivity, which means that one should consider materials that will be relatively easy to compress and transparent to THz radiation. According to [18], silicon and plastics such as high-density polyethylene (HDPE) and polytetrafluoroethylene (PTFE) are key terahertz materials since they fulfil the requirements mentioned above for the frequency band over 0.1 to 5 THz [23]. Naturally, the plastic materials will be a more suitable solution since silicon requires a substantially higher rate of compression. However, it is also important to consider some specific characteristics from the materials, taking into account the working principle, the design and the assembly of the filter.
HDPE possesses a linear structure with few branches lending to its optimal strength/density ratio. This thermoplastic presents some interesting features, such as: the sensitivity to stress cracking and the possibility to customize their physical properties through the molding process that is used in its manufacturing [24,25]. On the other hand, PTFE, which is a material widely used in industrial applications, also presents some interesting features, such as: weatherability and the capability of maintaining high strength, toughness and self-lubrication at low temperatures down to 5 K, as well as good flexibility at temperatures above 194 K [26].
Considering their properties and the fact that both have low losses and low dispersion in the frequency region of the THz, as mentioned above, these materials in fact constitute good candidates to be used in the assembly of the proposed device.
3. Mechanical Simulations
In this section, the main purpose is to understand how to mechanically model the filter in order to find out how much force and current it will take to make the device compress up to 25% according to the materials used for its assembling, since beyond that ratio the device presents saturation in the frequency response. The finite element method was used for the simulation of the filter according to the geometry that was presented previously. This solving technique is an efficient method that can provide approximated solutions to partial differential equations and it is widely used to solve problems in several areas, such as: electromagnetics, structural analysis, among others [27].
3.1. Device’s Modelling
Since the device response analysis lies on two components, namely electromagnetic and mechanic, it will be necessary to model the filter from both perspectives. The first one can be easily simulated based on the circuit theory presented in the previous section. However, the latter requires a realistic model according to the geometry specifications considered in the device design. To satisfy this requirement, the Gmsh and Elmer software were used to model the filter [28,29]. Through the Gmsh, it was possible to design the filter and generate its corresponding mesh. After importing the filter’s mesh into the Elmer solver, materials and boundary conditions associated with the elasticity
equation must be defined. Knowing the range to be tested for the wire spacing and the lateral section area of the device, it is possible to determine the level of compression needed to obtain the required wire spacing. This is possible to achieve, knowing that the materials have certain physical properties, some of which are especially important for calculating the displacement derived from the compression applied to the device, among them: density, Young’s modulus and Poisson’s ratio [30]. The relation between the displacement and the force applied to an elastic material is characterized by the well-known equation:
F
l
E
A
l
, (24)where
F A
/
is the force applied per unit area (stress),E
is the Young’s modulus and
l l
/
is the extension per unit length (strain). The stress is expressed in Newtons per square meter (Nm-2) or in Pascals (Pa) and the Young’s modulus is usually expressed in GPa. Last but not least, the strain has no units, because it is just a ratio between the extension and the original length of the object. In Table 1, the values of the properties that mechanically characterize each material that comprise the device are presented [31].Table 1. Simulation parameters of the materials of the proposed filter.
Material Density (Kg/m3) Young’s Modulus (GPa) Poisson’s Ratio
Gold 19300 78 0.44
HDPE 641 0.8 0.46
PTFE 2100 0.3 0.46
3.2. Generation of the Required Force to Compress the Device
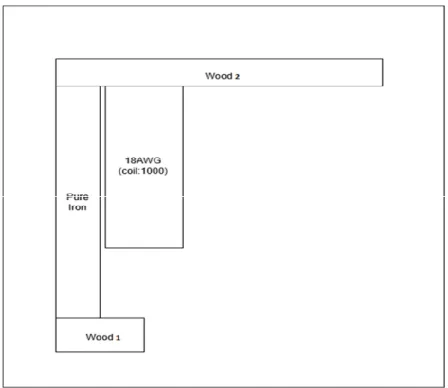
Mechanical stress can be monitored based on the variation of the distance between the wires caused by the impact of external factors on the structure. The required force to compress the device can be generated by passing an electric current through a coil placed on a plunger, as can be seen in Figure 4.
Figure 4. Scheme of the magnetic circuit to be modeled on a finite element method magnetics (FEMM) solver.
The amount of electric current to generate such force can be obtained from numerical simulations, because iron is a ferromagnetic material and, therefore, the relation between magnetic induction B and the magnetic field H is not linear. Since the FEMM solver is based on the principle of symmetry, we only draw part of the device (as shown in the Figure 4) [32]. The core of the plunger is made of iron and it is surrounded by a coil (1000 turns of copper wire), which will induce the movement of the core. The base (wood 1) and the surface (wood 2) that contacts with the device would ideally consist of wood, which in turn has air-like magnetic properties.
This circuit was simulated, according to the dimensions of the lateral section of the device and considering the data in Table 2.
Table 2. Simulation parameters of the magnetic circuit in FEMM.
Lc Wc Lp Wp σ g Nturns Lwood 1 Wwood 1 Lwood 2 Wwood 2
0.27 mm 0.1 mm 0.05 mm 0.37 mm 10.44 MS/m 0.005 mm 1000 0.03 mm 0.079 mm 0.03 mm 0.71 mm In this table, Lc is the coil length, Wc is the coil width, Lp is the plunger length, Wp is the plunger
width, σ is the electrical conductivity of the iron, g is the length of the gap between the coil and the plunger, Nturns is the number of turns of the coil, Lwood1 is the length of the base of the plunger, Wwood1
is the width of the base of the plunger, Lwood2 is the length of the surface of the plunger and Wwood2 is
the width of the surface of the plunger, respectively.
4. Results
In this section, the results from the simulations based on the design of the filter for each assembling hypothesis will be presented. Two analyses of the behavior from the electromagnetic and mechanical point of view will be carried out. By analyzing the data, we will also discuss how it will be possible to apply the desired compression level to the devices and thus control the distance between wires.
4.1. Return Loss and Insertion Loss in the Frequency Domain as a Function of Distance between Wires
After the conception and presentation of the theoretical study of the working principle of the filter, it is necessary to corroborate the accuracy of the conceived theoretical model through simulations, as well as to analyse some relevant issues such as: the dynamic range, the periodicity of the shifts of resonance frequency and the evolution of the bandwidth of the device under compression.
Knowing that HDPE and PTFE have different relative permittivity constants, it will be necessary to analyse the filter for both assembling cases. Note that HDPE has a relative dielectric constant εr =
2.4 and PTFE posseses εr = 2.1 [26]. The losses were not considered due to the characteristics of these
materials, as highlighted in Section 2.
The resonance frequency (
f
t) will be shifted to higher frequencies as the filter is compressed.The reduction in the distance between wires occurs with a step size of 0.5 μm. 4.1.1. HDPE
Figures 5 and 6 shows return losses (RL) and insertion losses (IL) in the frequency domain as a function of applied compression for the HDPE host medium. These quantities were calculated based on the results obtained for the scattering parameters from the simulations. Since the structure is invariant to port swapping in the propagation direction, we might consider the following formulas
10 11
20 log
RL
S
andIL
20 log
10
S
12
, respectively [22]. The device resonance, without compression, is at 408 GHz, but, when we imposed a full compression (25%), the resonance changes to 411 GHz. In every curve, each reduction of 0.5 μm in the distance between wires causes an increase of 278 MHz in the resonance frequency, which is followed by an average bandwidth reduction at 3dB of 111 MHz. Considering this data, it is possible to state that, between these two extreme cases, there was a shift of 3 GHz in resonant frequency and a reduction in the bandwidth at 3 dB of 1.1 GHz (a decrease of more than 50% when compared with the initial value without compression). Some saturation and distortion in the filter response are expected for this reason.
Figure 5. Return loss in the frequency domain as a function of applied compression for high-density polyethylene (HDPE) host medium.
In Figures 5 and 6, there is a vertical line identifying the target frequency (408 GHz) and, by analyzing both of them, it can be seen that the device presents an excellent dynamic range along this curve. This means that, as compression is applied to the device, it will go from full transparency (
11
S
=0) to full opacity(S
11 =1). Therefore, it is possible to conclude that the bandwidth decreasesand the selectivity increases as the compression is applied to the filter.
Figure 6. Insertion loss in the frequency domain as a function of applied compression for HDPE host medium.
The FWHM decreases from 1.2 GHz (without compression) to 0.55 GHz (maximum compression) [5]. The quality factor can be calculated as the ratio between the resonance frequency and the FWHM. We found that the Q factor ranges between
Q
340
for the case without compression andQ
747
when maximum compression is applied. Considering the same criteria that was used to analyze the previous metrics, we found that the dephasing time( )
t
d of inducedline shapes decreases from 1.5797 to 0.724 μs [5]. Moreover, the figure of merit can be defined as the number of passbands inside the range of tuning, which can be computed as:
0 0 up low up low f f
FoM
, (25) where 02.5824 10
12 up
is the uppermost resonant frequency, 02.5635 10
12low
is the lowermost resonant frequency,
fup
3.4558 10
9 is the uppermost passband width and9
7.5398 10
low f
is the lowermost passband width, respectively [6]. We estimated a3.6927
FoM
. The insertion losses (IL) are practically zero as the resonance frequency is shifted by the compression on the device. The high value of the return losses (RL) means that the reflected energy is very small when compared to the incident wave energy. These results show that the higher the compression level applied, the greater the selectivity of the device.4.1.2. PTFE
The results from the electromagnetic simulations for the filter assembled with PTFE are shown in Figures 7 and 8. By observing both figures, it is possible to conclude that the behavior is slightly the same when compared to the case of HDPE. However, the resonances now occur at higher frequencies, since the parameters that characterize the material are different. Note that, without compression, the device presents a resonance at 437.5 GHz, which will change to 440.7 GHz when full compression is applied. In every curve, each reduction of 0.5 μm in the distance between wires causes an increase of 320 MHz in the resonance frequency, which is followed by an average bandwidth reduction at 3 dB of 122 MHz.
Figure 7. Return loss in the frequency domain as a function of applied compression for polytetrafluoroethylene(PTFE) host medium.
Considering these data, it is possible to state that the application of maximum compression caused a total shift of 3.2 GHz in the resonance frequency and a reduction in the bandwidth at 3 dB of 1.1 GHz (a decrease of 50% when compared with the initial value without compression). In Figures 7 and 8, there is a vertical line identifying the target frequency (437.5 GHz) and, by analyzing both of them, it can be seen that the filter presents a slightly better dynamic range when compared to the case of the device assembled with HDPE. The FWHM decreased from 1.3 GHz (absence of compression) to 0.65 GHz (maximum compression), and, similar to what was observed previously, the progression of the resonance frequency as the filter is compressed is also approximately linear. The quality factor increased from
Q
337
(absence of compression) toQ
678
(maximum compression) as the distance between wires is reduced. Considering the same criteria that was used to analyze the previous metrics, we found that the dephasing time decreases fromt
d =1.7114 μs tot
d = 0.8557 μs.Moreover, this filter presents an
FoM
3.4811
, which was calculated by using Equation (25) and considering that 02.76
90
10
12 up
, 02.7489 10
12 low
,
upf
4.0 4
8
1
1
0
9 and 98. 6
1 81
10
low f
, respectively. Globally, these results are similar to what was obtained for the HDPE.Figure 8. Insertion loss in the frequency domain as a function of applied compression for PTFE host medium.
4.2. Reduction in the Distance between Wires as a Function of Required Current
After performing the analysis of the electromagnetic component, we will focus on the analysis of the mechanical component. In the following subsections, we intend to understand how much force it will take to make the device compress up to 25% according to the materials used for its assembly and, knowing that there is a possibility of controlling the compression magnetically, what will be the current required to reach each level of compression. Through preliminary mechanical simulations, we found out that 70 wires per array are sufficient to obtain the desired behavior of the device. We also decided to study how the number of wires influences its response.
4.2.1. HDPE
Considering the theory associated with mechanical simulations, it is possible to predict the amount of force required to cause the desired distance between wires to be reduced in each case. By combining the theory used in the Elmer solver with the theory of magnetic circuits based on which the FEMM software solves the problems, we are able to discover the current required to cause the compression that allows the distance between wires to decrease.
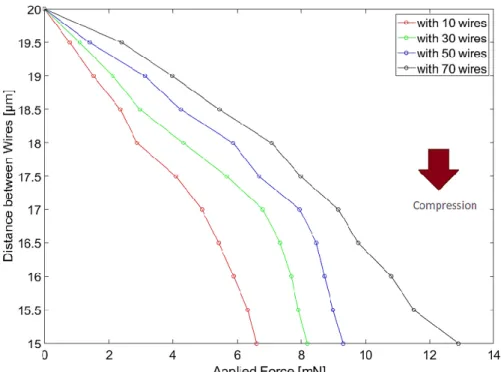
By analysing Figures 9 and 10, it is observed that, as expected, the higher the force to be applied to the device, the higher the current to be supplied to the magnetic circuit. To fully compress the device with 70 wires, we should supply 0.56 A to the magnetic circuit.
Figure 9. Reduction in the distance between wires as a function of applied force and current for 10, 30, 50 and 70 wires and a filter assembled with HDPE.
Figure 10. Reduction in the distance between wires as a function of applied current for 10, 30, 50 and 70 wires and a device assembled with HDPE.
4.2.2. PTFE
Similar to the previous case, we obtained from the Elmer solver the range of forces to be applied to the filter in order to achieve each compression state. The results are presented in Figure 11. After that, we obtained from the FEMM solver the range of currents to be supplied to the magnetic circuit in order to compress the device according to the previous data, as can be seen in Figure 12.
Figure 11. Reduction in the distance between wires as a function of applied force and current for 10, 30, 50 and 70 wires and a filter assembled with PTFE.
Figure 12. Reduction in the distance between wires as a function of applied current for 10, 30, 50 and 70 wires and a device assembled with PTFE.
The curves for the applied force and the required current have the same slope for each scenario, in which the number of wires is increased. However, in this case of PTFE, both the force and the current values are much lower. We should note that, as the range of forces to be applied for each typology is different, the range of currents to be supplied will also be different. In order to achieve a full compression of the device with 70 wires, we should supply the magnetic circuit with 0.125 A, which is substantially lower than the one required for HDPE.
4.3. Reflectance and Transmittance as a Function of Applied Force
Finally, after performing electromagnetic and mechanical simulations, we can now use the information we obtained from both components to illustrate the reflectance/trasmittance as a function of the force applied to the filter for each host material that can be used to build the device. The following graphs show us the relationship between these quantities. It should be noted that the resonance frequency was fixed taking into account the case without compression (
f
tHDPE = 408 GHz andPTFE
t
f
= 437.5 GHZ, respectively).4.3.1. HDPE
Through a careful analysis of Figures 13 and 14, we observe that, by increasing the number of wires per array, the more linear the response of the filter will be. Independently of the curve under analysis, the device response presents some saturation for high values of applied force. If we focus on the designs with 50 or more wires, we observe saturation for values greater than 8 mN. In spite of this fact, the device can reflect almost all of the incident wave (more than 90%) and, therefore, we can assume that the device presents an approximately linear response in the dynamic range under study.
Figure 13. Reflectance as a function of applied force for 10, 30, 50 and 70 wires and a filter assembled with HDPE.
Figure 14. Transmittance as a function of applied force for 10, 30, 50 and 70 wires and a filter assembled with HDPE.
Let us consider the case, in which we have a filter with 70 wires per array and an applied force of around 8 mN (beyond this value we enter in a saturation zone). Through Figure 9, we can see that the distance between wires for 8 mN of applied force is d = 17.5 μm. In turn, by analyzing Figures 5 and 6, we observe that the resonance frequency of the filter is around 409.4 GHz. Table 3 shows the filter quality and performance parameters for the scenario under study:
Table 3. Filter quality and performance parameters considering a distance between wires d = 17.5 μm. FWHM (GHz) Q td (µs)
0.9 455 1.1848
Although these metrics do not change with the increase in the number of wires, it will be important to quantify the sensitivity of the filter (
s
1 S
11F
), as we vary this parameter [21]. Table4 illustrates the sensitivity variation, considering a distance between wires d = 17.5 μm and a reflectance
S
11 = 0.8901, as the number of wires per array increases:Table 4. Calculation of the sensitivity of the filter considering a distance between wires d = 17.5 μm. Number of Wires ∆ (mN) Sensitivity (N)
10 4.09 26.87 30 5.68 19.35 50 6.68 16.45 70 8 13.74
The data from Table 4 shows that the sensitivity and linearity of the response of the device vary in opposite ways. Therefore, to have a sensitive device with an approximately linear response, it is necessary to establish a trade-off between these requirements.
4.3.2. PTFE
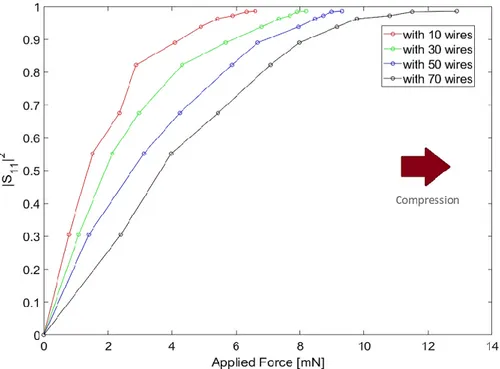
The results for the PTFE host are shown in Figures 15 and 16. As can be seen, the curves obtained for this device model are not as linear as we observed in the previous case. When compared to the device built with HDPE, this filter is more sensitive, since it can cover the entire dynamic range with much less applied force (only 21.4% of the required force to fully compress the device built with HDPE). In spite of the linearity issues, we have a linear operating region that allows us to work with reflectances between 0.25 and 0.85, depending on the requirements of the application. For values of applied force greater than 1.20 mN, some saturation of the device response (independently of the curve under analysis) is observed.
Figure 15. Reflectance as a function of applied force for 10, 30, 50 and 70 wires and a filter assembled with PTFE.
Figure 16. Transmittance as a function of applied force for 10, 30, 50 and 70 wires and a filter assembled with PTFE.
Focusing on the scenario, in which we have a filter containing 70 wires per array and a limitation of the applied force of about 1.2 mN, we can see from Figure 11 that the distance between wires for 1.2 mN of applied force is d = 18.5 μm. In turn, by analyzing Figures 7 and 8, we observe that the resonance frequency of the filter is around 438.4 GHz. Table 5 shows the filter quality and performance parameters for the scenario under study:
Table 5. Filter quality and performance parameters considering a distance between wires d = 18.5 μm. FWHM (GHz) Q td (µs)
1.1 399 1.4481
In Table 6, the relationship between filter sensitivity and the increase in the number of wires is shown, considering the approach used in the previous case:
Table 6. Calculation of the sensitivity of the filter considering a distance between wires d = 18.5 μm a reflectance
S
11 = 0.6553.Number of Wires ∆ (mN) Sensitivity (N)
10 0.657 524.66 30 0.821 419.85 50 0.965 357.2 70 1.2 287.25
The filter assembled with PTFE requires less force to be compressed and is very sensitive. However, the data from Table 6 suggest that the relationship between sensitivity and linearity of the response of the device is the same as was observed for the case where the filter was assembled with HDPE. Given the trade-off between these requirements, we should consider the filter assembled with HDPE, since it has the same good dynamics as the filter assembled with PTFE but has a much more linear response than the latter.
5. Conclusions
This work aimed to study a reconfigurable THz filter design, using frequency selective structures based on metamaterial resonators, so that it can be used in the development of sensor devices. The proposed filter is composed by two arrays of wires to provide greater cancellation of harmonics, higher dynamic range and enhanced frequency selectivity. The resonant effects result from carefully tuning the wire radius and the distance between wires, which can be altered so that only evanescent modes exist in the vicinity of the structure, allowing us to control the energy transmission and reflection. Due to its simplicity, this filter design is especially suited for the implementation of reconfigurable THz filters and optical modulators, since it transits from situations in which it presents a full transparency (
S
11 = 0) for a full opacity (S
11 = 1).Two assembling hypotheses with different thermoplastic polymers materials were analyzed. The choice of these materials was essentially due to the fact that they are relatively easy to compress and exhibit low losses and low dispersion for the frequency band over 0.1 to 5 THz. Numerical simulation using the finite element method allowed us to study the variation of the electromagnetic and mechanical response of the device as compression was applied.
Our results corroborated our theoretical model by proving that it is possible to design a filter with a very good dynamic range and a high sensitivity by following the proposed methodology. The model designed with HDPE presented a quite linear response when compared to the one designed with PTFE, which is more sensitive. This might be explained by the different electromagnetic and mechanical properties of these materials.
For the model composed by HDPE, the required force to be applied to cause a reduction in the distance between wires is four times greater, when compared to the one that is required by the model
with PTFE. By analyzing the data from the simulations, it was also determined that the relation between wire spacing and the required current to compress the device is the same, when compared to the amount of force that should be applied to verify a shift on the resonance frequency.
Author Contributions: Conceptualization, J.P.P, N.S. and M.A. R.; Data curation, J.P.P; Formal analysis, J.P.P, N.S. and M.A. R.; Funding acquisition, N.S. and M.A.R.; Investigation, J.P.P, N.S. and M.A. R.; Methodology J.P.P, N.S. and M.A. R.; Project administration, N.S. and M.A.R.; Resources, N.S. and M.A.R; Software, J.P.P.; Supervision, N.S. and M.A.R; Validation, J.P.P, N.S. and M.A. R.; Visualization, J.P.P.; Writing – original draft, J.P.P.; Writing – review & editing, J.P.P, N.S. and M.A. R. All authors contributed equally to the article. All authors have read and agreed to the published version of the manuscript.
Funding: This research was partially funded by the FCT—Fundação para a Ciência e Tecnologia and Instituto de Telecomunicações (IT) under projects TUBITAK/0002/2014 and UIDB/EEA/50008/2020. Moreover, João Pedro Pavia had a funding provided by ISCTE-University Institute of Lisbon under the grant ISTA-BM-PDCTI-2019. Acknowlegements: The authors acknowledge the support of FCT, IT and ISCTE—University Institute of Lisbon, as described above in funding.
Conflicts of Interest: The funders had no role in the design of the study; in the collection, analyses, or interpretation of data; in the writing of the manuscript, or in the decision to publish the results.
References
1. Xu, W.; Xie, L.; Ying, Y. Mechanisms and applications of terahertz metamaterial sensing: A review.
Nanoscale 2017, 9, 13864–13878.
2. Salim, A.; Lim, S. Review of Recent Metamaterial Microfluidic Sensors. Sensors 2018, 18, 232.
3. Gerislioglu, B.; Ahmadivand, A.; Pala, N. Tunable plasmonic toroidal terahertz metamodulator. Physical
Review B 2018, 97, 161405.
4. Ahmadivand, A.; Gerislioglu, B.; Ahuja, R.; Kumar Mishra, Y. Terahertz plasmonics: The rise of toroidal metadevices towards immunobiosensings. Mater. Today 2020, 32, 108–130.
5. Ahmadivand, A.; Gerislioglu, B.; Ramezani, Z. Gated graphene island-enabled tunable charge transfer plasmon terahertz metamodulator. Nanoscale 2019, 11, 8091–8095.
6. Ferraro, A.; Zografopoulos, D.; Caputo, R.; Beccherelli, R. Periodical Elements as Low-Cost Building Blocks for Tunable Terahertz Filters. IEEE Photonics Technol. Lett. 2016, 28, 2459–2462.
7. Ferraro, A.; Tanga, A.; Zografopoulos, D.; Messina, G.; Ortolani, M.; Beccherelli, R. Guided mode resonance flat-top bandpass filter for terahertz telecom applications. Optics Lett. 2019, 44, 4239.
8. Sun, D.; Qi, L.; Liu, Z. Terahertz broadband filter and electromagnetically induced transparency structure with complementary metasurface. Results Phys. 2020, 16, 102887.
9. Sanphuang, V.; Ghalichechian, N.; Nahar, N.; Volakis, J. Reconfigurable THz Filters Using Phase-Change Material and Integrated Heater. IEEE Trans. Terahertz Sci. Technol. 2016, 6, 583–591.
10. Chang, C.; Huang, L.; Nogan, J.; Chen, H. Invited Article: Narrowband terahertz bandpass filters employing stacked bilayer metasurface antireflection structures. APL Photonics 2018, 3, 051602.
11. Zaitsev, A.; Grebenchukov, A.; Khodzitsky, M. Tunable THz Graphene Filter Based on Cross-In-Square-Shaped Resonators Metasurface. Photonics 2019, 6, 119.
12. Ferraro, A.; Zografopoulos, D.; Caputo, R.; Beccherelli, R. Guided-mode resonant narrowband terahertz filtering by periodic metallic stripe and patch arrays on cyclo-olefin substrates. Sci. Rep. 2018, 8, 1–8. 13. Cong, L.; Tan, S.; Yahiaoui, R.; Yan, F.; Zhang, W.; Singh, R. Experimental demonstration of ultrasensitive
sensing with terahertz metamaterial absorbers: A comparison with the metasurfaces. Appl. Phys. Lett. 2015,
106, 031107.
14. Zhang, N.; Song, R.; Hu, M.; Shan, G.; Wang, C.; Yang, J. A Low-Loss Design of Bandpass Filter at the Terahertz Band. IEEE Microw. Wirel. Compon. Lett. 2018, 28, 573–575.
15. Němec, H.; Duvillaret, L.; Garet, F.; Kužel, P.; Xavier, P.; Richard, J.; Rauly, D. Thermally tunable filter for terahertz range based on a one-dimensional photonic crystal with a defect. J. Appl. Phys. 2004, 96, 4072– 4075.
16. Ko, Y.; Magnusson, R. Flat-top bandpass filters enabled by cascaded resonant gratings. Opt. Lett. 2016, 41, 4704.
17. Yamada, K.; Lee, K.; Ko, Y.; Inoue, J.; Kintaka, K.; Ura, S.; Magnusson, R. Flat-top narrowband filters enabled by guided-mode resonance in two-level waveguides. Opt. Lett. 2017, 42, 4127.
18. Melo, A.; Gobbi, A.; Piazzetta, M.; da Silva, A. Cross-Shaped Terahertz Metal Mesh Filters: Historical Review and Results. Adv. Opt. Technol. 2012, 2012, 1–12.
19. Ozbey, B.; Unal, E.; Ertugrul, H.; Kurc, O.; Puttlitz, C.; Erturk, V.; Altintas, A.; Demir, H. Wireless Displacement Sensing Enabled by Metamaterial Probes for Remote Structural Health Monitoring. Sensors 2014, 14, 1691–1704.
20. Chen, J.; Kaushik, S. Terahertz Interferometer That Senses Vibrations Behind Barriers. IEEE Photonics
Technol. Lett. 2007, 19, 486–488.
21. Pavia, J.P.; Ribeiro, M.; Souto, N. Design of Frequency Selective Devices for the THz Domain with Applications on Structural Health Monitoring. In Proceedings of the 2019 Thirteenth International Congress on Artificial Materials for Novel Wave Phenomena (Metamaterials), Rome, Italy, 16–21 September 2019.
22. Pozar, D. Microwave Engineering; John Wiley & Sons: Hoboken, NJ, USA, 2012.
23. Naftaly, M.; Vieweg, N.; Deninger, A. Industrial Applications of Terahertz Sensing: State of Play. Sensors 2019, 19, 4203.
24. Cunningham, P.; Valdes, N.; Vallejo, F.; Hayden, L.; Polishak, B.; Zhou, X.; Luo, J.; Jen, A.; Williams, J.; Twieg, R. Broadband terahertz characterization of the refractive index and absorption of some important polymeric and organic electro-optic materials. J. Appl. Phys. 2011, 109, 043505–043510.
25. Madhu, G.; Bhunia, H.; Bajpai, P.; Chaudhary, V. Mechanical and morphological properties of high density polyethylene and polylactide blends. J. Polym. Eng. 2014, 34, 813–821.
26. Dhanumalayan, E.; Joshi, G. Performance properties and applications of polytetrafluoroethylene (PTFE)— a review. Adv. Compos. Hybrid Mater. 2018, 1, 247–268.
27. Reddy, J. Introduction to the Finite Element Method; McGraw-Hill: New York, NY, USA, 2006. 28. Gmsh. Available online: http://gmsh.info/doc/texinfo/gmsh.html (accessed on 23 March 2020).
29. Råback, P.; Byckling, M.; Pursula, A.; Ruokolainen, J.; Zwinger, T.; Malinen, M. CSC-Documentation-Elmer Sover. Available online: https://www.csc.fi/web/elmer/documentation (accessed on 23 March 2020). 30. Abazari, A.; Safavi, S.; Rezazadeh, G.; Villanueva, L. Modelling the Size Effects on the Mechanical
Properties of Micro/Nano Structures. Sensors 2015, 15, 28543–28562.
31. Engineering ToolBox. Available online: https://www.engineeringtoolbox.com (accessed on 23 March 2020). 32. Finite Element Method Magnetics: Documentation. Available online:
http://www.femm.info/wiki/Documentation/ (accessed on 23 March 2020).
© 2020 by the authors. Licensee MDPI, Basel, Switzerland. This article is an open access article distributed under the terms and conditions of the Creative Commons Attribution (CC BY) license (http://creativecommons.org/licenses/by/4.0/).