Universidade de Lisboa
Faculdade de Ciências
Departamento de Química e Bioquímica
C
HARACTERIZATION OFT
HEG
ENETICS
TRUCTURE OFT
HEA
ZOREANP
OPULATIONCLÁUDIA MARGARIDA AGUIAR CASTELO BRANCO
Doutoramento em Genética Molecular
Universidade de Lisboa
Faculdade de CiênciasDepartamento de Química e Bioquímica
Hospital do Divino Espírito Santo de
Ponta Delgada, EPE
Unidade de Genética e Patologia Moleculares
C
HARACTERIZATION OFT
HEG
ENETICS
TRUCTURE OFT
HEA
ZOREANP
OPULATIONCLÁUDIA MARGARIDA AGUIAR CASTELO BRANCO
Doutoramento em Genética Molecular
Tese orientada pela Investigadora Doutora Luisa Mota Vieira (Orientador interno Professora Doutora Margarida Amaral)
De acordo com o disposto no artigo 40º do Regulamento de Estudos Pós-Graduados da Universidade de Lisboa, Deliberação nº 961/2003, publicada no Diário da República II Série nº 153, de 5 de Julho de 2003, foram utilizados nesta dissertação resultados dos seguintes artigos:
Branco CC, Pacheco PR, Cabrol E, Gomes CT, Cabral R, Mota-Vieira L. Linkage disequilibrium on Xq13.3, NRY and HLA regions in São Miguel Island (Azores) population. 2007, submitted.
Branco CC, São-Bento M, Gomes CT, Cabral R, Pacheco PR, Mota-Vieira L. Azores Islands: genetic origin, gene flow and diversity patterns. 2007, submitted.
Branco CC, Cabrol E, São-Bento M, Gomes CT, Cabral R, Vicente AM, Pacheco PR, Mota-Vieira L. Evaluation of linkage disequilibrium on the Xq13.3 region: comparison between the Azores Islands and mainland Portugal. Am J Hum Biol. 2007, in press.
Branco CC, Pacheco PR, Cabral R, Vicente AM, Mota-Vieira L. Genetic signature of the São Miguel Island population (Azores) assessed by 21 microsatellite loci. Am J Hum Biol. 2007, in press. Branco CC, Palla R, Lino S, Pacheco PR, Cabral R, de Fez L, Peixoto BR, Mota-Vieira L. Assessment of the Azorean ancestry by Alu insertion polymorphisms. Am J Hum Biol. 2006; 18: 223-226.
Branco CC, Mota-Vieira L. Surnames in Azores: Analysis of the isonymy structure. Hum Biol. 2005; 77: 37-44.
Cabral R, Branco CC, Costa S, Caravello GU, Tasso M, Peixoto BR, Mota-Vieira L. Geography of surnames in Azores: specificity and spatial distribution analysis. Am J Hum Biol. 2005; 17: 634-645. Pacheco PR, Branco CC, Cabral R, Costa S, Araújo AL, Peixoto BR, Mendonça P and Mota-Vieira L. The Y-chromosomal heritage of the Azores Islands population. Ann Hum Genet. 2005; 69: 145-156.
Branco CC, Mota-Vieira L. Population structure of São Miguel Island (Azores, Portugal): A surname study. Hum Biol. 2003; 75: 929-939.
No cumprimento do disposto na referida deliberação, esclarecemos serem da nossa responsabilidade a execução das experiências que estiveram na base dos resultados apresentados (excepto quando referido em contrário), assim como a sua interpretação e discussão.
P
REFACEGenomic medicine, a biomedical research area which uses the individual information to provide better health care, has been considerably developed since the Human Genome Project. One of its current challenges is the identification of the risk or susceptibility for multifactorial diseases and the study of their frequency in populations. The knowledge produced in this research area, will, most certainly, be responsible for new treatment strategies, such as pharmacogenomics, resulting in more effective and less toxic drugs. This PhD thesis had as major objective contribute to the characterisation of the genetic background and population structure of the Azorean population. The information retrieved from this work is essential in the comprehension of the Azorean diversity and ancestry, which, on the other hand, will be important for the development of genomic medicine, in particular, for the design of future mapping studies in this population. A detailed overview of the literature concerning human diversity markers, population structure and the advantages of isolated versus outbred populations are given in chapters I, II and III, respectively. Chapter I focuses briefly on the contribution of molecular and non-molecular markers, where an introduction of the importance of surnames and of human genome polymorphisms is shown. The use of linkage disequilibrium and its importance in the human genome architecture is demonstrated. Chapter II describes the evolutionary forces, such as genetic drift, selection, mutation and migration, which play a relevant role in the population’s structure. Moreover, genetic distance measures and inbreeding are also presented. Chapter III compares isolated and outbred populations in terms of advantages for genetic studies. Examples of five human isolated populations are exhibited.
Chapter IV is devoted to the characterization of the study population, the Azores. Its geographic location, demography, discovery and settlement are introduced. A brief description of other genetic studies in this population and the objectives of this scientific research are given.
Chapters V, VI and VII assemble the scientific work performed in this PhD thesis, which are object of publication in international journals. Chapter V concerns the structure of Azorean population through the analysis of surnames. Chapter VI approaches the Azorean ancestry, with studies of Y-chromosome lineages and Alu
insertion polymorphisms. Finally, chapter VII reports the Azorean diversity and structure based on genetic markers located both in autosomes and X-chromosome. The last chapter of this thesis, chapter VIII, provides a general integrative discussion of the results placing them in perspective with state-of-the-art data in population genetics field. Perspectives for future work are also highlighted.
A
CKNOWLEDGMENTS“Sometimes our light goes out but is blown into flame by another human being. Each of us owes deepest thanks to those who have rekindled this light.” Albert Schweitzer
Nesta longa caminhada de quatro anos são tantos os agradecimentos que espero não descurar nenhum.
Devo começar pela força motora deste doutoramento, a minha orientadora, Investigadora Doutora Luísa Mota Vieira, que numa tarde de Primavera se sentou ao meu lado e iniciou uma longa conversa na qual ficou decidido o meu projecto de doutoramento. Não posso deixar de mencionar a sua inquestionável orientação, disponibilidade, atenção, interesse, curiosidade, e constante presença, características estas que, embora façam parte da sua personalidade, muito contribuíram para que este projecto chegasse a “bom porto”. A ela dedico a minha total gratidão e amizade.
Às minhas colegas de trabalho e amigas, Paula e Rita, pelas suas questões, ajuda, preocupações, conselhos, disponibilidade, compreensão, e sentimentos. Fiquem certas de que contribuíram para a minha “sanidade mental” tantas vezes ameaçada pelas dificuldades. No entanto, não me lembro apenas das dificuldades, igualmente estiveram presentes nas alegrias, que sem dúvida alguma foram muitas.
Ao Bernardo, pela sua natureza curiosa, pelas suas perguntas infindáveis, pela correcção do inglês dos artigos e finalmente pela sua amizade, expresso a minha total alegria por te ter conhecido e me ter tornado parte do teu circulo de amigos.
Aos restantes membros da UGPM, os que por cá passaram e os que ficam, e amigos, Laura, Ester, Raquel, Sílvia, Cristina, Marta, Quico, Felipe, Cidália, Mónica, Luís e Alexandra, um grande beijinho.
Devo expressar da mesma forma o meu reconhecimento à minha co-orientadora, Professora Doutora Margarida Amaral, pela confiança depositada no meu projecto de investigação e pela sua ajuda em todo o processo logístico.
A todos os dadores de sangue e profissionais de saúde envolvidos nas colheitas das dádivas de sangue, o meu reconhecimento e gratidão.
Ao membros dos Conselhos de Administração do Hospital do Divino Espírito Santo de Ponta Delgada, EPE, que prontamente aceitaram e receberam de bom grado uma estudante de doutoramento. Pelo seu interesse, visão e apoio, o meu muito obrigada.
Aos membros do júri pelas perguntas e interesse científico, o meu reconhecimento.
Aos meus amigos, Maria João, Ana e Marco, pelos vossos ouvidos, expresso o meu apreço. Desejo-vos muita sorte na viagem que vão agora fazer e que sejam felizes.
À minha madrinha, Marília, pelo seu “empurrão”, personalidade e confiança; à minha tia Margarida, pela sua compreensão, apoio e viagens divertidas, o meu muito obrigado.
Às minhas irmãs, Célia e Aurelina, e irmão, João, pelo amor, apoio, presença e interesse. Por serem quem são, dedico-vos todo o meu amor e amizade. Às minhas sobrinhas e afilhadas, Mariana, Sofia e Daniela, adoro-vos.
Aos meus avós, que já partiram, Irondina, José e António, e à que ficou, Maria Augusta, pela preserverança e exemplo de persistência e vida, pelo amor e apoio, toda a minha saudade e amor.
Por último, mas não no meu coração, aos meus pais, João e Fátima, pelo apoio, pelo amor, pela presença, pela coragem e exemplo de vida, dou-vos todo o meu amor.
TABLE OF CONTENTS PREFACE 4 ACKNOWLEDGMENTS 6 FIGURES INDEX 13 TABLES INDEX 14 ABREVIATIONS 15
LIST OF USEFUL WEBSITES 17
RESUMO 18
SUMMARY 21
CHAPTER I.UNDESTANDING HUMAN DIVERSITY:CONTRIBUTION OF MOLECULAR AND
NON MOLECULAR MARKERS 22
I.1. What can we learn from surnames 24
I.1.1. Isonymy, inbreeding and relationship coefficients 27
I.1.2. Surname diversity and migration 29
I.2. The human genome polymorphisms 33
I.2.1. Single Nucleotide Polymorphisms 33
I.2.2. Variable Number of Tandem Repeats 37
I.2.2.1. Satellites 37
I.2.2.2. Minisatellites 38
I.2.2.3. Microsatellite or short tandem repeats 39
I.2.3. Transposable elements 40
I.2.3.1. LINE – L1 41
I.2.3.2. SINE – Alu markers 42
I.2.4. Copy number variation 43
I.3. Linkage disequilibrium: Insight to the human genome architecture 44 I.3.1. Linkage disequilibrium and the international HapMap project 48 CHAPTER II.POPULATION STUDIES:KNOWING THE PAST TO PREDICT THE FUTURE 52
II.1. Population history, demography and evolutionary forces 54 II.1.1. Human population background: paternal and maternal lineages 56
II.1.2. Evolutionary forces 63
II.1.2.1. Genetic drift 64
II.1.2.2. Selection 68
II.1.2.3. Mutation and recombination 70
II.1.2.4. Migration or gene flow 74
II.2. Genetic distance and population structure 77
II.2.1. Genetic distance measures 77
II.2.2. Population structure and inbreeding 78
CHAPTER III.GENETIC ISOLATES VERSUS OUTBRED POPULATIONS 82
III.1. The Finnish population 86
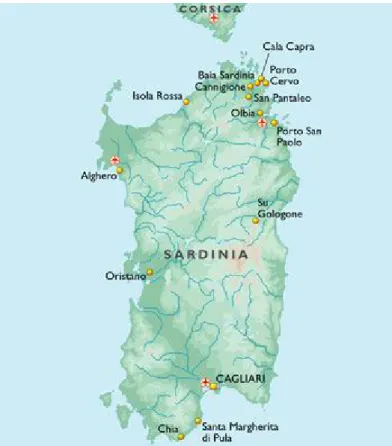
III.2. The Sardinian population 89
III.3. The Old Order Amish population 91
III.4. The Hutterites population 93
III.5. The Saguenay-Lac-St-Jean population 94
CHAPTER IV.THE AZORES 97
IV.1. Geographic location and demographic characterization 98
IV.2. Discovery and settlement 100
IV.3. Genetic studies on the Azorean population 103
IV.4. Objectives of the scientific research 108
CHAPTER V.STRUCTURE OF AZOREAN POPULATION:VIEW FROM SURNAMES 109
V.1. Population Structure of São Miguel Island, Azores: A surname Study 110
V.1.1. Summary 110
V.1.2. Introduction 110
V.1.3. Material and Methods 111
V.1.3.1. Localities 111 V.1.3.2. Surnames 111 V.1.3.3. Mathematical methods 112 V.1.4. Results 114 V.1.4.1. Surname distribution 114 V.1.4.2. Isonymy analysis 115 V.1.5. Discussion 118
V.2. Surnames in Azores: Analysis of the isonymy structure 121
V.2.1. Summary 121
V.2.2. Introduction 121
V.2.3. Material and Methods 122
V.2.4. Results and Discussion 122
V.2.4.1. Surname distribution in Azorean population 122
V.2.4.2. Isonymy parameters 123
V.2.5. Conclusions 126
V.3. Geography of surnames in Azores: Specificity and spatial distribution
analysis 128
V.3.1. Summary 128
V.3.2. Introduction 128
V.3.3. Material and Methods 129
V.3.3.1. Dataset 129
V.3.3.2. Specificity Analysis 129
V.3.3.3. Spatial Autocorrelation Analysis 129
V.3.4. Results 132
V.3.4.1. Surname distribution 132
V.3.4.2. Specificity analysis 133
V.3.4.3. Spatial autocorrelation analysis (Moran’s I coefficient) 135
V.3.5. Discussion 141
CHAPTER VI.AZOREAN ANCESTRY 144
VI.1. The Y-chromosomal heritage of the Azores Islands population 145
VI.1.1. Summary 145
VI.1.2. Introduction 145
VI.1.3. Material and Methods 146
VI.1.3.1. Terminology and nomenclature 146
VI.1.3.2. Population samples 146
VI.1.3.3. PCR amplification of Y-SNPs and endonuclease digestion 147
VI.1.3.4. PCR amplification of Y-STRs 148
VI.1.3.5. Statistical analysis 148
VI.1.4. Results 149
VI.1.4.1. Y-chromosome biallelic polymorphisms 149
VI.1.4.2. Y-chromosome STR polymorphisms 150
VI.1.4.3. Y-chromosome STR polymorphism within haplogroups 153
VI.1.5. Discussion 154
VI.1.5.1. Prevalent Y-chromosome lineages in Azores Islands 154 VI.1.5.2. Variability of Y-chromosome STRs in Azores Islands 158
VI.1.6. Concluding remarks 159
VI.2. Assessment of the Azorean ancestry by Alu insertion polymorphisms 160
VI.2.1. Summary 160
VI.2.2. Introduction 160
VI.2.3. Material and Methods 161
VI.2.3.1. Population samples 161
VI.2.3.2. Alu genotyping 161
VI.2.3.3. Statistical analysis 162
VI.2.4. Results and Discussion 163
VI.2.5. Concluding remarks 166
CHAPTER VII.AZOREAN DIVERSITY AND STRUCTURE 167
VII.1. Genetic signature of the São Miguel Island population (Azores) assessed by
21 microsatellite loci 168
VII.1.1. Summary 168
VII.1.2. Introduction 168
VII.1.3. Material and Methods 168
VII.1.3.1. Population samples 168
VII.1.3.2. STR typing 169
VII.1.3.3. Statistical analysis 169
VII.1.4. Results 170
VII.1.5. Discussion 171
VII.2. Azores islands: genetic origin, gene flow and diversity pattern 174
VII.2.1. Summary 174
VII.2.2. Introduction 174
VII.2.3. Material and Methods 175
VII.2.3.1. Population samples 175
VII.2.3.2. STR genotyping 175
VII.2.3.3. Statistical analysis 176
VII.2.4. Results 176
VII.2.5. Discussion 181
VII.3. Evaluation of linkage disequilibrium on the Xq13.3 region: comparison
between the Azores Islands and mainland Portugal 185
VII.3.1. Summary 185
VII.3.2. Introduction 185
VII.3.3. Material and Methods 186
VII.3.3.1. Population samples 186
VII.3.3.2. STRs typing 186
VII.3.3.3. Statistical analysis 187
VII.3.4. Results 187
VII.3.5. Discussion 188
VII.4. Linkage disequilibrium on Xq13.3, NRY and HLA regions in São Miguel
Island (Azores) population 190
VII.4.1. Summary 190
VII.4.2. Introduction 190
VII.4.3. Material and Methods 191
VII.4.3.1. Population samples and genotyping 191
VII.4.3.2. Statistical analysis 191
VII.4.4. Results and Discussion 192
CHAPTER VIII.GENERAL DISCUSSION 195
VIII.1. Genetic origin of the Azorean population 197
VIII.2. Genetic diversity, relationship and linkage disequilibrium in the
Azorean islanders 199
VIII.3. Inbreeding and population structure 202
VIII.4. Gene flow patterns 207
VIII.5. Concluding remarks and future perspectives 209
REFFERENCES 211
APPENDIXES 233
Appendix IX.1. Allele frequencies for 21 STR loci in São Miguel and mainland Portugal populations 234 Appendix IX.2. Allele frequencies for 15 STR loci in all Azorean islands 236 Appendix IX.3. Allele frequencies for 8 STR loci located on the X-chromosome in all Azorean islands
and mainland Portugal 241
Appendix IX.4. HLA class I and II allele frequencies in São Miguel population 245 Appendix IX.5. Publications on the Azorean population 246
Figures Index
Figure I.1. Isonymy within and between population 27
Figure I.2. Scheme of typical correlograms and of their likely interpretation 32
Figure I.3. Characterization of the human genome. A. General composition. B. Genes and pseudogens content 34
Figure I.4. Schematic representation of SNPs 35
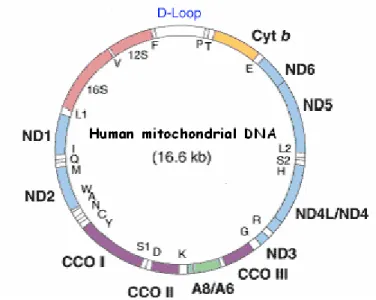
Figure II.1. Human mitochondrial DNA 57
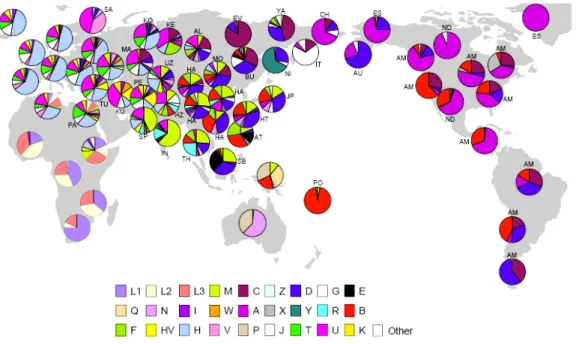
Figure II.2. Worldwide distribution of mtDNA haplogroups 59
Figure II.3. Human Y-chromosome 60
Figure II.4. Worldwide distribution of Y-chromosome haplogroups 62
Figure II.5. Bottleneck and founder effects representation 65
Figure III.1. Map of Finland demonstrating the settlement waves 87
Figure III.2. The timescale of the year of first Finnish publication of some diseases 88
Figure III.3. Map of Sardinia 90
Figure III.4. Map of Lancaster county 91
Figure III.5. The Huterites geographical location 93
Figure III.6. Map of Saguenay-Lac-Saint-Jean 95
Figure IV.1. Map of Azores Islands 98
Figure IV.2. Demographic evolution of the Azores Islands population 99
Figure V.1. Map of São Miguel Island (Azores) 112
Figure V.2. Relationship between the number of surnames and the number of times they appear in the 2001 telephone
book in São Miguel Island 115
Figure V.3. Dendogram obtained from the matrix of Nei's distance between the eleven localities of São Miguel Island 118
Figure V.4. Logarithmic distribution of surnames in Azores 125
Figure V.5. Cluster analysis based on the matrix of Nei's distance for the Azorean population 127
Figure V.6. Map of the Azores archipelago denoting the 19 municipalities 131
Figure V.7. Spatial correlogram of the 113 Bonferroni significant correlograms of surname frequencies in Azores 140
Figure V.8. Average correlograms representing the five patterns of Bonferroni significant I correlograms 140
Figure VI.1. Geographic location of the Azores archipelago 147
Figure VI.2. Phylogenetic tree of the Y-chromosome haplogroups and their percent frequencies in the Azores sample 151
Figure VI.3. Multidimensional scaling of genetic relationships between populations based on Y-STRs 151
Figure VI.4. Population relationships based on six Alu markers. A. Neighbor-Joining tree using FST genetic distances.
B. Principal component analysis based on allele frequencies 165
Figure VII.1. Population relationships based on 11 STRs. A. Neighbor-Joining tree based on Nei's genetic distances.
B. Principal component analysis based on allele frequencies 172
Figure VII.2. Principal component analysis based on allele frequencies in Azores 180
Figure VII.3. Principal component analysis based on Slatkins FST genetic distance using 13 autosomal STRs 181
Figure VII. 4. Comparison of the LD extent in Azores and mainland Portugal evaluated as average multiallelic D'
values versus physical distances 188
Figure VII.5. Comparison of the LD extension Xq13.3, NRY and HLA region, evaluated as average multiallelic D'
values versus physical distances for the São Miguel Island population 193
Figure VIII.1. Population structure for the Azorean and mainland Portugal populations based on 21 STR markers 206
Figure VIII.2. Centroid analysis based on Alu frequencies 209
T
ABLESI
NDEXTable III.1. Examples of genome scans in isolated populations 84
Table III.2. Benefits of isolated and outbred populations 85
Table IV.1. Demography data of the Azores Islands 99
Table V.1. Surnames frequency and distribution in São Miguel Island localities 116
Table V.2. Results obtained in the calculation of isonymy (I), inbreeding coefficient (FST), Fisher's α and Karlin-McGregor
ν for each locality in São Miguel Island 117
Table V.4. Summary of surnames distribution and isonymy parameters for the Azorean islands 124
Table V.5. Azores: Geographic, demographic and telephone subscribers data 134
Table V.6. Specific surnames for each Azorean Island 136
Table V.7. Autocorrelation coefficients (Moran's I) for the considered surnames in the Azorean population 137
Table VI.1. Allele frequencies and gene diversity value at 7 Y-chromosome STR loci in Azorean population 152
Table VI.2. Frequencies of Y-chromosome haplotypes by haplogroup in the Azorean population 155
Table VI.3. Alu insertion frequencies, heterozygosity and gene diversity for Azores and mainland Portugal 163
Table VII.1. Hardy-Weinberg equilibrium (HWE), gene diversity (GD) and inbreeding coefficient (FIS) for São Miguel and
mainland Portugal based on 21 STRs 170
Table VII.2. Hardy-Weinberg equilibrium (HWE) and gene diversity (GD) for 15 STR markers in the Azorean islands 177
Table VII.3. Migration rates among all Azorean islands 179
Table VII.4. Haplotype number (HN), gene diversity (GD) and standardized multiallelic coefficient (D’) for Azorean and
mainland Portugal populations 187
Table VII.5. Haplotype number (HN), gene diversity (GD) and standardized multiallelic coefficient (D’) for the three
genomic regions in the São Miguel Island population 192
Table VIII.1. Inbreeding coefficient based on surnames and allele frequencies of 15 STR loci in all Azorean islands 204
Table VIII.2. Genetic differentiation between populations considering 11 autosomal STR markers and Azores as a whole 205
Abreviations
ABREVIATIONS
AD Alzheimer’s disease
AMH Anatomically modern human
ARSACS Autosomal recessive spastic ataxia of Charlevoix-Saguenay
ASD Autism spectrum disorder
BMI Body mass index
bp Base pairs
BRCA Breast cancer gene
CEPH Centre d’ Etude du Polymorphisme Humain
CEU CEPH project in Utah
CHB Han Chinese population of Beijing
CHD Congenital heart disease
cM CentiMorgan
CNPs Copy number polymorphisms
CNVs Copy number variations
D Depression D-leut Dariusleut
DM1 Myotonic dystrophy
DNA Deoxyribonucleic acid
FMR Fragile X mental retardation
HEXA Hexosaminidase A gene
HIV Human imunodeficiency virus
HG Haplogroups
HLA Human leucocyte antigen
HOGA Gyrate atrophy of choroids and retina
HVR Hypervariable regions
HWE Hardy-Weinberg equilibrium
I Intrusion
IAM Infinite allele model
IBD Identical by descent
IBD+D Isolation by distance and depression
IBD+DDP Isolation by distance and double depression
IBDM Isolation by distance model
IDE Insulin degrading enzyme
ISVs Intermediate-sized variants
JC Jukes-Cantor model
JPT Japanese ancestry from the Tokyo area
kb Kilobases
LCT Lactase gene
LCVs Large-scale copy number variants
LD Linkage disequilibrium
LDD Long-distance differentiation
L-leut Leherleut
Abreviations
LINES Long interspersed nuclear elements
MAF Minor allele frequency
Mb Megabases
MDS Multi dimensional scaling
MHC Major histocompatibility complex
MJD Machado-Joseph disease
mtDNA Mitochondrial DNA
Ne Population size
NF1 Neurofibromin 1 gene
NIDDM Non-insulin-dependent diabetes mellitus
NJ Neighbor-Joining
NPL Non-parametric linkage
NRY Nonrecombining portion of the Y-chromosome
Numts Nuclear mitochondrial pseudogenes
PAH Hepatic phenylalanine hydroxylase
PDHc Pyruvate dehydrogenase complex
PKU Phenylketonuria
OMIM Online mendelian inheritance in man
OOA Old Order Amish
PCR Polymerase chain reaction
RC-L1s Retrotransposition-competent L1s
REV General reversible model
RNA Ribonucleic acid
SA Spatial autocorrelation
S-leut Schmiedeleut
SGCG Gamma-sarcoglycan gene
SINES Short interspersed nuclear elements
SLSJ Saguenay-Lac-Saint-Jean
SMM Stepwise mutation model
SNPs Single nucleotide polymorphisms
SPSS Statistical package for social Sciences
STRs Short tandem repeats
Ta Transcribed active
TPMT Thiopurine S-methyltransferase
tSNPs tag single nucleotide polymorphisms
UPGMA Unweighted pair group method with arithmetic mean
US United States
UTM Universal transverse mercator
VNTRs Variable number of tandem repeats
YBP Years before present
YHRD Y-Chromosome haplotype reference database
YRI Yoruba people of Ibidan Peninsula in Nigeria
Useful websites
LIST OF USEFUL WEBSITES
ALFRED - Allele Frequency Database http://alfred.med.yale.edu/alfred/index.asp
American Society of Human Genetics http://www.ashg.org/genetics/ashg/ashgmenu.htm
Arlequin (software) http://lgb.unige.ch/arlequin/
Copy Number Variation Project http://www.sanger.ac.uk/humgen/cnv
Database of Nuclear DNA http://www.ertzaintza.net/cgi-bin/db2www.exe/adn.d2w
European Directory DNA Diagnostic Laboratories http://www.eddnal.com/
Ensembl Database http://www.ensembl.org/index.html
European Society of Human Genetics http://www.eshg.org
Genetic Data Analysis (software) http://hydrodictyon.eeb.uconn.edu/people/plewis/software.php GENEPOP (software, web version) http://genepop.curtin.edu.au
Gold (software) http://www.sph.umich.edu/csg/abecasis/GOLD/
Human Gene Mutation Database http://www.hgmd.cf.ac.uk/ac/index.php
Human Genome Database http://www.gdb.org
Human Genome Project http://www.ornl.gov/sci/techresources/Human_Genome/home.shtml
Human Genome Variation Database http://hgvbase.cgb.ki.se
IMGT/HLA Database http://www.ebi.ac.uk/imgt/hla
National Centre for Biotechnology Information http://www.ncbi.nlm.nih.gov
Online Mendelian Inheritance in Man http://www.ncbi.nlm.nih.gov/sites/entrez?db=OMIM
Orphanet http://www.orphanet.pt/
Portuguese Society of Human Genetics http://www.spgh.net
Rare diseases database http://www.rarediseases.org/
Single Nucleotide Polymorphism Database http://www.ncbi.nlm.nih.gov/projects/SNP
SPSS (software) http: //www.spss.com
STRBase http://www.cstl.nist.gov/biotec/strbase
Structure (software) http://pritch.bsd.uchicago.edu/software.html
The International HapMap Project http://www.hapmap.org
UCSC Genome Bioinformatics http://genome.ucsc.edu
Wikipédia http://pt.wikipedia.org/wiki/P%C3%A1gina_principal
Y-Chromosome Consortium http://ycc.biosci.arizona.edu
Y-STR haplotype Database http://www.ystr.org
Resumo
R
ESUMOO estudo da diversidade genética humana possibilita um melhor conhecimento dos padrões de distribuição das doenças genéticas numa população, bem como contribui para a caracterização da evolução humana. O arquipélago dos Açores (Portugal), situado no norte do oceano Atlântico, é composto por nove ilhas vulcânicas distribuídas desigualmente por três grupos geográficos: o oriental com duas ilhas – São Miguel e Santa Maria –, o central que inclui cinco ilhas – Terceira, Pico, Faial, São Jorge e Graciosa –, e o ocidental com Flores e Corvo. A fim de compreender e determinar o fundo genético da população açoriana, a presente tese teve por base duas abordagens principais: os nomes de família (sobrenomes) e os marcadores genéticos localizados em diferentes cromossomas.
A avaliação da origem genética da população dos Açores foi realizada através da análise de linhagens paternas (cromossoma Y) e marcadores Alu. O cromossoma Y apresenta algumas vantagens que possibilitam traçar linhagens, nomeadamente não sofre recombinação e é transmitido de pais para filhos. Contudo, quando um pai apenas tem filhas essa linhagem pode-se perder. Assim, o estudo das origens de uma população deve ser complementado com marcadores localizados nos cromossomas autossómicos, por exemplo, os polimorfismos de inserção Alu. Estes polimorfismos possibilitam a inferência directa do estado ancestral (ausência de inserção), e a sua aplicação aos estudos da evolução populacional é vantajosa. Além disso, as inserções Alu representam ambas as contribuições – paterna e materna –, uma vez que estão sujeitas a eventos de recombinação e outras forças evolutivas. Os resultados das linhagens paternas na população Açoriana revelaram nove haplogrupos (HG) diferentes, na sua maioria frequentes na Europa. Assim, os dados apontam para uma grande contribuição de indivíduos do continente português, bem como, embora em frequências mais baixas, de indivíduos do Médio-Oriente (HG J*) e do norte de África (HG E*(xE3)). Igualmente, os resultados baseados nos marcadores Alu indicam uma proximidade elevada entre populações portuguesas, marroquinas e espanholas, nomeadamente, Catalãos e Andaluzos. Esta proximidade reflecte-se na árvore filogenética, onde os Açores e Portugal continental ramificam com Catalunha, Andaluzia, Marrocos e Argélia, bem como corrobora com os resultados obtidos nas análises do cromossoma Y e dos marcadores autossómicos.
Resumo A determinação da diversidade genética com marcadores neutros permite conhecer se as forças evolutivas, designadamente, a deriva genética e a selecção, imprimem a sua influência na assinatura genética de uma população. Na presente tese, a diversidade da população Açoriana foi calculada com base em diferentes marcadores, a saber: sobrenomes, Short Tandem Repeats (STRs autossómicos, Y e X) e polimorfismos de inserção Alu. Os valores médios de diversidade obtidos nos diferentes estudos mostram que, no general, a população açoriana é muito diversa, apresentando valores mais elevados do que os encontrados no continente português. O estudo de abundância dos sobrenomes e de variabilidade dos microssatélites em cada ilha açoriana revelou que as ilhas mais diversas são Terceira e São Miguel. Ambos os estudos apontam para que as ilhas mais pequenas – Corvo, Graciosa e Santa Maria –, apresentem, como esperado, valores mais baixos de variabilidade. A análise de parentesco entre ilhas foi avaliada usando os sobrenomes e 15 STRs. Duas imagens diferentes emergem: os sobrenomes mostram uma proximidade maior entre os grupos central e ocidental, e os STRs posicionam o grupo central mais próximo do oriental. Esta dualidade pode ser explicada pelo facto dos sobrenomes exibirem uma imagem mais recente, que considera as características sócio-económicas das ilhas, enquanto os dados dos microssatélites revelam a evolução baseada nas características do povoamento do arquipélago, onde se evidenciam São Miguel e Terceira como agentes principais no povoamento das restantes ilhas. Ambas as abordagens são complementares. Em termos de desequilíbrio de ligação (LD), o grupo ocidental apresentou um valor de LD multialélico (D’) mais elevado (0,328), no entanto, este valor indica a ausência de LD neste grupo de ilhas. Os grupos central e oriental mostram valores semelhantes, ambos com ausência de LD. Em suma, os Açores, bem como Portugal continental, evidenciam LD apenas para distâncias físicas curtas. Estes dados sugerem que será necessário um número elevado de marcadores para realizar estudos de mapeamento fino de genes de susceptibilidade para doenças complexas. No entanto, outras características (por exemplo, o mesmo ambiente e a possibilidade de construir grandes pedigrees através de registos civis e da igreja) fazem desta população um recurso possível para futuros estudos genéticos.
O coeficiente de consanguinidade populacional tem um papel determinante na identificação da subdivisão de populações humanas. As estimativas baseadas em STRs e sobrenomes evidenciam valores diferentes. O coeficiente de consanguinidade calculado a partir dos nomes de família para a ilha de São Miguel é cerca de sete vezes
Resumo menor do que o obtido com base nos 21 STRs. Ambas as determinações têm inconsistências e nenhum valor preciso é conseguido; no entanto, todas as análises demonstram que a população açoriana é uma população aberta. De acordo com Wright (1984), valores inferiores a 0.05, como os verificados nas populações de Portugal continental e Açores, indicam pouca diferenciação genética. A presença de estrutura genética numa população pode conduzir a dados falsos e, possivelmente, a erros de interpretação. Assim, apesar de estarem dispersos por três grupos geográficos e constituírem uma população admixed, os Açores não apresentam subdivisão genética, e podem, portanto, ser considerados como um todo homogéneo, uma vez que as diferenças genéticas entre ilhas não são estatisticamente significativas.
Os padrões de dispersão dos indivíduos têm impacto significativo na admixture e na estrutura genética de uma população. As taxas de migração foram calculadas a partir de sobrenomes e microssatélites. O valor de migração para a ilha do Corvo baseado em STRs sugere que esta população está sedentária. Um valor controverso foi obtido a partir dos sobrenomes, onde esta ilha apresenta o valor mais elevado de migração indicando a saída de indivíduos desta para as outras ilhas. Ambos os estudos, sobrenomes e STRs, evidenciam o movimento dos indivíduos para as ilhas maiores, a saber, São Miguel e Terceira. Os resultados de dispersão espacial dos sobrenomes revelam que o movimento dos indivíduos ocorre essencialmente entre ilhas mais próximas (isolamento pela distância).
Em conclusão, os dados apresentados ao longo desta tese melhoram o conhecimento do fundo genético da população açoriana: os açorianos são uma população aberta com diversidade genética elevada, fluxo genético relativo e sem extenso desequilíbrio de ligação. Além disso, os padrões da diversidade são uma consequência directa da história do povoamento do arquipélago. Os resultados aqui explanados complementam o passado, estabelecendo a ponte entre a genética e a história; melhoram o conhecimento do presente; e contribuem para compreender o futuro, uma vez que o fundo genético, bem como o ambiente, influenciam certamente o tipo e a distribuição das doenças na população açoriana.
Palavras-chave: Fundo genético, diversidade genética, estrutura populacional, desequilíbrio de ligação, Açores.
Summary
S
UMMARYThe study of human genetic variation allows a better understanding of disease patterns of a population, as well as, contributes to the comprehension and description of human evolution. In the present thesis, we present a broader view of the genetic structure of the Azorean population. The Azores is composed of nine volcanic islands unevenly distributed by three geographic groups: Eastern, Central and Western. We address the diversity and genetic background of this population considering surnames, SNPs, Alu insertion polymorphisms and different STR markers, located in different chromosomes (autosomal, Y and X).
The assessment of the genetic ancestry of the Azoreans, based on Alu insertion polymorphisms and Y-chromosome lineages, shows that the main contributors were the mainland Portuguese with an important participation of Middle eastern and north African populations. Additionally, the results of migration using surnames and STRs evidence relative gene flow among islanders. Considering molecular markers, the Azoreans generally present a higher genetic diversity when compared to mainland Portugal and other European populations. The surnames and molecular markers reveal no genetic structure, although the Azores are dispersed through three geographical groups and constitute an admixed population. In terms of linkage disequilibrium (LD), which was estimated in the HLA, Xq13.3 and NRY regions, the archipelago, similarly to mainland Portugal, shows LD only for short physical distances. All analyses suggest that the Azoreans are an outbred population, where the identification of IBD regions will require high density of genetic markers. Thus, the results demonstrate that both surnames and molecular markers are complementary and aid in the genetic characterization of a population.
In general, this thesis improved the knowledge of the genetic signature of Azoreans, complement the past by connecting genetics and history and will contribute to predict the future in terms of disease distribution in this population.
Keywords: Genetic signature, genetic diversity, population structure, linkage disequilibrium, Azores Islands.
“Why not let people differ about their answers to the great mysteries of the Universe? Let each seek oneʹs own way to the highest, to oneʹs own sense of supreme loyalty in life, oneʹs ideal of life. Let each philosophy, each world‐view bring forth its truth and beauty to a larger perspective, that people may grow in vision, stature and dedication.” Algernon Black
CHAPTER I
U
NDERSTANDINGH
UMAND
IVERSITY:
C
ONTRIBUTION OFM
OLECULAR ANDN
ON-
MOLECULARM
ARKERSCHAPTER I Understanding Human Diversity
I. Understanding human diversity: contribution of molecular and
non-molecular markers
In the animal kingdom, some species, such as, Asian lion, puma and cheetah, show very little genetic diversity (Driscoll et al. 2002); however, most organisms, inc1uding humans, have a considerable amount of genetic variation (Li and Sadler 1991). The proportion of genetic diversity that exists between human populations is relatively low. An early study, based on protein polymorphisms, estimated a 15% diversity between groups (Lewontin 1972). More recently, autosomal variation studies have shown that ~83-88% is found within populations and ~9-13% between continental populations (Jorde et al. 2000; Romualdi et al. 2002).
Around the world, genetic variation is geographically structured. Several scenarios for this strucutre are possible; for example, there are species in which it is observed sharp regional/ continental discontinuities, making variation different between groups, and those who are geographically undifferentiated, where variation is due to differences between individuals (Barbujani and Goldstein 2004).
An understanding of how genetic diversity is structured in the human species is not only of anthropological and political importance, but also of medical relevance with important implications for human evolution, forensics and distribution of genetic diseases in populations (Cavalli-Sforza and Feldman 2003; The International HapMap Consortium 2005; Tishkoff and Kidd 2004; Foster and Sharp 2004; Jorde et al. 2000). For instance, if major differences in allele frequencies exist between populations, individuals from different origins may often be expected to respond differently to medical treatments (Wilson et al. 2001).
Studies of genetic diversity from restricted geographical areas, where large numbers of individuals are sampled and a reasonable geographic coverage of the variation is achieved, generally reveal spatial gradients of allele frequencies (Barbujani et al. 1995; Rosser et al. 2000; Karafet et al. 2001) that are only occasionally disrupted by local discontinuities corresponding to linguistic or geographical barriers (Barbujani and Sokal 1990). This suggests that isolation by distance (i.e. decreasing gene flow with increasing geographical distances) may be the most appropriate description of human genetic
CHAPTER I Understanding Human Diversity diversity (Cavalli-Sforza et al. 1994). In contrast, worldwide studies of human diversity based on “populations” generally find that individuals cluster discretely depending on their continents of origin (Cavalli-Sforza et al. 1988; Bamshad et al. 2003; Rosenber et al. 2002; Lao et al. 2006), and this is sometimes taken to mean that human genetic diversity is structured according to etnia (Risch et al. 2002; Burchard et al. 2003). The discrepancy in results between regional and global surveys of human genetic diversity could suggest that gradients in allele frequencies are restricted to smaller geographic regions, whereas the continents are distinguished by discontinuities in genetic diversity. Alternatively, the discrepancies may result from differences in study design as suggested, for example, by Kittles and Weiss (2003). Serre and Paabo (2004) demonstrated that when individuals are sampled homogeneously from around the globe, the pattern seen is one of gradients of allele frequencies that extend over the entire world, rather than discrete clusters. Therefore, there is no reason to assume that major genetic discontinuities exist between different continents or “races”1.
To understand the population genetic structure it is necessary the description of the differences in polymorphism content and diversity patterns between different groups, subpopulations or metapopulations. The most obvious way to attain this characterization is through the study of molecular markers. However, approaches using cultural, demographic and socioeconomic information may also play an important role in the understanding of diversity, inbreeding and migration.
I.1. What can we learn from surnames
Cultural traits are transmitted from ancestors to their descendants, in a process analogous to inheritance, and are subject to changes, similar to mutations, by interaction between individuals, such as, teaching and imitation. In fact, they enhance the relationships within human groups, defining social entities comparable to certain biological species and populations (Manrubia and Zanette 2002).
Surnames are cultural traits (Cavalli-Sforza and Feldman 1981) whose transmission bears strong similarity with that of some biological features. In systems where surname
1 This is a strong support against those who still believe in the existence of “races” or even “superior races”.
CHAPTER I Understanding Human Diversity attribution is through the paternal line, surnames simulate neutral alleles of a gene transmitted by the Y-chromosome. Thus, the expectations of the neutral theory of evolution, which is entirely described by random genetic drift, mutation, selection and migration, are satisfied (Zei et al. 1983). This property of surnames, together with their availability in large numbers, from present, as well as, from historical populations, makes them useful for the study of population structure (Pettener et al. 1998).
In recent decades, surnames have been used as genetic markers to estimate inbreeding changes in a population (Crow and Mange 1965; Pinto Cisternas et al. 1985; Gueresi et al. 2001; Boattini et al. 2006; Colantonio et al. 2006), to measure the degree of population subdivision (Lasker and Kaplan 1985; Madrigal et al. 2001; Colantonio et al. 2002; Esparza et al. 2006), and to analyze changes in genetic relationships between populations (Lasker 1977; Weiss 1980; Chen and Cavalli-Sforza 1983; Relethford 1988; Pettener et al. 1998; Calderon et al. 2006).
Surnames began to be used for studying the genetic structure of populations after Crow and Mange (1965) published an article on the measurement of inbreeding from frequency of isonymous marriages. Twelve years later, Lasker (1977) described a method for estimating the genetic relationship between populations through isonymy (Ri). This method has been widely used (Lasker and Mascie-Taylor 1983; Pinto-Cisternas et al. 1990; Rodríguez-Larralde 1993) and new aspects of population genetics were approached (Rodriguez-Larralde et al. 2000). Others, for example, Chen and Cavalli-Sforza 1983; Relethford 1988; Morton and Yasuda 1980 and Zei et al. 1983, have studied similarities between populations adapting Malécot's genetic kinship between populations to surnames (Malécot 1950). Furthermore, Pinto-Cisternas et al. (1990) and Barrai et al. (1990) have derived variances for parameters estimated from surnames (Rodriguez-Larralde 1993).
The use of surnames models, similarly to other genetic models, is dependent of some assumptions. The method of Crow and Mange (1965) assumes, among other things, that surnames are monophyletic, that non-random mating is symmetrical with respect to sex, and that changes of spelling, illegitimacy, or adoption do not occur. However, in large heterogeneous societies these assumptions do not hold, therefore, “... less confidence can be placed in precise estimates of kinship…” Relethford (1988). Nevertheless, the relative value of these estimates is still informative, especially when large sample sizes
CHAPTER I Understanding Human Diversity and the same source of information and methodology are used in an entire country. In reality, isolation by distance has been determined with the use of surnames as well as the existence of population clusters within countries, where surname distribution and, presumably, genetic composition are more homogeneous (Barrai et al. 1997; Rodriguez-Larralde et al. 2000).
Nowadays, in many countries, millions of surnames of telephone users, often available on CD-Roms or online, can be efficiently analyzed in a short time. As examples, the surname structure of Switzerland (Barrai et al. 1996), Germany (Barrai et al. 1997), Italy (Barrai et al. 1999), Austria (Barrai et al. 2000), France (Mourrieras et al. 1995), and the Netherlands (Barrai et al. 2002) were studied, taking into account, in total, more than 20 million surnames. Investigated at different geographic scales, surname-inferred genetic structures were sometimes regarded with a certain suspicion because they are simulated markers for a single locus. A good example of the doubts about surname studies was expressed by Rogers (1991) “The method ... requires an assumption that has not been appreciated: it is necessary to assume that all males in some ancestral generation, the founding stock, had unique surnames. Because this assumption is seldom justified in real populations, the applicability of the isonymy method is extremely limited. Even worse, the estimates it provides refer to an unspecified founding stock, and this implies that these estimates are devoid of information”. Nonetheless, the isonymy method was applied to genealogical databases (Gagnon and Heyer 2001; Gagnon and Toupance 2002), and consanguinity was estimated both from surnames and genealogies. Results indicate that random isonymy, estimated from family names, is not devoid of information; on the contrary, it fits well with consanguinity estimates obtained from the genealogical records (Manni et al. 2005).
Manrubia and Zanette (2002) have shown that results for the stationary distribution of surnames frequency are in good agreement with field data for modern human populations in different countries. Through an analysis of the transient time required for this distribution to reach its asymptotic shape, they demonstrated that some deviations observed in real data might actually reflect the composition of the founder population. This result has implications in the study of polyphyletism. Indeed, if the same surname can have multiple origins and, consequently, the individuals carrying it are not always phylogenetically related, the shape of the surname distribution will be affected. The
CHAPTER I Understanding Human Diversity strong resemblance between the cultural inheritance of the surname and the biological process in which nonrecombining neutral alleles are passed to offspring has justified applying results from field data (Barrai et al. 1996). In the few cases, where data on genetic diversity was available, it was possible to retrieve information on past populations by comparing both sets of data (Sykes and Irven 2000). A specific example comes from the small island of Tristan da Cunha, where 300 inhabitants represent only seven surnames and five mitochondrial lineages reflects without doubt the small size of the founder population (Soodyall et al. 1997; Manrubia and Zanette 2002).
I.1.1. Isonymy, inbreeding and relationship coefficients
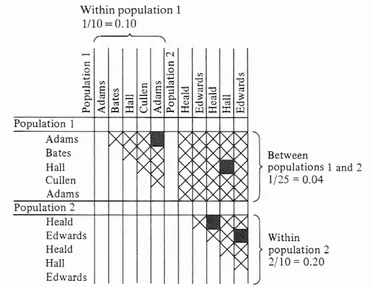
Isonymy is the possession of the same surname. The proportion of isonymy is the frequency in which this happens; interpopulation isonymy occurs between two samples and marital isonymy takes place between spouses considering both given surnames. Figure I.1 shows how intrapopulation and interpopulation isonymy are calculated.
Figure I.1. Isonymy within and between population. Black squares represent isonymous pairs;
crosses represent all other possible pairs (adapted from Lasker 1985).
The term isonymy is sometimes limited to marital isonymy or used as an estimate of inbreeding from the proportion of isonymy, but such limitations and extensions may be confusing and the term should not be used in these ways without all explanation.
CHAPTER I Understanding Human Diversity There are several methods to calculate isonymy. According to Relethford (1988), the random isonymy between populations i and j is
Iij=Σpkipkj
where pki and pkj are the relative frequencies of surname k in the populations i and j,
respectively. On the other hand, according to Rodriguez-Larralde et al. (1993) unbiased random isonymy within the population is calculated by the formula:
Iii=Σk(pik)2–1/Ni
where pik is the relative frequency of surname k in the ith population, and Ni is the
sample size of the same population.
Population structure constitutes deviations from panmixia, such as, those due to limited number of ancestors, to gender, to preference of certain types of consanguineous marriage, and to limited migration in social or geographic space (Rodriguez-Larralde et al. 2003). Several studies have shown that cultural, demographic and socioeconomic factors (religious beliefs, pattern of between-generation transfer of familial property, and increased number of relatives following a demographic expansion) influence the consanguinity level of populations (Manni et al. 2005; Rodriguez-Larralde et al. 2003). Inbreeding has been extensively analyzed by the use of surnames in populations with different degrees of isolation in Europe, Asia and north America (Colantonio et al. 2003 and references therein). In 1965, Crow and Mange used the marital isonymy to estimate the frequency of consanguineous marriages as a measure of inbreeding. Based on Wright’s hierarchical model, they defined the total inbreeding by isonymy and its random and non-random components, in order to describe the effects of subdivision of a population in causing deviations from random mating. Currently, it is widely accepted that the calculation of the random component of inbreeding (FST) within the
subpopulation is obtained from the formula, where I is the isonymy within subpopulation i:
FST=Iii/4
The calculation of FST for the whole population is based on the formula suggested by
Relethford (1988):
FST=Σwiϕii
where ϕii is the random component of inbreeding (Iii/4) of the ith subpopulation, and wi
CHAPTER I Understanding Human Diversity population.
The random component of the inbreeding coefficient when calculated from surnames is merely a statement concerning the average commonality of surnames between males and females in the population multiplied by a constant. The constant used is one-quarter, because this is the likelihood of a gene being shared by the homologous autosomal chromosomes of an offspring of first-degree relatives. The same fraction applies to other degrees of relationship following the logic adopted by Crow and Mange (1965). The likelihood of a gene being shared by first-degree relatives themselves is one in two. Therefore, their coefficient of relationship by isonymy, Ri, is the proportion of isonymy multiplied by one half. As applied to the males and females of a population this is,
Ri=Σpiqi/2
if one extends the logic and the assumption of the monophyly of surnames to two populations this can be expressed as
Ri=Σ(Si1Si2)/2piqi/2ΣSi1 ΣSi2
in which Si1 is the number of occurrences of the ith surname in a sample from
population 1 and Si2 is the number of occurrences of the same surname in a sample
from population 2. Unlike the inbreeding coefficient by isonymy, the coefficient of relationship by isonymy is not divided into random and non-random components, it is a measure of the random component.
I.1.2. Surname diversity and migration
Human migration has been studied from many points of view. When using a surname model to study its effects, it is only considered as the mechanism that redistributes genes geographically. Human migration draws pedigree lines on maps. The pattern of those lines depicts an aspect of human population structure with significance to population genetics – inbreeding. Moreover, such mapping of pedigree lines can be used to explain distributions of human genetic polymorphisms. Human genes cannot move except by the movements of people who carry them (at least before artificial insemination). Therefore, historically, human migration accounted for all the movement of genes (Lasker 1985).
CHAPTER I Understanding Human Diversity Gene movement may be seen in the distances from birthplaces of parents to the birthplaces of their children. Tracing individual pedigrees has been done by geneticists and others, but such studies inevitably have a geographic aspect. Pedigrees, however, are not representative of the population as a whole. Male ancestors are usually easier to identify and trace than female, so the male line is usually more complete than female and mixed lines. As consequence the picture based on a collection of pedigrees is likely to be biased or to cover only the very few recent generations that can be completely ascertained (Lasker 1985).
The identification of the various evolution agents of the genetic structure of human populations and the assessment of their relative weight are one of the main aims of population genetics. The high level of genetic polymorphism observed in human populations has led to a search for adaptative explanations of genetic variation. However, microevolutionary events often seem better explained by migration effects, particularly immigration. Immigration implies addition of genes, which may profoundly affect gene frequencies of the receiving population, thus, becoming a driving evolutionary force. The amount of immigration has relatively little significance compared to the structure of the phenomenon, since, for instance, genetic difference between immigrants and receiving populations is believed to increase with geographical distance. One of the immigration determining elements is the choice of mates. In order to predict the nature of genetic changes, selective mating can be studied by analysing the shape and the central tendency of the distribution of distances between the places of birth of spouses (Biondi et al. 1993).
In 1983, Zei and collaborators proposed a method to estimate migration based on the observation that surnames generate, at equilibrium, a distribution that fits the model introduced by Karlin and McGregor (1967). This model presents the distribution of alleles expected according to the neutral theory of evolution. In a population of constant finite size, the equilibrium is reached when the number of surnames entering the population by mutation and migration equals that lost by drift. Surname mutation is relatively rare, so it can be assumed that new surnames enter into a population mainly by immigration. Moreover, in a very large population, the statistical properties of the surname distribution can be strongly correlated with genetic diversity (Barrai et al. 1996; Manrubia and Zanette 2002). Zei et al. (1983) observed that Fisher’s logarithmic
CHAPTER I Understanding Human Diversity distribution (Fisher 1943) derived to represent the variation in the abundance of surnames, that is, diversity. The use of that distribution to predict the number of surnames in a sample represents an excellent approximation of the Karlin-McGregor distribution. Fisher's distribution is theoretically more satisfactory for surnames than Pareto's, since it is easier to fit. Finally, Zei et al. (1983) were able to integrate the parameters introduced by Fisher (α) with the parameters of the Karlin-McGregor distribution (ν) combining ease of computation with meaningful theoretical interpretation through the following formulas:
Fisher’s α and
α=1/Iii
Karlin-McGregor’s ν
ν=α/(Ni+α)
establishing the relationship between Fisher’s α, Karlin-McGregor’s ν and population size.
Additionally, the study of the spatial distribution of genetic variation has been considered important in population studies (Rosenberg et al. 1999; Lefevre-Witier 2006). Spatial autocorrelation (SA) is the dependence of the values of a variable at specified geographic locations on the values of the same variable at neighbouring locations. Spatially autocorrelated data violate the assumption of independence required for most standard statistical tests, calling for special tests designed to remove the dependence of the variable on geography. Although the analysis of SA is often associated with removing the internal dependence of variables on the underlying spatial structure during hypothesis testing, the SA analysis can lead to important discoveries about the scale where spatial patterns occur, which in turn may suggest underlying factors with similar patterns. Spatial autocorrelation analysis has been used to study a variety of phenomena, such as, the genetic structure of plant, animal and human populations (Sokal et al. 1986; Epperson 1992; Barbujani and Sokal 1991), mortality (Setzer 1985) and their morphological patterns (Epperson and Clegg 1986; Sokal and Uyherschaut 1987).
Spatial autocorrelation summarizes the genetic similarity between populations in relation to their geographical proximity. In particular, spatial autocorrelation helps to focus on the similarity of values of a variable, i.e. the frequency of a surname, between
CHAPTER I Understanding Human Diversity pairs of populations within arbitrary classes of distance (Caravello and Tasso 1999). This method allows estimation of the spatial distribution of surnames in the considered territory, in order to emphasize the specific processes of diffusion of individuals. It was developed by Moran (1950), perfected by Ripley (1981), as well as by Cliff and Ord (1973), whereas Sokal and Oden (1978a,b) were the first to apply it to biological problems. The following formula allows an estimate of this autocorrelation coefficient:
n n n
I=nΣΣwij(pi–p)(pj–p)/WΣ(pi–p)2
i=1j=1 i=1
where pi and pj are the relative frequency of surnames at the ith and jth localities, p is
the mean across the n municipalities, wij is equal to 1 for all the pairs of municipalities
falling in the studied distance class and equal to 0 for all the other pairs, and W is the sum of all wij values in that distance class. In large samples Moran’s I coefficient varies
between -1 to +1, where positive significant values (I>0) indicate similar frequencies and negative significant values (I<0) indicate dissimilarity (Barbujani et al. 1992).
Figure I.2. Scheme of typical correlograms and of their likely interpretation. X-axis represents
geographic distance and the Y-axis autocorrelation values. Shaded circles are significant autocorrelation coefficients; open circles are insignificant coefficients (adapted from Barbujani 2000). a. Random c. Depression b. Cline d. Isolation by Distance a. Random c. Depression b. Cline d. Isolation by Distance
Autocorrelation coefficients can be assembled in a plot named correlogram, which allows a better summary of the variation. The main classes of correlograms can be related with the likely evolutionary processes generating them. Clines affecting the
CHAPTER I Understanding Human Diversity entire study area (Figure I.2b) or only a part of it (Figure I.2c) can be discriminated from the patterns expected under random genetic variation (Figure I.2a). In statistical terms, the null hypothesis is clearly random distribution of allele frequencies in space. In population genetics terms, however, geographic randomness would be surprising. As a rule, geographically close populations exchange more migrants than distant populations and the degree of relative isolation between localities is roughly proportional to their geographic distance (Barbujani and Sokal 1991; Barbujani 2000).
I.2. The human genome polymorphisms
The success of the Human Genome Project2 has given us an exceptional understanding of the structure and organization of our genome (Figure I.3). Variability is observed in the human genome through single nucleotide polymorphisms (SNPs), variable number of tandem repeats (VNTRs; e.g. mini and microsatellites), presence/ absence of transposable elements (e.g. Alu elements) and structural alterations (e.g. deletions, duplications and inversions; Freeman et al. 2006).
I.2.1. Single nucleotide polymorphisms
Variations in DNA (deoxyribonucleic acid) sequence can have a major impact on how humans respond to disease, to environment and to drugs or other therapies. This makes single nucleotide polymorphisms of great value for biomedical research, for medical diagnostics and for developing pharmaceutical products (Jobling et al. 2004).
A SNP is a DNA sequence variation occurring when a single nucleotide – A, T, C or G – in the genome, or other shared sequence, differs between members of a species or between paired chromosomes in an individual (Figure I.4).
2 http://www.ornl.gov/sci/techresources/Human_Genome/home.shtml. Begun formally in 1990, the Human Genome
Project was a 13-year effort coordinated by the U.S. Department of Energy and the National Institutes of Health. The project originally was planned to last 15 years, but rapid technological advances accelerated the completion date to 2003. During the early years of the project, the Wellcome Trust (United Kingdom) became a major partner, but additional contributions came from Japan, France, Germany, China, and others.
CHAPTER I Understanding Human Diversity
A.
B.
Figure I.3. Characterization of the human genome. A. General composition, Genes and relat: genes
and associated sequences; Int.R: intergenic regions; UN: unique intergenic sequences; Rep: repetitive intergenic sequences; IR: repetitive dispersed intergenic sequences; TR: tandem repeats (Adapted from Ameziane et al. 2006). B. Genes and pseudogenes content (Adapted from Human Genome Database, last update 27 August 2007, GDB, http://www.gdb.org/gdbreports/CountGeneByChromosome.html.) Human Genome Int. R 75% Genes and relat 25% 2% UN. 20% Rep. 55% 23% TR 10% 13% IR 45% 5% 3% 1% Introns, promotors and pseudogenes
Coding sequences and regulation regions
SINE LTR LINE Transposons Satellites Minisatellites Microsatellites Human Genome Human Genome Int. R 75% Int. R 75% Genes and relat 25% 2% UN. 20% Rep. 55% 23% TR 10% 13% IR 45% 5% 3% 1% Introns, promotors and pseudogenes
Coding sequences and regulation regions
SINE LTR LINE Transposons Satellites Minisatellites Microsatellites 0 200 400 600 800 1000 1200 1400 1600 1800 2000 Genes(Total=19,446) Pseudogenes(Total=2275) 24 9 23 7 19 2 18 3 17 4 16 5 15 3 13 5 13 2 13 2 13 2 12 3 10 8 10 5 99 84 81 75 69 63 54 57 14 1 60 Mb 8. 3 7. 8 6. 4 6. 1 5. 8 5. 5 5. 1 4. 5 4. 4 4. 4 4. 4 4. 1 3. 6 3. 5 3. 3 2. 8 2. 7 2. 5 2. 3 2. 1 1. 8 1. 9 4. 7 2. 0 % Mb 0 200 400 600 800 1000 1200 1400 1600 1800 2000 Genes(Total=19,446) Pseudogenes(Total=2275) 24 9 23 7 19 2 18 3 17 4 16 5 15 3 13 5 13 2 13 2 13 2 12 3 10 8 10 5 99 84 81 75 69 63 54 57 14 1 60 Mb 8. 3 7. 8 6. 4 6. 1 5. 8 5. 5 5. 1 4. 5 4. 4 4. 4 4. 4 4. 1 3. 6 3. 5 3. 3 2. 8 2. 7 2. 5 2. 3 2. 1 1. 8 1. 9 4. 7 2. 0 % Mb
CHAPTER I Understanding Human Diversity
Figure I.4. Schematic representation of SNPs (adapted from International HapMap Consortium
20033).
SNPs are evolutionarily stable, this is, they change very little from generation to generation. This makes them easier to follow in population studies. Several studies have used SNPs to identify genes associated with complex diseases (e.g. Pearson et al. 2007; Abel et al. 2006). These associations are difficult to establish with conventional gene-hunting methods, because a single altered gene may make only a small contribution to the disease. SNPs in the coding regions of genes or in regulatory regions are more likely to cause functional differences than SNPs elsewhere. Although most SNPs do not affect gene function, a large number of them will be valuable as markers throughout the genome for finding SNPs that affect gene function or are in linkage disequilibrium (LD) with the gene causing disease (Patil et al. 2001). It has been estimated that, in the world’s human population, about 10 million sites (that is, one variant per 300 bases on average) constitute 90% of the variation in the population and differ in a way that both alleles are observed at a frequency of 1% (Crawford et al. 2005). The remaining 10% of variation is due to a vast array of variants that are rare in the population.
Overall, the average nucleotide diversity (π), representing the likelihood that a given nucleotide position differs across two randomly sampled sequences, is about 8x10⁻⁴ in both genome-wide and locus-specific studies (Przeworski et al. 2000; International SNP Map Working Group 2001; Venter et al. 2001). This means that, on average, it is expect
3 http://www.hapmap.org. The International HapMap Project is a partnership of scientists and funding agencies from
Canada, China, Japan, Nigeria, the United Kingdom and the United States to develop a public resource that will help researchers find genes associated with human disease and response to pharmaceuticals.
CHAPTER I Understanding Human Diversity to find one SNP about every 1250 bp. The value of π varies significantly between chromosomes, from 5.19x10⁻⁴ for chromosome 22 to 8.79x10⁻¹ for chromosome 15. Additionally, there is some suggestion that SNP density varies along chromosomes (Venter et al. 2001), and explanations have been put forward based on variation in GC-content or in the efficiency of DNA mismatch repair.
It has been estimated that >5 million common SNPs, each with a frequency varying from 10% to 50%, account for the bulk of human DNA sequence difference. Alleles making up blocks of such SNPs in close physical proximity are often correlated and define a limited number of SNP haplotypes, each of which reflect descendence from a single, ancient ancestral chromosome. New haplotypes are formed by additional mutations, or by recombination when the maternal and paternal chromosomes exchange corresponding segments of DNA, resulting in a chromosome that is a mosaic of the two parental haplotypes. The coinheritance of SNP alleles on these haplotypes leads to associations between these alleles in the population, known as linkage disequilibrium, LD (Patil et al. 2001).
The strong associations between SNPs in a region have a practical value, this is, genotyping only few, carefully chosen in the region, will provide enough information to understand the remainder of the common SNPs in that region. As a result, only a few of these ‘tag’ SNPs are required to identify each of the common haplotypes in a region (International HapMap Consortium 2003, 2005). On the basis of empirical studies, it has been estimated that most of the information about genetic variation represented by the 10 million common SNPs in the population could be provided by genotyping 200,000 to 1,000,000 tag SNPs across the genome (International HapMap Consortium 2003, 2005). For common SNPs, which tend to be older than rare SNPs, the patterns of LD largely reflect historical recombination and demographic events. Some recombination events occur repeatedly at “hotspots”. The result of these processes is that current chromosomes are mosaics of ancestral chromosome regions. This explains the observations that haplotypes and patterns of LD are shared by apparently unrelated chromosomes within a population and generally among populations (International HapMap Consortium 2003, 2005; Gray et al. 2000).