Describe all or just a few? The influence of verbal descriptors
on Likert-type variables on items’ and scales’ distribution
Teresa Calapez
1, Madalena Ramos
2e Maria do Carmo Botelho
3A influência das âncoras na distribuição estatística de itens e escalas tipo-Likert Resumo: Pretende-se com este estudo avaliar em que medida a utilização de itens tipo-Likert ancorados em todos os pontos ou apenas nos extremos se traduz em resultados diferentes. Para o efeito foi pedido aos participantes que indicassem o seu nível de concordância com 18 afirmações relativas a crenças acerca da Matemática, usando um de dois formatos: 5 pontos todos etiquetados ou apenas os extremos etiquetados. Encontrou-se uma tendência para respostas mais extremadas neste último formato. Todavia, estas diferenças não são significativas quando se consideram as escalas obtidas por soma dos respetivos itens teoricamente definidos, exceto quando a assimetria é muito acentuada.
Palavras-chave: Medição de atitudes, Itens tipo-Likert, Escalas de Likert, Descritores verbais.
Abstract: The aim of this study is to examine whether and how the use of verbal descriptors at all categories or just at the extremes of 5-point Likert-type items influences the results. Each participant was requested to mark his/her level of agreement with 18 items concerning beliefs on mathematics, using one of the following forms: with verbal descriptors at all categories or just at the extremes. Respondents were found to use more intensively the extreme categories when only these were verbally described. However, these differences were not significant when using summated scales, except in case of severe skewness. Keywords: Attitude measurement, Likert items, Likert scales, verbal descriptors.
Introduction
Since 1932, when Likert proposed a summated scale for the assessment of survey respondent’s attitudes, where individual items had five response alternatives (strongly approve, approve, undecided, disapprove, and strongly disapprove), several
1 Instituto Universitário de Lisboa (ISCTE-IUL), Business Research Unit (BRU-IUL) Av. das Forças Armadas,
s/n, 1649-026 Lisboa, Portugal. [email protected].
2 Instituto Universitário de Lisboa (ISCTE-IUL), Centro de Investigação e Estudos de Sociologia (CIES-IUL).
Av. das Forças Armadas, s/n, 1649-026 Lisboa, Portugal. [email protected].
3 Instituto Universitário de Lisboa (ISCTE-IUL), Centro de Investigação e Estudos de Sociologia (CIES-IUL).
disciplines (Education, Psychology, Sociology, Marketing, Management, Health Care, and so on) use this kind of measurement tool.
At roughly the same time the debate on the use of items of this kind commenced and it has been a constant ever since. Many researchers look for an answer to questions on the form of the variables: What is the best item format? How many points should it have? Should there be an odd or even number? Should a ll the points have verbal descriptors or just some?
The ideal number of points for each item has never been established. Many studies have tried to find the most reliable scale by studying the relationship between the number of response categories and internal consistency, but the results have been inconsistent (Jacoby and Matell 1971; Aiken 1983; Alwin and Krosnick 1991; Chang 1994; Alwin 1997; Preston and Colman 2000; Dawes 2008; Weijters et al. 2010; Leung 2011; Wakita et al. 2012).
In connection with the question of the ideal number of points, various studies discuss the pertinence of placing a middle point (Presser and Schuman 1980; Kalton
et al. 1980, cited by Moors 2007; Bishop 1987; Adelson and McCoach 2010; Weijters et al. 2010).
A slightly different question, also very present in research concerning Likert-type items, is whether we should provide verbal descriptors for all categories or just for the extreme (and possibly the middle ones) (Lam and Klockars 1982; Dixon et al. 1984; Newstead and Arnold 1989; Alwin and Krosnick 1991; Krosnick and Berent 1993; Krosnick 1999; Landrum 1999; Weng 2004; and Cummins and Gullone 2000; Weijters et al. 2010; Moors et al. 2014).
None of these questions are consensual but we believe that divergences on results using Likert-type items may be overcome by the type of processing the researcher is willing to conduct. Generally speaking, the researcher can decide a priori whether the items themselves are to be subjected to some sort of (possibly multivariate) analysis or only summated scales, defined theoretically, will undergo statistical analysis.
This study adds another dimension to the discussion on Likert-type items and scales as it explicitly compares the labelling effect over single item analysis on one hand, and over theoretically defined scales built by summing up these same items, on
the other. If this effect, as we expect, is less intense while working with summated scales, then researchers should be more cautious with the layout of their questionnaire, in case they intend to conduct any statistical analysis over single items.
Our purpose is to compare the distributions of responses using all-labeled as against extreme-only labeled items. We will present the results comparing the responses item by item and also analyzing the scales obtained by the sum of the respective items theoretically defined.
In an item by item analysis the distribution shape will be compared among the four presentations; normality, skewness and Kurtosis indicators will be calculated; chi-square independence test (χ2), two-proportion z-test and parametric tests will be applied. Shape, reliability and location measures will be calculated and compared on the analysis at scale-level.
It is expected to find differences when comparing the distributions of responses (using all-labeled versus extreme-only labeled items), item by item but not in the scale theoretically defined.
Our aim is to alert researchers who use Likert-type items to measure perceptions, representations or attitudes to i) the possibility that the response distributions may be different and could lead to different conclusions, depending on the responses proposed, and ii) the need for deciding a priori what kind of analyses are expected to be conducted.
Background
In the literature, we can easily find recommendations ranging from 2 or 3 categories (Jacoby and Matell 1971) to 10 (Preston and Colman 2000) or 11 (Alwin 1997; Leung 2011). Some of these studies conclude that this has no effect on the internal consistency (Jacoby and Matell 1971; Aiken 1983) or even that there is no major difference in internal structure in terms of means, standard deviation, correlations or factor-loadings (Leung 2011), while others state that reliability and/or results are affected by the number of response categories (Alwin and Krosnick 1991; Chang 1994; Alwin 1997; Dawes 2008) and this leads to different recommendations. More recently Wakita et al. (2012) concluded that the number of options influenced
the psychological distance between options, which puts into question the most important assumption when using Likert type-items - the equality of the psychological distance between response options.
Regarding the pertinence of placing a middle point, there is a conviction that when a middle point is offered it will frequently be chosen. Moors (2007) contradicts this idea. He focuses his research on the link between the respondent’s behavior (namely the tendency to pick the extremes) and the number of response categories. He compares the answers obtained in a five-category per item questionnaire (offering a middle “neutral” position) with those from one with six categories per item. A confirmatory factor analysis revealed more similarities than differences between the two versions of the questionnaire. However, some studies (Alwin and Krosnick 1991; Weijters et al. 2010; Adelson and McCoach 2010) concluded that offering middle alternatives (at least in shorter response forms) increases the internal reliability and provides less model misfit than the format with no middle point. Once again, there is no consensus.
A similar situation occurs with the analysis of verbal descriptors. Lam and Klockars (1982) suggest that the relationship between items with all five intermediate points labeled and those with only the endpoints labeled produce similar results if the response labels are recognized as equally spaced. In the same direction, Landrum (1999) and Cummins and Gullone (2000) found no differences between variables in which all points were labeled and those in which only the end points were labeled. With a different perspective, Dixon et al. (1984), Newstead and Arnold (1989), Landrum (1999) and Cummins and Gullone (2000) found no differences between variables in which all points were labeled and those in which only the end points were labeled. Apparently, labeling all the points or just the extremes did not induce significant differences and does not influence scale reliability. However, Dixon et al. (1984) found a significant difference in the variability of individual items in each scale, with a larger standard deviation in extreme-only labeled items. Krosnick also states in a number of studies (Alwin and Krosnick 1991; Krosnick and Berent 1993; Krosnick 1999) that full specification of response options improves reliability of scales. In a more recent study, Weijters et al. (2010) found evidence to say that
labelling all response categories leads to higher levels in terms of central tendency, lower levels of spread and lower internal consistency. Moors et al. (2014) also found that labeling only the extreme categories evokes more an extreme response style than the full labelling.
Our everyday research practice suggests also that the decision on labeling all points of the scale or only the extremes relates to different factors. Some are more conceptual, concerning, for instance, the characteristics of the target audience; others are more practical, involving questionnaire formatting issues (condensation of the questionnaire to maximize the space, visual or aesthetic issues…). We hope that the present work brings some enlightenment, especially in this latter case, preventing researchers from using extreme-labelled items solely on layout reasons.
Methods
Participants
The target population of the study consists of first-time first-year students on various degree courses (social sciences courses – anthropology, political science, economics, history, psychology, sociology; management courses – management, finance, marketing, human resources management, management and industrial engineering; technological sciences courses – computer engineering, computer science and management, telecommunications and computer engineering) at a public university institution. Questionnaires were applied over a month long period at the very beginning of the winter semester.
The ages of the 727 participants range between 16 and 56 years, the average being 20.9 years (SD=6.7) and the most frequent 18. The majority of students are female (52.1%), with a high-school background of science and advanced mathematics (71%), though an even higher percentage had either basic or advanced mathematics teaching up to university entrance (91.4%). Almost half of the students are enrolled in social science courses (45.8%), while 39.3% are enrolled in management courses and 14.9% in technology courses; this clearly reflects the profile of the university’s undergraduate population.
Materials and Procedure
This study is part of a wider project of representations and beliefs relating to mathematics (Botelho, Calapez and Ramos 2011; Calapez, Botelho, and Ramos, 2011; Botelho, Calapez, and Ramos, 2012; Ramos e Carvalho, 2011). Accordingly, the items and scales used refer directly to this subject. Among the instruments most commonly used to measure beliefs about mathematics we find the scales developed by Fennema and Sherman (1976), which were designed to measure attitudes towards the learning of mathematics by males and females (Fennema-Sherman Mathematics Attitudes Scales – FSMAS), and those proposed by Kloosterman and Stage (1992) (Indiana Mathematics Belief Scales - IMBS).
More specifically, we applied: i) a reworded subset of the Fennema-Sherman (1976) Mathematics as a Male Domain Scale created to measure the degree to which students see this subject as a male, neutral or female domain; ii) the Importance of
Understanding Concepts in Mathematics Scale proposed by Kloosterman and Stage
(1992), and iii) the Mathematics Usefulness Scale designed to measure students’ beliefs about the usefulness of mathematics at the present moment and in their future, as modified by Kloosterman and Stage (1992) (Table 1).
There were four types of questionnaire (A, B, C and D). In this paper we will focus exclusively on a comparison between Types C and D4. The 18 items were randomly ordered beforehand and presented in the same order in both cases. Responses were given differently:
Type A: 5cm long-line, extreme-labelled, with a middle mark;
Type B: using a 5cm long-line, extreme-labelled, with no middle mark;
Type C (Likert_all): using five-point, all-labeled items (1-completely disagree, 2-disagree, 3-neither agree nor disagree, 4-agree and 5-completely agree);
Type D (Likert_extremes): using five-point, extreme-only labeled, Likert-type items (1-completely disagree and 5-completely agree, respectively).
4 Consequently, a subsample of 364 students was considered. The main characteristics described above remain
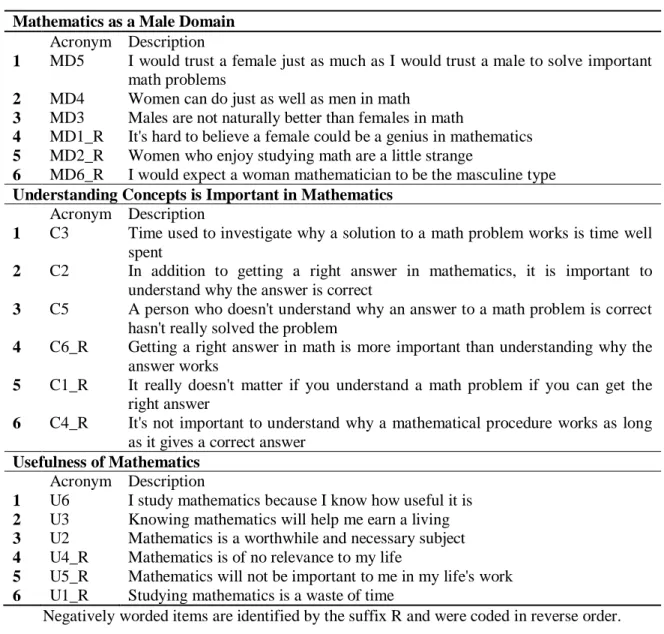
Table 1 - Items by scale
Mathematics as a Male Domain Acronym Description
1 MD5 I would trust a female just as much as I would trust a male to solve important
math problems
2 MD4 Women can do just as well as men in math
3 MD3 Males are not naturally better than females in math
4 MD1_R It's hard to believe a female could be a genius in mathematics
5 MD2_R Women who enjoy studying math are a little strange
6 MD6_R I would expect a woman mathematician to be the masculine type
Understanding Concepts is Important in Mathematics Acronym Description
1 C3 Time used to investigate why a solution to a math problem works is time well
spent
2 C2 In addition to getting a right answer in mathematics, it is important to
understand why the answer is correct
3 C5 A person who doesn't understand why an answer to a math problem is correct
hasn't really solved the problem
4 C6_R Getting a right answer in math is more important than understanding why the
answer works
5 C1_R It really doesn't matter if you understand a math problem if you can get the
right answer
6 C4_R It's not important to understand why a mathematical procedure works as long
as it gives a correct answer Usefulness of Mathematics
Acronym Description
1 U6 I study mathematics because I know how useful it is
2 U3 Knowing mathematics will help me earn a living
3 U2 Mathematics is a worthwhile and necessary subject
4 U4_R Mathematics is of no relevance to my life
5 U5_R Mathematics will not be important to me in my life's work
6 U1_R Studying mathematics is a waste of time
Negatively worded items are identified by the suffix R and were coded in reverse order.
In all scales, half of the items were positively worded, with the others being written in a negative manner. Thus, negatively worded items were reversed, so higher values reveal: i) less agreement with Mathematics as a Male Domain; ii) greater agreement with the
Understanding Concepts is Important in Mathematics and iii) greater agreement with the Usefulness of Mathematics.
Questionnaires were applied systematically in each class, so that an approximate number of each type was obtained (Table 2). There is no statistical evidence to suggest that the groups are not homogeneous with regard to gender (χ2(1)=0.057, p = 0.811), age
group (χ2(5)=5.788, p = 0.327) or course field (χ2(2)=0.133, p = 0.935). Thus, differences in response distributions between types of questionnaire should be related to alternative presentations of the items.
Table 2 - Frequency distribution of questionnaire type
Questionnaire type Description N %
C – Likert_all Five-point items, all labeled 187 51.4
D – Likert_extremes Five-point items, labels on first and last points 177 48.6
Total 364 100.0
Responses were compared at two levels: item by item using shape measures, χ2 and two-proportion z-tests, and with a comparison of the structures of the summated scales theoretically defined. In order to compare structures obtained from different sets of students, the internal consistency was measured using Cronbach’s alpha; in order to compare distribution shapes, two-sample Kolmogorov-Smirnov tests and Mann-Whitney tests were applied; finally, to assess whether the means of the groups are significantly different from each other, t-tests were computed.
Results
Item-level analysis
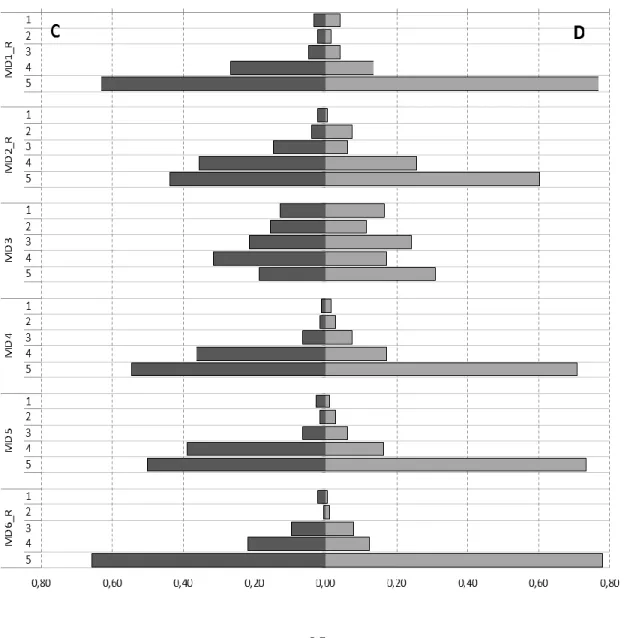
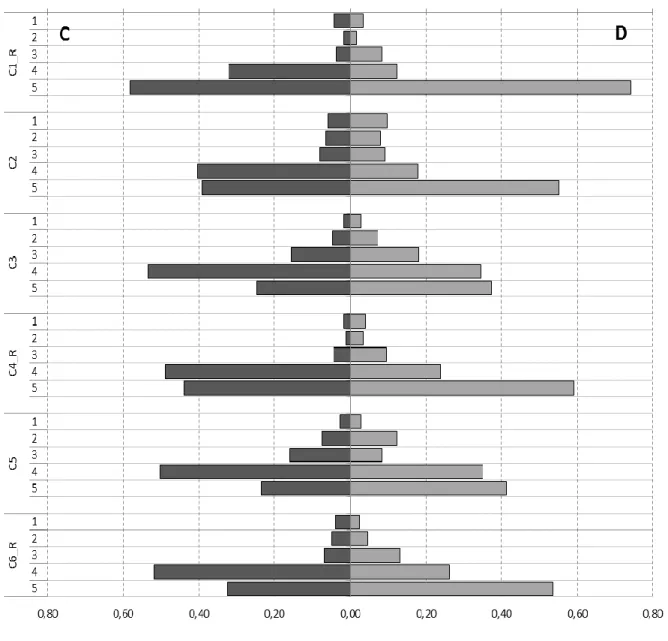
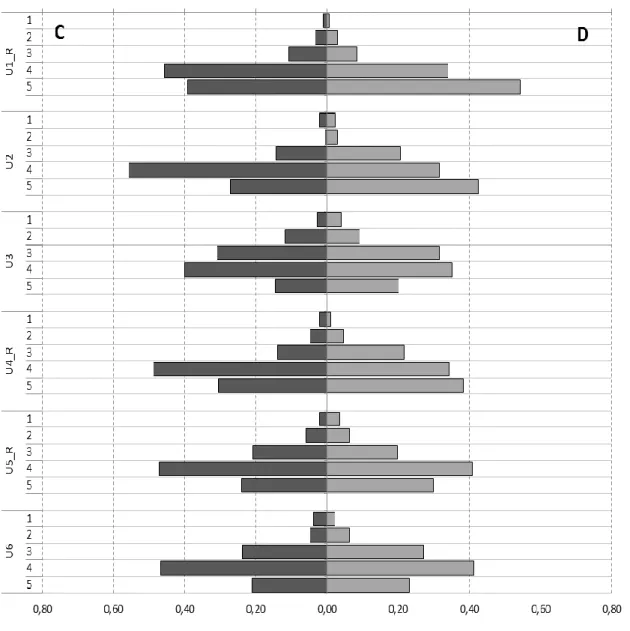
As can be seen in Figures 1A, 1B and 1C, most of the items display highly skewed distributions on both questionnaire types, with responses concentrated in the last two categories. This is particularly true for the Mathematics as a Male Domain items, though it can also be observed in the distribution of the Usefulness of Mathematics items, which appear, nevertheless, to be the least skewed of the three (coefficients in Table 3). In other words, the general trend is for a fairly extreme position (of agreement) about the usefulness of mathematics and the importance of their understanding and even more extreme (of disagreement) with regard to mathematics as a male domain. The reasons for this response behavior will not be discussed here.
Despite the similarities between the two types of questionnaires, with regard to skewness, however, in an item-by-item analysis, and from a descriptive perspective, it is clear that,
when descriptors for all categories were provided (type C), respondents tended to use the last category available less frequently (5) (Figures 1A, 1B and 1C). For example, if we compare the items related to Mathematics as a male domain, in the questionnaire C the response rates on the last point scale (strongly disagree) are situated between 18.7% ('Males are not naturally better than females in math') and 65.8% ('I would expect a woman mathematician to be the masculine type'), while in the questionnaire D values vary between 30.9% and 78% (for the same items).
Figure 1A - Frequency distribution for all items on Mathematics as a Male Domain scale, by questionnaire type
Figure 1B - Frequency distribution for all items on Understanding Concepts is
Figure 1C - Frequency distribution for all items on Usefulness of Mathematics scale, by questionnaire type
However, for the Usefulness of Mathematics items, only 2 out of 6 items (U1_R and U2, which are the scale’s most skewed items, cf. Table 3) showed significant differences between types of questionnaires in the proportions of “5s”, as can be seen in Table 4.
Table 3 - Coefficients of Skewness per item, by questionnaire type
C - Likert all D - Likert extremes
Skewness Skewness
/S.E. Skew
Skewness Skewness /S.E. Skew Mathematics as a Male Domain
MD1_R -2.140 -12.041 -2.626 -14.381 MD2_R -1.179 -6.599 -1.535 -8.386 MD3 -0.365 -2.055 -0.328 -1.785 MD4 -1.652 -9.298 -2.106 -11.472 MD5 -1.797 -10.058 -2.249 -12.317 MD6_R -2.002 -11.265 -2.322 -12.720
Understanding Concepts is Important in Mathematics
C1_R -2.120 -11.927 -2.238 -12.257 C2 -1.293 -7.257 -1.149 -6.239 C3 -0.974 -5.483 -0.898 -4.919 C4_R -1.698 -9.530 -1.674 -9.141 C5 -0.947 -5.330 -1.018 -5.576 C6_R -1.441 -8.064 -1.345 -7.324 Usefulness of Mathematics U1_R -1.160 -6.508 -1.405 -7.698 U2 -1.201 -6.756 -0.981 -5.326 U3 -0.412 -2.304 -0.468 -2.544 U4_R -1.082 -6.090 -0.746 -4.062 U5_R -0.802 -4.515 -0.883 -4.838 U6 -0.867 -4.867 -0.599 -3.282
Table 4 - z-Tests on the differences in the proportions of 5s by questionnaire type
z Sig
Mathematics as a Male Domain
MD1_R It's hard to believe a female could be a genius in mathematics 2.852 0.004
MD2_R Women who enjoy studying math are a little strange 3.125 0.002
MD3 Males are not naturally better than females in math 2.681 0.007
MD4 Women can do just as well as men in math 3.202 0.001
MD5 I would trust a female just as much as I would trust a male to
solve important math problems
4.532 0.000
MD6_R I would expect a woman mathematician to be the masculine type
2.581 0.010
Understanding Concepts is Important in Mathematics
C1_R It really doesn't matter if you understand a math problem if you can get the right answer
3.163 0.002
C2 In addition to getting a right answer in mathematics, it is
important to understand why the answer is correct
3.026 0.002
C3 Time used to investigate why a solution to a math problem
works is time well spent
2.622 0.009
C4_R It's not important to understand why a mathematical procedure works as long as it gives a correct answer
2.855 0.004
C5 A person who doesn't understand why an answer to a math
problem is correct hasn't really solved the problem
3.617 0.000
C6_I Getting a right answer in math is more important than understanding why the answer works
4.079 0.000
Usefulness of Mathematics
U1_R Studying mathematics is a waste of time 2.862 0.004
U2 Mathematics is a worthwhile and necessary subject 3.044 0.002
U3 Knowing mathematics will help me earn a living 1.383 0.167
U4_R Mathematics is of no relevance to my life 1.564 0.118
U5_R Mathematics will not be important to me in my life's work 1.264 0.206
U6 I study mathematics because I know how useful it is 0.505 0.614
Negatively worded items are identified by the suffix R and were coded in reverse order.
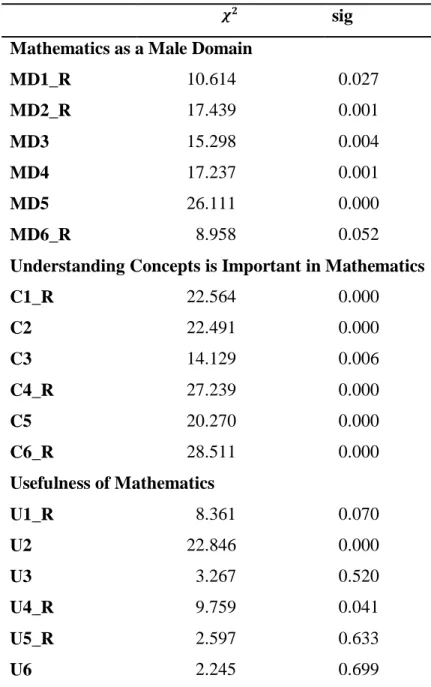
The relationship between each item and the two types of questionnaire applied was also tested using an chi-square independence test. As expected, significant differences were found, showing the existence of an influence by the questionnaire type (Table 5). Of the eighteen items tested, thirteen (almost three quarters) revealed an association, at a 5%
level, with the questionnaire type. From those thirteen, only two (U2 and U4_R) belong to the Usefulness of Mathematics Scale.
Table 5 - Chi-square independence tests for an association between item distribution and questionnaire type
𝝌𝟐
sig Mathematics as a Male Domain
MD1_R 10.614 0.027 MD2_R 17.439 0.001 MD3 15.298 0.004 MD4 17.237 0.001 MD5 26.111 0.000 MD6_R 8.958 0.052
Understanding Concepts is Important in Mathematics
C1_R 22.564 0.000 C2 22.491 0.000 C3 14.129 0.006 C4_R 27.239 0.000 C5 20.270 0.000 C6_R 28.511 0.000 Usefulness of Mathematics U1_R 8.361 0.070 U2 22.846 0.000 U3 3.267 0.520 U4_R 9.759 0.041 U5_R 2.597 0.633 U6 2.245 0.699
Scale-level analysis
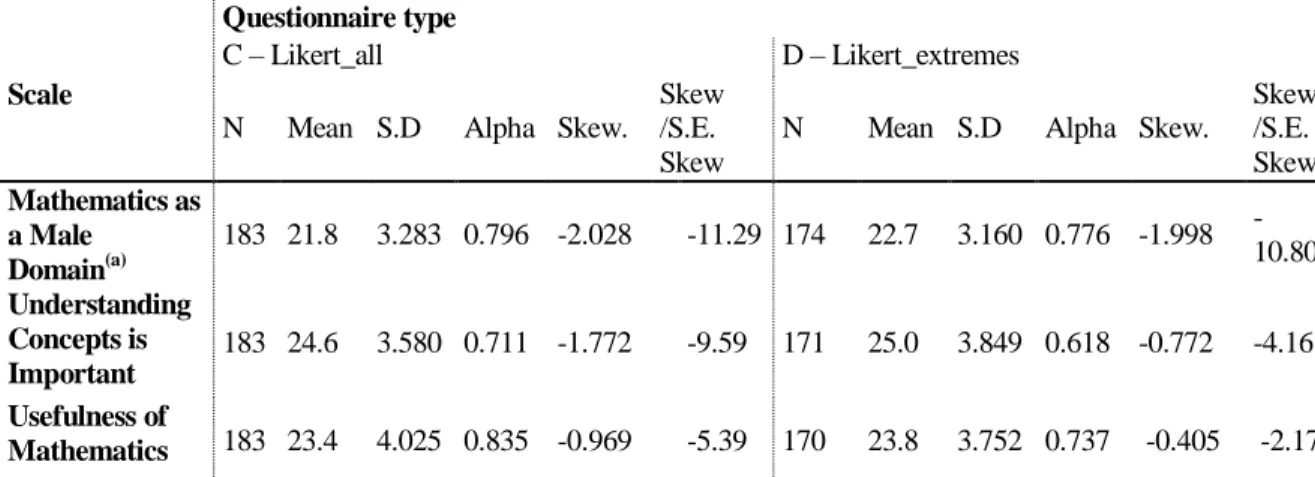
In a scale-level analysis, a reliability study was performed in the first place. As can be seen in Table 6, Cronbach-α values obtained were fairly high, ranging from 0.618 (Understanding Concepts is Important in Mathematics, type D questionnaire) to 0.835 (Usefulness of Mathematics, type C questionnaire). These values are similar to those obtained by other authors in previous studies (Fennema and Sherman 1976; Kloosterman and Stage 1992; Mulhern and Rae 1998; Mason, 2003).
The distributions summarized can be considered as severely skewed (Table 6). This is particularly relevant in the Mathematics as a Male Domain scale, which displays a ratio (skewness/standard error) above ten, though also in all other scales. The least skewed distribution, which refers to the Usefulness of Mathematics scale from questionnaire type D, displays a much lower ratio (skewness/standard error), though it is still above the usual threshold of two.
Table 6 - Reliability and asymmetry analysis
Questionnaire type
C – Likert_all D – Likert_extremes Scale
N Mean S.D Alpha Skew. Skew /S.E. Skew
N Mean S.D Alpha Skew.
Skew. /S.E. Skew Mathematics as a Male Domain(a) 183 21.8 3.283 0.796 -2.028 -11.29 174 22.7 3.160 0.776 -1.998 -10.80 Understanding Concepts is Important 183 24.6 3.580 0.711 -1.772 -9.59 171 25.0 3.849 0.618 -0.772 -4.16 Usefulness of Mathematics 183 23.4 4.025 0.835 -0.969 -5.39 170 23.8 3.752 0.737 -0.405 -2.17
(a) The item MD3 – Males are not naturally better than females in mathematics – was found to be inconsistent and was excluded from the scale.
In order to test differences in scale behavior, induced by different questionnaire types, several procedures were applied: differences in shape were tested using both the two-sample Kolmogorov-Smirnov test and the Mann-Whitney test; differences in the means were tested using the two independent samples t-test. Due to the rather severe skewness
of some of the distributions (Figure 2 and Table 6), namely on the Mathematics as a Male
Domain Scale, t-tests results should be interpreted cautiously.
Figure 2 - Percentage histogram for each scale, by questionnaire type
C – Likert_all D – Likert_extremes Ma th em atics a s a Ma le Do m ain Ma th em atics a s a Ma le Do m ain % % Un d er stan d in g C o n ce p ts is I m p o rtan t in Ma th em atics Un d er stan d in g C o n ce p ts is I m p o rtan t in Ma th em atics % % Usef u ln ess o f Ma th em atics Usef u ln ess o f Ma th em atics % %
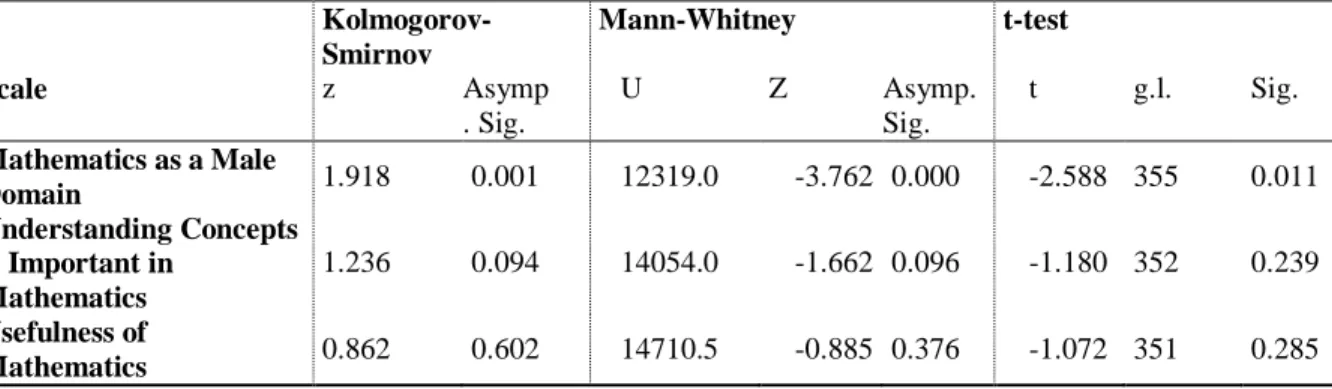
All tests lead to the same results: significant differences between the two types of questionnaire can only be found in the Mathematics as a Male Domain Scale (Table 7). For the items in that scale, differences found in the distributions are strong enough to induce different behaviors in the summated scale. That is, whether we compare the shapes of the distributions or the mean values, the conclusions will be different depending on the type of questionnaire, with a trend toward greater disagreement when only the extremes were labeled (C: Mean = 4.37 SD = 0.650, D: Mean = 4.54 SD = 0.627). However, despite the statistically significant difference, the effect size is very small (Eta2 = 0.017).
With the Understanding Concepts is Important in Mathematics although individually all six items showed a significant and more intense use of the last category in the questionnaire of type D than in that of type C, the behavior of this scale is similar in both types. As for the Usefulness of Mathematics Scale, no differences in shape or mean were found when the two questionnaire types were compared. This result is not surprising due to i) the similar behavior of the majority of items in the two samples and ii) the magnitude of the Cronbach’s alphas obtained.
Table 7 - Tests for differences between type C and type D questionnaires
Kolmogorov-Smirnov Mann-Whitney t-test Scale z Asymp . Sig. U Z Asymp. Sig. t g.l. Sig. Mathematics as a Male Domain 1.918 0.001 12319.0 -3.762 0.000 -2.588 355 0.011 Understanding Concepts is Important in Mathematics 1.236 0.094 14054.0 -1.662 0.096 -1.180 352 0.239 Usefulness of Mathematics 0.862 0.602 14710.5 -0.885 0.376 -1.072 351 0.285 General Discussion
This study conducted an experiment with first-time first-year undergraduates on various courses (social sciences, management, and technological sciences). There were two types of questionnaire: 5-point all-labeled Likert-type items; and 5-point extreme-only labeled Likert-type items, systematically assigned in each class.
The main goal was to compare results obtained with the two types of questionnaire in order to discover if different presentations of Likert-type items lead to different response distributions in an item-by-item analysis and in a scale level analysis.
An item-level analysis allowed us to conclude that individual distributions of responses differ according to the presentation of Likert-type items. Most of the items presented highly skewed distributions, with a concentration of responses in the last two categories. Nevertheless the two proportions z-test revealed a significantly higher proportion of responses on the last point (5) for the group where only the extreme categories had verbal descriptors, i.e., the type D questionnaire. Chi-square independence tests also confirmed this relationship between the distributions and the type of questionnaire applied. In almost three quarters of the items tested the results were significant.
In summary, the use of items with only the extremes labeled originates levels of disagreement (Mathematics as a male domain) and agreement (Usefulness of
Mathematics and Understanding Concepts is Important in Mathematics) higher than
labelling all points. There seems to be a shift when only the extremes are labeled to the last point motivated by the need to associate a verbal descriptor to the point in order to clarify its meaning. This goes in the same direction as the results found by Weijters et al., (2010) and Moors et al. (2104). As Christian et al. (2009, pp: 421) note, “it is clear that the visual attributes of scalar questions also influences answers and cannot be ignored”.
At the scale level, the reliability analysis revealed a high consistency for all scales, similar to those obtained in previous studies by other investigators mentioned.
Differences in shape between the two types of questionnaire were tested using the two-sample Kolmogorov-Smirnov and Mann-Whitney tests. Both tests led to the same conclusions: significant differences were only found in the Mathematics as a Male
Domain Scale. This was also the only scale for which the independent t-test showed
significant differences between the means. It should be noted that this scale has the highest asymmetry, which means that we found some evidence that the response format may lead to different results in cases of very high asymmetries.
Since 1932, when Likert proposed a summated scale for the assessment of survey respondents’ attitudes, there has been no consensus on how to analyze and compare the
responses to individual Likert-type items. Some propose (e.g., Jamieson 2004) restricting the statistical analysis to non-parametric techniques (e.g., 𝜒2tests, Mann-Whitney-Wilcoxon U tests or the Kruskal-Wallis analysis of variance), while others (e.g., Carifio and Perla 2007) see nothing wrong with the use of parametric statistical procedures (e.g., t-tests or analysis of variance F-tests, regression, cluster analysis).
This study adds another dimension to this discussion. Even before establishing the statistical methods and techniques to be used, the researcher should decide whether he or she wants to perform the analysis on single items or on theoretically defined scales only. In the former, the results suggest that differences in response formats account for differences in distribution, with higher prevalence of the use of extreme categories when these are the only categories labeled. In the latter case, different presentations of the response to individual items give rise, in general, to similarly distributed scales. In our study, the exception was the Mathematics as a Male Domain scale, which is formed by items that may induce socially desirable responses and, thus, also induce the almost exclusive use of half the categories. In order to generalize these results it would be interesting to carry out similar studies in different contexts less prone to socially desirable responses. Nevertheless, we firmly believe that verbally describing each category clarifies the inherent social meaning, which in turn permits greater variability in the responses.
The consistent trend in developments in multivariate statistical methods and software availability has brought a wide choice for item-level analyses, even when the final goal is to obtain a composite summarizing index. Interdependency methods, such as factor analysis and principal component analysis are often used in this context. Extensions of the latter, which may include both metric and non-metric variables, are becoming common. It is within this framework that our current line of investigation fits – that is, the impact that different response presentations for a set of items have on the (low-dimensional) space structured by those items. We already have plans for future articles on the topic.
References
Adelson, J.L., and McCoach, D.B. (2010), “Measuring the Mathematical Attitudes of Elementary Students, The Effects of a 4-Point or 5-Point Likert-Type Scale”,
Educational and Psychological Measurement, 70, 796-807.
Aiken, L.R. (1983), “Number of response categories and statistics on a teacher rating scale”, Educational and Psychological Measurement, 43, 397-401.
Alwin, D.F. (1997), “Feeling Thermometers Versus 7-Point Scales, Which are Better?”,
Sociological Methods & Research, 25, 318-340.
Alwin, D.F., and Krosnick, J.A. (1991), “The reliability of survey attitude measurement: the influence of question and respondent attributes”, Sociological Methods &
Research, 20, 139-181.
Bishop, G. F. (1987), “Experiments with the middle response alternative in survey questions”, Public Opinion Quarterly, 51, 220-232.
Botelho, M.C., Calapez, T., and Ramos, M. (2011), “The effect of shape, comparing different presentations of response”, Proceedings of the 58th World Statistics
Congress of the International Statistical Institute (ISI 2011).
Botelho, M.C., Calapez, T., and Ramos, M. (2012), “O efeito do formato das respostas no tratamento de itens e escalas tipo Likert”, in Atas do VII Congresso Português de
Sociologia, Lisboa. APS.
Calapez, T., Botelho, M.C., and Ramos, M. (2011), “Comparing the linear and non-linear Principal Component Analysis over Likert-type items, an empirical study based on balanced bootstrap”, Proceedings of the 58th World Statistics Congress of the
International Statistical Institute (ISI 2011).
Carifio, J., and Perla, R.J. (2007), “Ten Common Misunderstandings, Misconceptions, Persistent Myths and Urban Legends about Likert Scales and Likert Response Formats and their Antidotes”, Journal of Social Sciences, 3(3), 106-116.
Chang, L. (1994), “A psychometric evaluation of 4-point and 6-point Likert-type scales in relation to reliability and validity”, Applied Psychological Measurement, 18, 205-215.
Christian, L.M., Parsons, N. L., and Dillman, D.A. (2009), “Designing Scalar Questions for Web Surveys”, Sociological Methods & Research, 37, 393-425.
Clason, D.L., and Dormody, T.J. (1994), “Analyzing data measured by individual Likert-type items”, Journal of Agricultural Education, 35(4), 31-35.
Cummins, R.A., and Gullone, E. (2000), “Why we should not use 5-point Likert scales: The case for subjective quality of life measurement”, Proceedings, Second
International Conference on Quality of Life in Cities, Singapore, 74-93.
Dawes, J. (2008), “Do data characteristics change according to the number of scale points used? An experiment using 5-point, 7-point and 10-point scales,” International
Journal of Market Research, 50, 61-77.
Dittrich, R., Francis, B., Hatzinger, R., and Katzenbeisser, W. (2007), “A paired comparison approach for the analysis of sets of Likert-scale responses”, Statistical
Modelling, 7, 3-28.
Dixon, P.N., Bobo. M., and Stevick, R.A. (1984), “Response differences and preferences for all-category defined and end-defined Likert formats”, Educational and
Psychological Measurement, 44, 61-66.
Fennema, E., and Sherman J.A. (1976), “Fennema-Sherman mathematics attitudes scales, instrument designed to measure attitudes toward mathematics”, Journal for Research
in Mathematics Education, 7, 324-326.
Gob, R., McCollin, C., and Ramalhoto, M.F. (2007), “Ordinal methodology in the analysis of Likert Scales”, Quality & Quantity, 41, 601-626.
Hasson, D., and Arnetz, B.B. (2005), “Validation and findings comparing VAS vs. Likert scales for psychosocial measurements”, International Electronic Journal of Health
Education, 8, 178-192.
Jacoby, J., and Matell M.S. (1971), “Three-point Likert scales are good enough”, Journal
of Marketing Research, 8(4), 495-500.
Jamieson, S. (2004), “Likert scales: how to (ab)use them”, Journal of Medical Education, 38(12), 1217-1218.
Kalton, G., Roberts, J., and Holt, D. (1980), “The effects of offering a middle response option with opinion questions”, The Statistician, 29(1), 65-78.
Kloosterman, P., and Stage, F.K. (1992), “Measuring beliefs about mathematical problem solving”, School Science and Mathematics, 92, 109-115.
Krabbe, P.F., Stalmeier, P.F., Lamers, L.M., and Busschbach, J.J. (2006), “Testing the interval-level measurement property of multi-item visual analogue scales”, Quality of
Life Research, 15(10), 1651-1661.
Krosnick , J.A. (1999), “Survey Research”, Annual Review of Psychology, 50, 537-67. Krosnick, J.A., and Berent, M.K. (1993), “Comparisons of party identification and policy
preferences, the impact of survey questions format”, American Journal of Political
Science, 37, 941-964.
Lalla, M., Facchinetti, G., and Mastroleo, G. (2004), “Ordinal scales and fuzzy set systems to measure agreement, an application to the evaluation of teaching activity”,
Quality & Quantity, 38(5), 577-601.
Lam, T.C.M., and Klockars J. (1982), “Anchor Point Effects on the Equivalence of Questionnaire Items”, Journal of Educational Measurement, 19(4), 317-322.
Landrum, R.E. (1999), “Scaling issues in faculty evaluations”, Psychological Report, 84, 178-180.
Leung, S. (2011), “A comparison of psychometric properties and normality in 4-, 5-, 6-, and 11-point Likert scales”, Journal of Social Service Research, 37(4), 412-421. Likert, R. (1966/1932), “The Method of Constructing an Attitude Scale”. Appendix of “A
Technique for the Measurement of Attitudes”. Archives of Psychology, 140 (Jun 1932), included in Martin E. Fishbein, ed. 1966. Readings in Attitude Theory and
Measurement. John Wiley & Sons. Inc, 90-95.
Mason, L. (2003), “High School Students' Beliefs About Maths, Mathematical Problem Solving, and Their Achievement in Maths, A cross-sectional study”, Educational
Psychology, 23(1), 73-85.
Moors, G., Kieruj, N.D., and Vermunt, J.K. (2014), “The effect of labeling and numbering of response scales onm the likelihood of response bias”. Sociological
Methodology. 44(1), 369-399.
Moors, G. (2007), “Exploring the effect of a middle response category on response style in attitude measurement”, Quality & Quantity, 42, 779-794.
Mulhern, F., and Rae G. (1998), “Development of a shortened form of the Fennnema-Sherman Mathematics Attitudes Scales”, Educational and Psychological
Newstead, S.E., and Arnold, J. (1989), “The effect of response format on ratings of teaching”, Educational and Psychological Measurement, 49, 33-43.
Presser, S., and Schuman, H. (1980),” The measurement of a middle position in attitude surveys”, Public Opinion Quarterly, 4, 70-85.
Preston, C.C., and Colman, A.M. (2000), “Optimal number of response categories in rating scales: reliability, validity, discriminating power, and respondent preferences”,
Acta Psychologica, 104, 1-15.
Ramos, M., and Carvalho, H. (2011), “Perceptions of quantitative methods in higher education: mapping student profiles”, Higher Education, 61(6), 629-647.
Svensson, E. (2000), “Comparison of the quality of assessments using continuous and discrete ordinal rating scales”, Biometrical Journal, 42, 417-434.
Wakita,T., Ueshima, N., and Noguchi, H. (2012), “Psychological Distance Between Categories in the Likert Scale. Comparing Different Numbers of Options”,
Educational and Psychological Measurement, 72, 533-546.
Weijters, B., Cabooter, E., and Schillewaert, N. (2010),” The effect of rating scale format on response styles, the number of response categories and response category labels”,
International Journal of research in Marketing, 27, 236-247.
Weng, L. (2004), “Impact of the number of response categories and anchors labels on coefficient alpha and test-retest reliability”, Educational and Psychological
Measurement, 64, 956-972.