ARTIGO ORIGINAL
RESUMO
Introdução: Portugal tomou cedo medidas para controlar a epidemia de COVID-19, impondo medidas de confinamento a partir de 16 de março, quando registava apenas 62 casos de COVID-19 por milhão de habitantes e nenhuma morte. Os portugueses seguiram as recomendações reduzindo sua mobilidade em 80%. O objectivo deste estudo foi estimar o impacto do confinamento em Portugal com foco na redução do impacto nos serviço de saúde.
Material e Métodos: Fizemos previsões para as curvas epidémicas de casos, internamento hospitalares (geral e em unidades de cuidados intensivos) e óbitos sem confinamento, assumindo que o impacto das medidas de contenção começaria 14 dias após o início das medidas. Utilizámos modelos de alisamento exponencial para óbitos, internados em cuidados intensivos e total de internados e um modelo ARIMA para número de novos casos. Os modelos foram selecionados considerando adequação aos dados observados até 31 de março de 2020. Em seguida, comparámos as curvas observadas (com intervenção) e previstas (sem intervenção).
Resultados: Entre 1 e 15 de abril houve 146 menos mortes (-25%), 5568 menos casos (-23%) e, em 15 de abril, houve 519 menos internamentos em unidades de cuidados intensivos (-69%) e 508 menos doentes no total de internados (-28%) do que o previsto sem confinamento. Em 15 de abril, o número de pacientes internados na unidades de cuidados intensivos poderia ter atingido 748, três vezes maior que o valor observado (229) se a intervenção tivesse sido adiada.
Discussão: Se o confinamento não tivesse sido implementado em meados de março, a capacidade de unidades de cuidados inten-sivos em Portugal (528 camas) teria provavelmente sido ultrapassada na primeira quinzena de abril. O confinamento parece ter sido eficaz na redução de infeções, doença grave e mortalidade associada, diminuindo a procura de serviços de saúde.
Conclusão: Um confinamento antecipado permitiu comprar tempo para o Serviço Nacional de Saúde mobilizar recursos e adquirir equipamentos de proteção individual, aumentar a capacidade de testar e realizar rastreio de contactos, preparar-se para um aumento da procura hospitalar e de unidades de cuidados intensivos e promover amplas medidas de prevenção e controlo. Ao levantar me-didas mais restritivas será importante manter uma vigilância epidemiológica e estratégias de comunicaçao robustas que mobilizem
Initial Assessment of the Impact of the Emergency State
Lockdown Measures on the 1
stWave of the COVID-19
Epidemic in Portugal
Avaliação Inicial do Impacto das Medidas de Confinamento
do Estado de Emergência na Primeira Onda da Epidemia de
COVID-19 em Portugal
1. Public Health Research Centre. NOVA National School of Public Health. Universidade NOVA de Lisboa. Lisboa. Portugal. 2. Public Health Unit. North Lisbon Health Centers. Lisbon. Portugal.
3. European Programme for Intervention Epidemiology Training (EPIET). European Centre for Disease Prevention and Control (ECDC). Stockholm. Sweden. 4. Unit for Multidisciplinary Research in Biomedicine. Abel Salazar Institute of Biomedical Sciences. Universidade do Porto. Porto. Portugal.
5. Communicable Disease Surveillance Centre. Public Health Wales. Cardiff. United Kingdom. Autor correspondente: Vasco Ricoca Peixoto. [email protected]
Recebido: 13 de maio de 2020 - Aceite: 31 de julho de 2020 | Copyright © Ordem dos Médicos 2020
Vasco RICOCA PEIXOTO1,2,3, André VIEIRA1, Pedro AGUIAR1, Carlos CARVALHO3,4, Daniel RHYS THOMAS3,5,
Alexandre ABRANTES1
Acta Med Port 2020 Nov;33(11):733-741 ▪ https://doi.org/10.20344/amp.14129 ABSTRACT
Introduction: Portugal took early action to control the COVID-19 epidemic, initiating lockdown measures on March 16th when it re-corded only 62 cases of COVID-19 per million inhabitants and reported no deaths. The Portuguese public complied quickly, reducing their overall mobility by 80%. The aim of this study was to estimate the initial impact of the lockdown in Portugal in terms of the reduction of the burden on the healthcare system.
Material and Methods: We forecasted epidemic curves for: Cases, hospital inpatients (overall and in intensive care), and deaths without lockdown, assuming that the impact of containment measures would start 14 days after initial lockdown was implemented. We used exponential smoothing models for deaths, intensive care and hospitalizations and an ARIMA model for number of cases. Models were selected considering fitness to the observed data up to the 31st March 2020. We then compared observed (with intervention) and forecasted curves (without intervention).
Results: Between April 1st and April 15th, there were 146 fewer deaths (-25%), 5568 fewer cases (-23%) and, as of April 15th, there were 519 fewer intensive care inpatients (-69%) than forecasted without the lockdown. On April 15th, the number of intensive care inpatients could have reached 748, three times higher than the observed value (229) if the intervention had been delayed.
Discussion: If the lockdown had not been implemented in mid-March, Portugal intensive care capacity (528 beds) would have likely been breached during the first half of April. The lockdown seems to have been effective in reducing transmission of SARS-CoV-2, se-rious COVID-19 disease, and associated mortality, thus decreasing demand on health services.
Conclusion: An early lockdown allowed time for the National Health Service to mobilize resources and acquire personal protective equipment, increase testing, contact tracing and hospital and intensive care capacity and to promote broad prevention and control measures. When lifting more stringent measures, strong surveillance and communication strategies that mobilize individual prevention efforts are necessary.
ARTIGO ORIGINAL
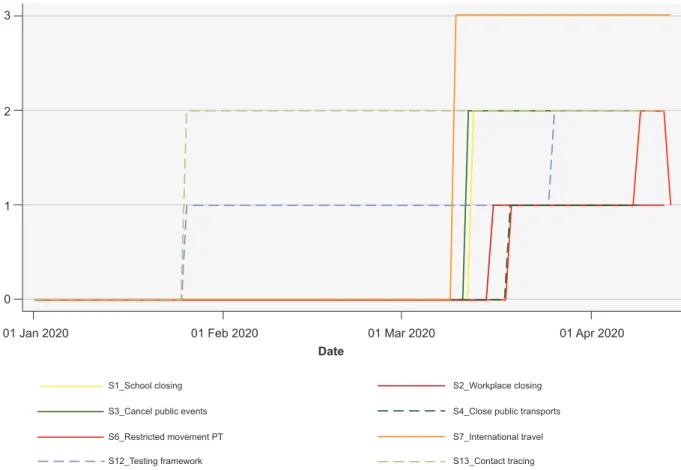
Figure 1 – Variation in selected indicators of the Oxford Government Response Stringency Index in Portugal, 2020. (Data source: COVID-19 Oxford Government Response Tracker)
01 Jan 2020 01 Feb 2020 01 Mar 2020
Date
01 Apr 2020
S1_School closing S2_Workplace closing S3_Cancel public events S4_Close public transports S6_Restricted movement PT S7_International travel S12_Testing framework S13_Contact tracing 0
1 2 3
INTRODUCTION
Since there is yet no vaccine or treatment for COVID-19, governments have used social and behavioral interventions to reduce spread of the virus in the community. Recent stu- dies suggest that these public health measures have had an impact. Whilst individual measures, (for example: con-tact tracing and isolation of cases and concon-tacts, wearing masks, movement restrictions and other measures to re-duce social contacts and physical proximity) have an im-pact,1 it has been suggested that only through a combined
set of measures can the spread of the virus be contained.2-5
The European Centre for Disease Prevention and Con-trol (ECDC), in the technical report “Strategies for Surveil-lance”,6 recommends that the effectiveness of containment
measures should be assessed at regular intervals by moni-toring intensity, and the impact on the healthcare system. The report stresses the importance of frequent, open and transparent communication with the public to explain these findings, in order for the population to accept and comply with the chosen mitigation measures over long periods of time.
Portugal took early action to control the COVID-19 epi-demic, imposing restrictions on economic activity and social life when there were only 62 cases of COVID-19 per million inhabitants and no COVID-19 deaths, a different
epidemio-logical situation compared to Spain, Italy and the United Kingdom, when equivalent measures were taken later in the course of the epidemic.7 International comparison of
the Stringency index, a summary score taken from 17 in-dicators of government responses compiled by the Oxford COVID-19 Government Response Tracker,8 indicates that
Portugal implemented in mid-March stringent containment and mitigation measures , including the cancellation of pub-lic events, school closures, workplaces, retail and leisure spaces closure and restriction of national and international movement.
As the Stringency index increased and lockdown was implemented, the Portuguese people complied with these confinement measures and quickly reduced their overall mobility, (Fig. 1). According to data published by Google9,10
and Apple7,11 the Portuguese people significantly reduced
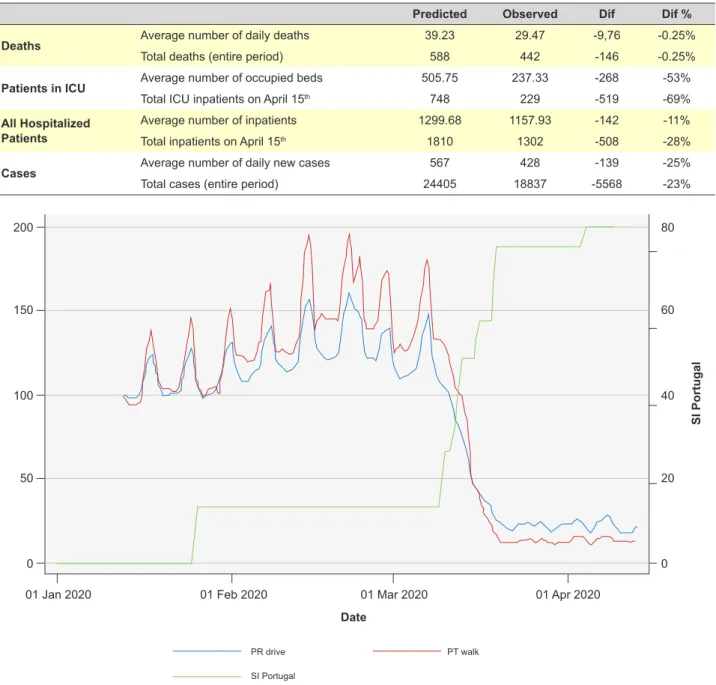
their daily mobility, including for retail and leisure (-83%), parks and alike (-80%) and transport (-79%) - Fig. 2.10 The
population in Spain also adhered effectively to government containment and mitigation measures. In Italy and the UK, on the other hand, there seems to have been slower reduc-tion in mobility as the Stringency index increased eventually reflecting a different communication and risk perception.7
In Portugal, 187 people died of COVID-19 in March
comportamentos individuais preventivos.
ARTIGO ORIGINAL
Table 1 – Predicted and observed values and absolute and relative differences for different COVID-19 indicators from April 1st to 15th
Predicted Observed Dif Dif %
Deaths Average number of daily deaths 39.23 29.47 -9,76 -0.25%
Total deaths (entire period) 588 442 -146 -0.25%
Patients in ICU Average number of occupied beds 505.75 237.33 -268 -53%
Total ICU inpatients on April 15th 748 229 -519 -69%
All Hospitalized Patients
Average number of inpatients 1299.68 1157.93 -142 -11%
Total inpatients on April 15th 1810 1302 -508 -28%
Cases Average number of daily new cases 567 428 -139 -25%
Total cases (entire period) 24405 18837 -5568 -23%
Figure 2 – Temporal trend in the Oxford Stringency Index (green) and mobility by car (blue) and walking (red) as defined by Apple Mobility, Portugal: January 13 to April 15.
(Data sources: COVID-19 Oxford Government Response Tracker; Apple COVID-19 Mobility Trens)
01 Jan 2020 01 Feb 2020 01 Mar 2020
Date SI Portugal 01 Apr 2020 PR drive PT walk SI Portugal 0 0 50 20 100 40 150 60 200 80
2020. This represents 2.3% of the 8521 confirmed cases, a cumulative incidence of around 80 cases per 100 000 in-habitants and a mortality rate of 2.3%.
In line with one of the ECDC strategies for surveillance of COVID-19 and the WHO COVID-19 strategy recommen-dations on research and knowledge sharing,12 the aim of
this study is to estimate the early direct health impact of the lockdown in Portugal, that is: on the number of COVID-19 cases, deaths and clinically severe cases (using number of hospital or intensive care unit beds occupied as a proxy indicator of serious disease).
MATERIAL AND METHODS
Data on the daily number of cases, deaths, and
preva-lent number cases in hospital and in intensive care (ICU) were collected from official, publicly available13 COVID-19
Situation Reports of Portugal’s Directorate-General of Health until April 15, 2020, and that data was also avai- lable through the ECDC (cases and deaths). For data on hospitalization and ICU attendance, occupied hospital beds (overall) and ICU beds, rather than new admissions, were used as indicators of prevalent hospitalized COVID-19 ca-ses since new admissions were not available.
We estimated the daily number of new COVID-19 ca-ses, COVID-19 associated deaths and beds occupied, both in hospitals (overall) and ICU in April 2020, that would have occurred without containment measures. This was car-ried out by forecasting values for April using exponential
ARTIGO ORIGINAL smoothing and ARIMA models selected based on fitness to the values recorded between March 1 and 31. Then, we
compared forecasted values of COVID-19 occupied beds both in ICU and hospital (overall) in each day with the ac-tual figures on April 15 (Table 1) as a cumulative measure. We used SPSS expert modeler to consider different types of exponential smoothing and ARIMA models for specific time-series,14 and find the best fitting models for each time
series until March 31. Forecasts were obtained with expo-nential smoothing models applied to the time series of daily deaths, hospitalized patients in ICU, and total number of hospitalized patients up to March 31. An ARIMA model was applied to the time-series of new cases, due to a better ad-justment of the model parameters shown in results, given by the SPSS expert modeler tool. All models had good adjust-ments to the time-series until March 31, as demonstrated by the results. The analysis was performed in SPSS 26 us-ing the approach described by B Tabachnich for traditional model forecast.15
We considered a delayed effect of lockdown starting 14 days after the initial lockdown measures (in March 16), tak-ing account of a fast increase in Strtak-ingency index and fast reduction in mobility of Portuguese population by mid-March (Fig. 2), as well as of evidence on the period from infection to onset of symptoms, to the detection of cases, hospitali-zation (general ward or intensive care unit), and death,16-18
and finally on previous time-series studies that report timing to impact of lockdown measures in different outcomes.19,20
As such, since reduction in mobility and contacts between citizens was effective in mid-March 2020 and R(t) reduced significantly after mid-March21 we modelled observed data
up to March 31.
RESULTS
Impact in daily deaths
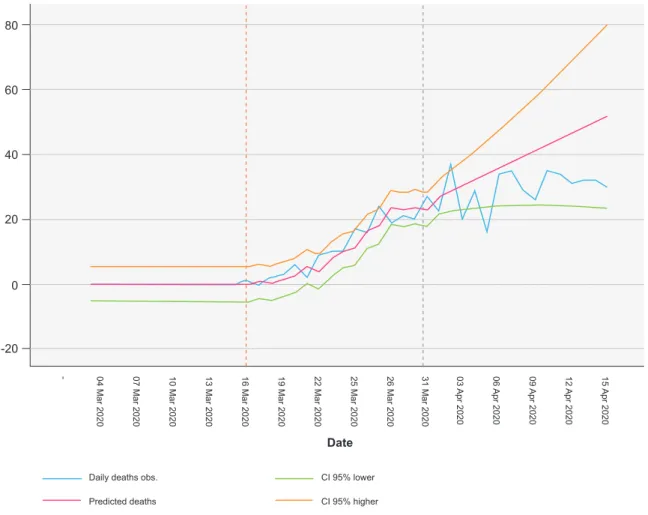
In the analyzed period, there were 442 deaths from COVID-19, 146 (-25%) fewer than the 588 that would be expected for that period if no containment and mitigation measures had been implemented. The exponential smooth-ing model for deaths (until March 31) had a good fit to ob-served data [R2 = 0.91, smoothing parameter test p < 0.001,
quality adjustment Ljung Box P = 0.75, autocorrelation func-tion (ACF) and partial autocorrelafunc-tion funcfunc-tion (PACF) not significant] (Fig. 3).
Impact on ICU inpatients
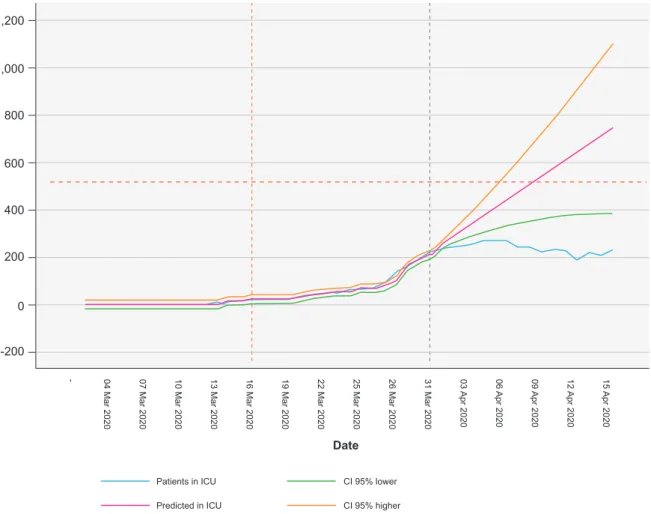
The forecast predicted that, as of April 15, 748 patients would be occupying ICU beds. We observed 519 fewer (-69%) patients in ICU than the predicted value by that date. ICU bed occupation fell short of the lower bound of the 95% confidence interval generated by the model throughout the period.
Figure 3 – Observed and predicted number of daily deaths by COVID-19, with 95% confidence intervals (Orange dashed line: date of lockdown; Dashed grey line: beginning of forecast)
- 04 Mar 2020 07 Mar 2020 10 Mar 2020 13 Mar 2020 16 Mar 2020 19 Mar 2020 22 Mar 2020 25 Mar 2020 26 Mar 2020 31 Mar 2020 03
Apr 2020 06 Apr 2020 09 Apr 2020 12 Apr 2020 15 Apr 2020
Date Daily deaths obs. CI 95% lower Predicted deaths CI 95% higher -20 0 20 40 60 80
ARTIGO ORIGINAL
Figure 4 – Observed and predicted number of daily ICU inpatients with COVID-19, with 95% confidence intervals (Orange dashed line: date of lockdown; Dashed grey line: beginning of forecast; Red dashed line: ICU beds capacity: 528)
- 04 Mar 2020 07 Mar 2020 10 Mar 2020 13 Mar 2020 16 Mar 2020 19 Mar 2020 22 Mar 2020 25 Mar 2020 26 Mar 2020 31 Mar 2020 03
Apr 2020 06 Apr 2020 09 Apr 2020 12 Apr 2020 15 Apr 2020
Date Patients in ICU CI 95% lower Predicted in ICU CI 95% higher -200 0 200 400 600 800 1,000 1,200
Throughout the period from 1 to 15 April, there was a daily average of 237 COVID-19 occupied ICU beds, 269 fewer than the 506 daily average expected in the same period (-53%), without containment and mitigation measures. For this analysis, we used an exponential smoothing model of number of patients in ICU (until March 31) with a good fit, (R2 = 0.98, p < 0.001 smoothing
para-meter test, Ljung Box adjustment quality P = 0.96, ACF and PACF not significant) - Fig. 4.
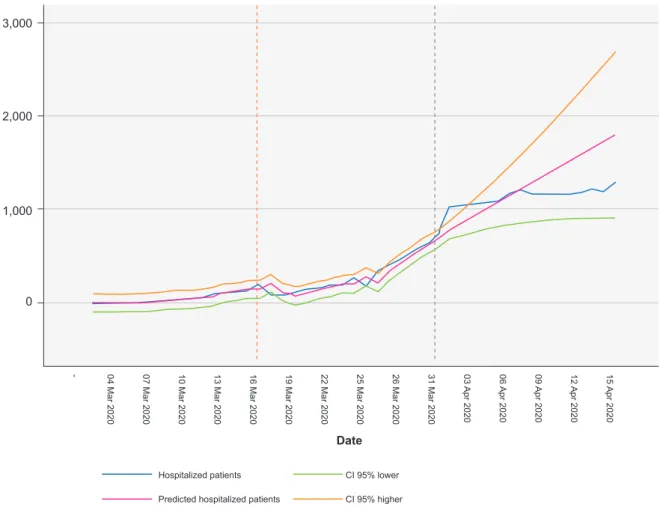
Impact on overall hospital bed occupation
We used publicly available data on occupied hospital beds(overall) each day to model the forecast. As at April 15, we predicted 1810 overall hospital beds occupied. We observed 508 fewer than the predicted value for that date (-28%).
Between 1 and 15 April, there was a daily average of 1158 hospital beds occupied by COVID-19 patients, 142 fewer than the 1300 occupied beds expected (-11%) if no containment and mitigation measures had been put in place. For this analysis we used the exponential smoothing model of hospitalized patient numbers (until March 31), (R2
= 0.94, smoothing parameter test p < 0.001, Ljung Box P = 0.84 adjustment quality, ACF and PACF not significant) - Fig. 5.
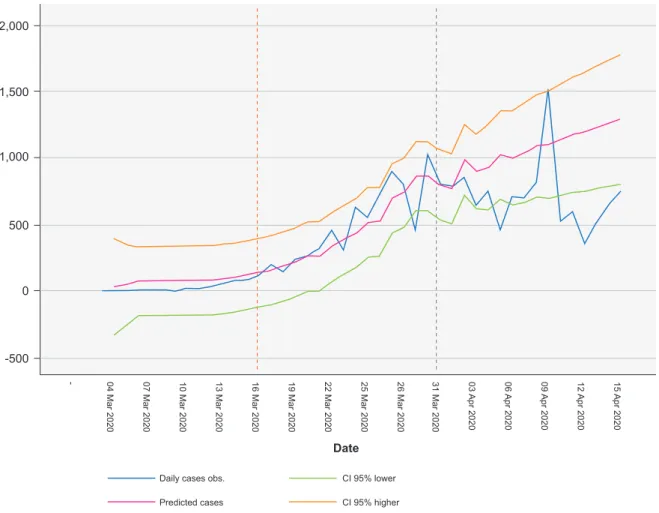
Impact in daily new cases
Between 1 and 15 April, there were 5568 fewer cases than the 24 405 cases forecasted (-23%). This indicator remained under the lower bound of the 95% confidence interval generated by the model after April 9.The forecast used an ARIMA model (2,1,0) adjusted until March 31 for the number of new daily cases 1, R2 = 0.86, test para-
meters of the model p < 0.05, adjustment quality Ljung Box
P = 0.95, ACF and PACF not significant (Fig. 6).
Despite the differences between forecasted and ob-served values there is uncertainty in the forecasts repre-sented by the inclusion of the 95% confidence intervals for the forecasts. These CI are methodologically conservative and widen quickly as we move further away from the begin-ning of the forecast and often the observed values fall within the confidence interval.
DISCUSSION
The findings of this study suggest that early Govern-ment action in impleGovern-menting a strict containGovern-ment and mi-tigation policy and a high level of compliance of the Por-tuguese population contributed to reducing mortality and severe morbidity in early stages of the first epidemic wave. Between April 1 and April 15, there were 25% fewer deaths, 23% fewer cases and, as of April 15, there were 69% fewer
ARTIGO ORIGINAL
Figure 5 – Observed and predicted number of daily hospital inpatients (All) with COVID-19, with 95% confidence intervals (Orange dashed line: date of lockdown; Dashed grey line: beginning of forecast)
- 04 Mar 2020 07 Mar 2020 10 Mar 2020 13 Mar 2020 16 Mar 2020 19 Mar 2020 22 Mar 2020 25 Mar 2020 26 Mar 2020 31 Mar 2020 03
Apr 2020 06 Apr 2020 09 Apr 2020 12 Apr 2020 15 Apr 2020
Date Hospitalized patients CI 95% lower Predicted hospitalized patients CI 95% higher 0
1,000 2,000 3,000
ICU inpatients and 28% fewer overall hospital inpatients than expected. On April 15 the number of ICU inpatients could have been greater than 740, more than three times higher than the observed value if the intervention was de-layed beyond the end of March assuming a 14-day lag in impact.
These time-series forecasting methods allow for an early retrospective estimate of the impact of measures that may be repeated whenever containment measures are changed and convey an intuitive way to visualize the impact of interventions. They are adequate for short-term forecast-ing makforecast-ing quantitative projections for policy makers22 that
are of relevance to public communication when justifying control measures.6 However, they do not consider changes
in parameters governing transmission, disease outcomes, and immunity to predict long-term outcomes as is done by mechanistic modells.22
The observed values are often within confidence inter-vals for cases, hospitalizations (general ward) and deaths. The selected methods imply conservative intervals in par-ticular as we move further in time and should be seen as conservative measures of uncertainty instead of serving to accept or reject any level of impact. In fact, the extremes of the CI are much less likely to have happened than values
closer to the central values23 and warrant cautious
interpre-tation. As such, for example, it is more likely that ICU capa-city would have been breached than not even if the lower CI of the forecast, while close, does not reach the ICU capacity limit.
Even though it is useful, there are some limitations in the quality of surveillance data we used in these models. Early in the epidemic there was likely an higher number of under-ascertained cases, specially mild ones, possibly turning forecasts more conservative. The sensitivity of the surveillance system was probably lower before the 26th of
march when the existence of an epidemic link was dropped from the suspected case definition which started to include anyone with a new cough or fever. Moreover, many milder infections and asymptomatic infections may have still been missed. On the other hand, there may have been some de-lays in reporting, resulting in a peak in reporting of cases on April 9 which is otherwise unexplained.
Data on COVID-19 deaths, and occupied Hospital (over-all) and ICU beds are expected to be of reasonable quality. In Portugal, COVID-19 deaths are reported by clinicians us-ing an online national platform and these data are available in real time. Deaths in patients who were suspected cases of COVID-19 where a lab result was not available are tested
ARTIGO ORIGINAL
Figure 6 – Observed and predicted number of cases of COVID-19 with 95% confidence intervals (Orange dashed line: date of lockdown; Dashed grey line: beginning of forecast)
- 04 Mar 2020 07 Mar 2020 10 Mar 2020 13 Mar 2020 16 Mar 2020 19 Mar 2020 22 Mar 2020 25 Mar 2020 26 Mar 2020 31 Mar 2020 03
Apr 2020 06 Apr 2020 09 Apr 2020 12 Apr 2020 15 Apr 2020
Date Daily cases obs. CI 95% lower Predicted cases CI 95% higher 0 -500 1,000 1,500 2,000 500
post-mortem24 (suspected case definition stopped including
epidemic link with a confirmed case on March 26th.
Pre-valent ICU and overall hospitalized cases in each day are reported from each hospital to the Regional Health Admin-istration and to DGS that collates and communicates the data and as such we assume good reporting quality. Criteria for ICU admission is unlikely to have significantly changed in the course of the pandemic, and DGS issued guidelines for ICU admission.25 However, it remains possible that the
threshold for admission to the ICU was slightly lower in the beginning of the pandemic, eventually contributing to higher forecasted values. On the other hand, data on new cases are likely to be biased, reflecting testing strategies and test availability. There was likely a higher level of under-ascertained cases in the early phase of the epidemic before the testing strategy changed in Portugal in March 26, and testing became more widespread (everyone with cough or fever tested).
To decide on the cut-off date of 14 days to initiate the forecast we made a number of assumptions based on the data presented in the published literature, which varies.16-20
One study found the median incubation period of COVID-19 to be seven days (IQR:4-11),16 another that the median time
from first symptom to dyspnoea was five days, to hospital
admission was seven days, and to ARDS was eight days17;
an interrupted time-series study suggested that the onset of reduction effects after the COVID-19 lockdown in Hubei and Guangdong on incidence and mortality were observed after a period ranging from seven to 17 days and 10 days, respectively.19 Considering this. and for an easier reading
and interpretation we assumed in the analysis that the im-pact would begin to be observed for all the outcomes from April 1, 14 days after the lockdown, even if conservative. Further supporting the decision to use 14 days as a cut-off, according to the National Association of Public Health Physicians (ANMSP), R (t) in Portugal (considering the previous seven days) has rapidly decreased from 3.64 in March 18, to 2.2 in March 24 to 1.64 in March 30 being almost always below 1 since April 6.21 Our estimates are
probably conservative. This short-term forecasting method assumed a fixed cut-off date on March 31, 14 days after the initial lockdown measures, to start forecasting the number of deaths, hospital and ICU inpatients and cases without intervention. The impact of the lockdown measures how-ever must have started earlier and gradually , rather than on specific moment in time.19,20 The gradual reduction in
R(t) in Portugal corroborates this. However, since R(t) and mobility reduction happened quickly in Portugal, by the
ARTIGO ORIGINAL middle of March, the effect would still not be too spread over time. Our time series models incorporate a flattening
of the new cases and death curves which was already hap-pening in the last days of March 2020. This influences the forecasts making them more conservative for these specific outcomes.
We cannot isolate the effect of specific measures on dif-ferent outcomes. The number of ICU inpatients and deaths is more strongly influenced by the number of cases in the elderly population, because of the inherent higher risk26 and
may have a larger impact if more cases are prevented in this population.
Different methods have been used internationally for estimating impact of COVID-19 containment measures through Susceptible Infected and Recovered models and others 2,4,27-29 including retrospectively through interrupted
time-series.19,20 The latter consistently found an impact of
lockdown policies, with variable lags from lockdown to max-imal impact.
We believe this forecast is adequate to estimate the early impact of lockdown measures, even if conservative as discussed above, because some behavioral changes would occur even without severe lockdown measures, specially among more vulnerable groups.
The timing of the implementation of strict social dis-tancing varied in different European countries. In Portugal, implementation occurred relatively early, following lessons learned from previous experience in Italy and Spain. Early interventions may have been particularly effective in the early phases of the pandemic, where a large proportion of mild cases may have accrued undetected30,31 and
under-as-certainment estimates vary widely in different countries.32,33
The population risk perception may have been influ-enced early by media reports in neighboring countries like Italy and Spain. In fact, a social opinion periodic survey of a non-probabilistic sample with more than 150 000 respond-ents found that risk perceptions were high from the week starting in March 21 (20.6% high risk; 44.9% moderate risk of acquiring COVID-19) and remained high until the end of the first week of April, with a slight reduction afterwards.34
This type of work, along with other methods, can be reproduced in order to find early evidence of the impact of changing containment strategies when lifting stringent social distancing policies, although decisions on modeled baseline periods and initiating forecasts can be further discussed and need to be considered in different settings, considering how quickly policy decisions have effective im-pact on behavior (mobility measures from Google and Ap-ple should be included in surveillance), new infections and severe outcomes of infection.
CONCLUSION
In Portugal, early and quick containment measures and high level of compliance of the population were associated with a relevant reduction in the number of serious cases and deaths by COVID-19. The results were apparent two
weeks after lockdown. This may have bought more time for preparedness and response, and for the implementation of other measures, including acquisition of personal protec-tive equipment, increased testing and healthcare capacity, strengthened public communication resources, campaigns, public health contact tracing resources and digital tools. The capacity of the National Health Service to care for serious COVID-19 cases, (528 intensive care unit beds at the start of the epidemic), could have been breached if containment measures had been delayed towards the end of March. In May, ICU bed capacity had been increased to 713 according to the Health Ministry.35 On a different note,
regional spread has been heterogeneous in Portugal13
making it more likely that ICU capacity would have been breached earlier in the most affected regions.
As for relaxation in lockdown measures, strong risk communication strategies must be in place to guarantee compliance with preventive measures such as physical dis-tancing, mask wearing, respiratory and hand hygiene and test seeking behavior when symptomatic, since the Portu-guese population felt a smaller first wave epidemic and risk perception may go down in the upcoming months. During this period, it is necessary: to maintain a high level of epi-demiological surveillance and adequate testing strategies, people´s symptoms awareness and test seeking behaviour, that allow for early case detection, and contact tracing; to focus on keeping the number of serious cases and deaths down, particularly among the high risk population (people aged over 70, and those with debilitating illness, namely those in long-term care institutions), to protect health care workers and other high-risk professionals; to keep the trans-mission rate under control, as recommended in the ECDC Risk Assessment of April 936 and the European Comission37;
and finally, to maintain a high level of awareness through innovative, group targeted communication strategies that adress misinformation and promote responsible individual risk management and compliance with prevention control measures and contact tracing strategies when lifting more stringent measures.
PROTECTION OF HUMANS AND ANIMALS
The authors declare that the procedures were followed according to the regulations established by the Clinical Re-search and Ethics Committee and to the 2013 Helsinki De-claration of the World Medical Association.
DATA CONFIDENTIALITY
The authors declare having followed the protocols in use at their working center regarding patients’ data publica-tion.
COMPETING INTERESTS
None declared.
FUNDING SOURCES
ARTIGO ORIGINAL
REFERENCES
1. Koo JR, Cook AR, Park M, Sun Y, Sun H, Lim JT, et al. Interventions to mitigate early spread of SARS-CoV-2 in Singapore: a modelling study. Lancet Infect Dis. 2020;20:678–88. (correction doi: 10.1016/S1473-3099(20)30261-9)
2. Lai S, Ruktanonchai NW, Zhou L, Prosper O, Luo W, Floyd R, et al. Effect of non-pharmaceutical interventions for containing the COVID-19 outbreak: an observational and modelling study. medRxiv. 2020:2020.03.03.20029843.
3. Kraemer MU, Yang CH, Gutierrez B, Wu CH, Klein B, Pigott DM, et al. The effect of human mobility and control measures on the COVID-19 epidemic in China. Science. 2020;368:493-7.
4. Hellewell J, Abbott S, Gimma A, Bosse NI, Jarvis CI, Russel TW, et al. Feasibility of controlling COVID-19 outbreaks by isolation of cases and contacts. Lancet Glob Heal. 2020;8:E488-96.
5. Anderson RM, Heesterbeek H, Klinkenberg D, Hollingsworth TD. How will country-based mitigation measures influence the course of the COVID-19 epidemic? Lancet. 2020;395:P931-4.
6. European Centre for Disease Prevention and Control. Strategies for the surveillance of COVID-19. Stockholm: ECDC; 2020. [accessed 2020 Apr 16]. Available from: https://www.ecdc.europa.eu/en/publications-data/strategies-surveillance-covid-19.
7. Ricoca Peixoto V, Vieira A, Aguiar P, Sousa P, Abrantes A. “Timing”, adesão e impacto das medidas de contenção da COVID-19 em Portugal. COVID-19. [accessed 2020 May 9]. Available from: https:// covid360.unl.pt/?p=1595.
8. Oxford COVID-19 Government Response Tracker. Blavatnik School of Government. [accessed 2020 Apr 7]. Available from: https://www. bsg.ox.ac.uk/research/research-projects/oxford-covid-19-government-response-tracker.
9. Google. COVID-19 Community Mobility Reports. [accessed 2020 Apr 4]. Available from: 2020.https://www.google.com/covid19/mobility/. 10. Barómetro Covid-19. Mobilidade dos Portugueses à lupa da Google e
do Barómetro Covid-19. [accessed 2020 Apr 24]. Available from: https:// barometro-covid-19.ensp.unl.pt/mobilidade-dos-portugueses-a-lupa-da-google-e-do-barometro-covid-19/.
11. Apple. COVID-19 - Mobility Trends Reports. [accessed 2020 Apr 18], Available from: https://www.apple.com/covid19/mobility.
12. World Health Organisation. COVID-19 strategy update - 14 April 2020. [accessed 2020 May 15]. Available from: https://www.who.int/ publications-detail/covid-19-strategy-update---14-april-2020.
13. Direção Geral da Saúde. Relatórios de Situação - COVID-19. [accessed 2020May 15], Available from:https://covid19.min-saude.pt/relatorio-de-situacao/.
14. IBM Knowledge Center. IBM SPSS Time Series Modeler. [accessed 2020 May 12]. Available from: https://www.ibm.com/support/ knowledgecenter/SSLVMB_24.0.0/spss/trends/idh_idd_tab_vars.html.
15. Tabachnick BG, Fidell LS. Using multivariate statistics. 6th ed. New
Jersey: Pearson Education; 2012.
16. Holmdahl I, Buckee C. Wrong but useful — what Covid-19 epidemiologic models can and cannot tell us. N Engl J Med. 2020;383:303-5. 17. Amrhein V, Greenland S, McShane B. Scientists rise up against
statistical significance. Nature. 2019;567:305-7.
18. Direção-Geral da Saúde. Norma no 002/2020 de 16/03/2020 atualizada
a 19/03/2020 Infeção por SARS-CoV-2 (COVID-19) – Cuidados post mortem, autópsia e casas mortuárias Normas - COVID-19. [accessed 2020 May 18]. Available from: https://covid19.min-saude.pt/normas/.
19. Direção-Geral da Saúde. Norma no 004/2020 de 23/03/2020 atualizada
a 25/04/2020. [accessed 2020 May 27]. Available from: https://www. dgs.pt/directrizes-da-dgs/normas-e-circulares-normativas/norma-n-0042020-de-23032020-pdf.aspx.
20. Wang P, Lu J, Jin Y, Zhu M, Wang L, Chen S. Statistical and network analysis of 1212 COVID-19 patients in Henan, China. Int J Infect Dis. 2020;95:391-8.
21. Wang D, Hu B, Hu C, Zhu F, Liu X, Wang B, et al. Clinical characteristics of 138 hospitalized patients with 2019 novel Coronavirus-infected
nneumonia in Wuhan, China. JAMA. 2020;323:1061-9.
22. Yang X, Yu Y, Xu J, Shu H, Xia J, Liu H, et al. Clinical course and outcomes of critically ill patients with SARS-CoV-2 pneumonia in Wuhan, China: a single-centered, retrospective, observational study. Lancet Respir Med. 2020;8:475-81.
23. Medeiros de Figueiredo A, Daponte Codina A, Moreira Marculino Figueiredo DC, Saez M, Cabrera León A. Impact of lockdown on COVID-19 incidence and mortality in China: an interrupted time series study. Bull World Health Organ. 2020 (in press). doi: dx.doi.org/10.2471/ BLT.20.256701.
24. Associação Nacional dos Médicos de Saúde Pública.. COVID-19. Mapa Epidemiológico de Portugal. [accessed 2020 Apr 24]. Available from: https://www.anmsp.pt/covid19-mapa.
25. Siedner MJ, Harling G, Reynolds Z, Gilbert RF, Venkataramani A, Tsai AC. Social distancing to slow the U.S. COVID-19 epidemic: an interrupted time-series analysis. medRxiv. 2020:2020.04.03.20052373. 26. Verity R, Okell LC, Dorigatti I, Winskill P, Whittaker C, Imai N, et al.
Estimates of the severity of coronavirus disease 2019: a model-based analysis. Lancet Infect Dis. 2020;3099:1-9.
27. Leung K, Wu JT, Liu D, Leung GM. First-wave COVID-19 transmissibility and severity in China outside Hubei after control measures, and second-wave scenario planning: a modelling impact assessment. Lancet. 2020;395:1382-93.
28. Kucharski AJ, Russell TW, Diamond C, Liu Y, Edmunds J, Funk S, et al. Early dynamics of transmission and control of COVID-19: a mathematical modelling study. Lancet Infect Dis. 2020;20:P553-8. 29. World Health Organistion Collaborating Centre for Infectious Disease
Modelling, MRC Centre for Global Infectious Disease Analysis, Abdul Latif Jameel Institute for Disease and Emergency Analytics, Imperial College London. Impact of non-pharmaceutical interventions (NPIs) to reduce COVID-19 mortality and healthcare demand. 2020. [accessed 2020 Mar 17]. Available from: https://www.imperial.ac.uk/mrc-global-infectious-disease-analysis/news--wuhan-coronavirus/.
30. Ricoca Peixoto V, Nunes C, Abrantes A. Epidemic surveillance of Covid-19: considering uncertainty and under-ascertainment. Port J Public Heal. 2020;38:23–9.
31. Munster VJ, Koopmans M, van Doremalen N, van Riel D, de Wit E. A novel Coronavirus emerging in China — key questions for impact assessment. N Engl J Med. 2020;382:692-4.
32. Center for Global Infecitous Disease Analysis - Imperial College London. Short-term forecasts of COVID-19 deaths in multiple countries. [ccessed 2020 May 13]. Available from: https://mrc-ide.github.io/covid19-short-term-forecasts/index.html#analysis-of-trends-in-reporting.
33. Golding N, Russel TW, Abbott S, Hellewell J, Pearson CA, van Zandvoort K, et al. Reconstructing the global dynamics of under-ascertained COVID-19 cases and infections. medRXiv. doi: 10.1101/2020.07.07.20148460.
34. Barómetro Covid-19 - Opinião Social — 1 mês de confinamento: o que mudou nas perceções dos portugueses? [accessed 2020 May 18]. Available from: https://barometro-covid-19.ensp.unl.pt/1-mes-de-confinamento-o-que-mudou-nas-percecoes-dos-portugueses/. 35. Diário de Notícias. Portugal nunca utilizou a sua capacidade total
em cuidados intensivos. [accessed 2020 May 9]. Available from: 2020.https://www.dnoticias.pt/pais/portugal-nunca-utilizou-a-sua-capacidade-total-em-cuidados-intensivos-CF6241613.
36. Coronavirus disease 2019 (COVID-19) in the EU/EEA and the UK – ninth update, 23 April 2020. Stockholm: ECDC; 2020. [accessed 2020 Apr 30]. Available from: 2020.https://www.ecdc.europa.eu/en/ publications-data/rapid-risk-assessment-coronavirus-disease-2019-covid-19-pandemic-ninth-update.
37. European Commission. A European roadmap to lifting coronavirus containment measures. [accessed 2020 Apr 20]. Available from: https:// ec.europa.eu/info/live-work-travel-eu/health/coronavirus-response/ european-roadmap-lifting-coronavirus-containment-measures_en.