UNIVERSIDADE DE LISBOA
FACULDADE DE CIÊNCIAS
DEPARTAMENTO DE BIOLOGIA ANIMAL
Inversion polymorphisms: an insight into its
molecular genetic content
João Guilherme Patrício Picão de Almeida Osório
MESTRADO EM BIOLOGIA EVOLUTIVA E DO
DESENVOLVIMENTO
UNIVERSIDADE DE LISBOA
FACULDADE DE CIÊNCIAS
DEPARTAMENTO DE BIOLOGIA ANIMAL
Inversion polymorphisms: an insight into its
molecular genetic content
João Guilherme Patrício Picão de Almeida Osório
Dissertação de mestrado orientada por:
Professora Doutora Marta Pascual – Dept. Genètica, Facultat de
Biologia, Universitat de Barcelona
Professora Doutora Margarida Matos – Dept. Biologia Animal,
Faculdade de Ciências, Universidade de Lisboa
MESTRADO EM BIOLOGIA EVOLUTIVA E DO
DESENVOLVIMENTO
T
ABLE OF CONTENTS ACKNOWLEDGMENTS i 1. RESUMO 1 2. ABSTRACT 6 3. INTRODUCTION 7 3.1. Chromosomal Inversions 73.2. Origin of Chromosomal Inversions 7 3.3. Adaptive Role of Chromosomal Inversions 8 3.4. Molecular Markers and Inversions 10
3.5. Objectives 11
4. MATERIAL AND METHODS 13
4.1. Geographic Samples 13
4.2. Chromosomal Inversions 13
4.3. DNA Extraction and Microsatellite Amplification 14
4.4. Statistical Methods 18
5. RESULTS 20
5.1. Population Variability 20
5.2. Population Differentiation 23
5.3. Genetic content of the chromosomal arrangements 24
5.4. Linkage Disequilibrium 28
6. DISCUSSION 35
6.1. Patterns of Genetic Variability and Differentiation 35 6.2. Genetic Composition of Chromosomal Arrangements: Different
6.3. Genetic Composition of Chromosomal Arrangements and the Founder
Effect 43
7. CONCLUDING REMARKS 44
ACKNOWLEDGMENTS
I want to thank the many people involved in this thesis directly or on the back stage:
First of all, I would like to thank my advisor Professor Marta Pascual for all the support and friendship throughout this research year. I want to stand out how Marta received me, even though with no previous announcement. Our scientific interaction was extremely and contributed greatly to my formation.
To the great pos‐doc Pedro Simões (a.k.a. “El Presidente”, “Dream team Evolution”, Pedrinho or simply as Simões et al.) who became a great friend and a great scientific colleague. All the people of the Evolutionary Genetics Lab or connect to it: my thanks to Víctor Hugo, Gemma, Cinta, Chus,Victor Ordoñez, Celia, Xavi, Albert, Salvatore and Champi; and to the Professors Francesc, Joan and Lluís. It was a great year at the personal and scientific level. Professor Margarida Matos, for the passionate way of teaching evolution and for all the effort made for thesis to be conducted in Barcelona. To Professor Élio Sucena for teaching science.
All my friend inside and/or outside science!!!! Many Thanks…(in alphabetic order) A.B., Action, Alex Maria, Aninhas, Cocas, Emília, Fred Cabeças, Francisca, Hany Isadora, J.P., Lima, Machado, Marialva, Moscoso, Patraquim, Pedro Simões, Rita, Sara, VH, Tona, Zuca to all. (In case that I forgot someone, sorry but Alex have to print my thesis)
Isadora to this fantastic year that I hope to be many more.!!
but for some different reasons as above.
Thanks to the all great music, I would not be able to work or do anything else.
I would like to thank the fantastic Erasmus Grant that gave me financial support (€200/month)
To Claudio Alonso for allowing me finish the present thesis during the first weeks of my staying in his lab.
Finally, I am deeply thankful to my family, especially to my great Mother!!
1.RESUMO
As inversões cromossómicas são uma característica inerente ao genoma do
género Drosophila. As inversões paracêntricas são as mais comuns estando presentes
em 60% das suas espécies. Este tipo de inversões não envolvem o centrómero no
segmento invertido. Indivíduos heterozigóticos para inversões, isto é
heterocariótipicos, apresentam uma redução da recombinação na parte invertida do
cromossoma como resultado de problemas mecânicos no emparelhamento dos
cromossomas homólogos. Para além do problema físico no emparelhamento, um
evento de “crossing-over” em número ímpar durante a meiose originaria gâmetas não
balanceados. A reduzida troca de informação genética entre inversões leva a que
sejam herdadas como unidades Mendelianas.
Drosophila subobscura é constituída por cinco cromossomas acrocêntricos
e um puntiforme: cromossoma A (cromossoma sexual), J, U, E and O (autossómicos);
e tem um rico polimorfismo de inversões em todos os seus cromossomas de forma
simples (única inversão, ex. A1) ou composta em ordenamento (múltiplas inversões,
ex. O3+4). Esta espécie é nativa da região Paleárctica onde apresenta clines latitudinais
para muitos ordenamentos cromossómicos (simples e compostos), ou seja, a
frequência dos ordenamentos varia com a latitude. A colonização do continente
Americano veio reforçar a importância da selecção natural como principal mecanismo
responsável pela formação dos clines. No final da década de setenta D.subobscura
colonizou a América do Sul e posteriormente a América do Norte, e rapidamente
foram estabelecidos clines latitudinais paralelos aos do Velho Mundo. Apesar da
evidencia do valor adaptativo das inversões, os mecanismos envolvidos na
Dois cenários selectivos não mutuamente exclusivos foram propostos para esta
problemática: a hipótese de coadaptação sensu Dobzhansky e a hipótese de adaptação
local de Kirpatrick e Barton. A primeira tem duas características: dentro de um
ordenamento os alelos de diferentes loci interagem epistaticamente dentro de uma
população, e interacções entre diferentes ordenamentos da mesma população
promovem a vantagem dos heterocariótipos. Como consequência destes efeitos
epistáticos positivos dentro de populações, troca genética entre populações iria
romper as associações de alelos coadaptados e levaria uma depressão na eficácia
biológica desses indivíduos. Ou seja, os ordenamentos cromossómicos têm
propriedades específicas de cada população.
A hipótese de adaptação local não necessita que hajam interacções epistáticas
para que a inversão seja favorecida. Quando uma inversão surge, irá capturar
conjuntos de alelos que estão independentemente adaptados às condições locais. Os
alelos serão mantidos na inversão porque a recombinação é reduzida nos
heterocariótipos, e consequentemente a frequência da inversão irá aumentar por ter
vantagem sobre os susceptíveis de recombinação. Deste modo, o modelo prevê que a
composição genética das inversões seja mantida nas diferentes populações.
Com o intuito de estudar a evolução do conteúdo genético das inversões e
inferir qual destes mecanismos selectivos propostos para a evolução e manutenção
dos polimorfismos das inversões melhor explica os padrões de variação clinal em D.
subobscura, estudámos 31 microssatélites que cobrem todo o genoma de Drosophila subobscura e sua associação com as inversões cromossómicas em quatro populações
Inicialmente, estudámos padrões gerais de variabilidade e diferenciação tanto
a nível de microsatélites como de polimorfismo cromossómico. Para testar as
hipóteses de mecanismos selectivos anteriormente expostas, analisámos a existência
de diferenciação genética através da estatística F (FST) em diferentes ordenamentos na
mesma e em diferentes populações Europeias; e também do mesmo ordenamento
entre populações Europeias. De seguida, estudámos os níveis de associações não
aleatória, “linkage disequilibrium” (LD), entre os alelos dos microssatélites e os
ordenamentos utilizando loci localizados dentro e fora dos ordenamentos. Os padrões
de desequilíbrio em populações ancestrais e colonizadoras foram comparados para
estudar o impacto ao nível genético de um efeito de gargalo associado à colonização
da América do Norte.
Tendo esta informação em conta, discutimos se os padrões destas associações
são devidas a processos históricos associados com a formação da inversão ou a
selecção na formação dos clines latitudinais destes ordenamentos cromossómicos
adaptativos. Também interpretámos os padrões obtidos à luz do recente trabalho
teórico de Kirpatrick e Barton (2006).
Inesperadamente, os resultados obtidos revelaram histórias distintas para os
diferentes cromossomas nas populações Europeias. O cromossoma A não apresentou
diferenciação na composição genética entre diferentes ordenamentos na mesma
população bem como em distintas populações tanto nos marcadores localizados
dentro como fora dos ordenamentos. O mesmo padrão foi observado para o mesmo
ordenamento entre populações. Nós propusemos que a falta de diferenciação poderia
ser uma consequência de homoplasia. A alta variabilidade do cromossoma sexual nas
de diferenciação entre ordenamentos, apenas os loci dentro das inversões
apresentavam padrões de desequilíbrio, e os ordenamentos variaram na sua associação
com os alelos de microssatélites. Algumas destes padrões de LD mantiveram-se entre
populações sugerindo a acção da selecção em regiões adjacentes a estes loci.
O conteúdo genético dentro dos ordenamentos dos cromossomas J, E e O
manteve-se constante entre populações Europeias, ou seja, a identidade de cada
ordenamento manteve-se ao longo da Europa. Pelo contrário, na mesma população a
composição dentro dos distintos ordenamentos era significativamente diferente. Estes
padrões de composição génica dos ordenamentos estão de acordo com a hipótese de
adaptação local. Em estudos anteriores foi reportado a existência de fluxo genético
entre populações e entre diferentes ordenamentos, no entanto os padrões genéticos
mantêm-se. O que sugere que forte selecção estaria a contrabalançar o efeito
homogeneizador da migração e da troca genética entre ordenamentos. Assim, o nosso
argumento que a adaptação local seria o mecanismo responsável pelo valor adaptativo
dos cromossomas J, E e O ganha robustez.
Os ordenamentos do cromossoma U apresentavam composições específicas
para cada população Europeia, ou seja, o mesmo ordenamento era diferente na sua
composição entre populações. Adicionalmente, os diferentes ordenamentos eram
distintos tanto na mesma população como entre populações. Os padrões de LD
também eram específicos de cada população, ou seja, as associações não ao acaso
entre alelos de microssatélites e ordenamentos diferiam entre populações. Mesmo
tendo em conta a existência de migração e troca genética entre ordenamentos, as
características especificas de cada ordenamento em cada população são mantidas.
genético especifico de cada população no cromossoma U, o que está de acordo com a
hipótese de coadaptação sensu Dobzhansky.
A população Norte Americana apresentava variabilidade reduzida, e tanto a
composição genética como os padrões de associação eram distintos dos Europeus. O
efeito gargalo foi determinante na composição genética desta população que
apresentava grande LD ao longo do genoma e tendo os ordenamentos dos diferentes
cromossomas em associação com vários alelos. Não podemos fazer nenhuma ilação se
os processos no continente Americano são os mesmo que no Velho Continente.
Contudo, segundo o trabalho teórico de Kirkpatrick e Barton são necessários dois loci
para o cenário da adaptação local se processar. Assim, nesta recente população os loci
que estão a dar o valor selectivo à inversão poderão ser poucos e não coincidirem com
os ancestrais devido ao efeito fundador.
Os dados obtidos e discutidos nesta dissertação indicam que diferentes
mecanismos selectivos podem estar a afectar o genoma de Drosophila subobscura.
Estudos clássicos de associação entre aloenzimas e inversões também apresentavam
um padrão de não diferenciação do mesmo ordenamento entre populações nos
cromossomas E e O. O modelo de adaptação local parece estar amplamente
distribuído no género Drosophila, uma vez que encontrámos os mesmo padrões em
estudos anteriores em diversas espécies de Drosophila.
PALAVRAS-CHAVE: Polimorfismo das Inversões Cromossómicas, Adaptação Local,
Coadaptação, Drosophila subobscura, “Linkage Disequilibrium”, Populações
2. ABSTRACT
There is compelling evidence supporting an adaptive explanation for the
evolution of inversion polymorphism in D.subobscura. Nevertheless, the specific
mechanisms that underlie the maintenance and evolution of these polymorphisms are
still in debate. The analysis of the associations between chromosomal inversions and
microsatellite alleles is extremely useful to address the evolution of the genic content
of inversions. Here we present a survey of 31 microsatellite loci covering the whole
genome of D.subobscura and their association with chromosomal inversions on four
European (Barcelona, Mount Parnes, Drøbak and Sunne) and one North American
populations (Bellingham). We observed high linkage disequilibrium (LD) between
most microsatellite loci and chromosomal arrangements in the colonizing population
as a result of the founder event. Among European populations we have observed: i)
no genetic differentiation between arrangements and within the same arrangements
between populations for the sex-chromosome, ii) higher genetic differentiation
between arrangements within populations than within the same arrangements between
populations for chromosomes J, E and O, and iii) the arrangements of chromosome U
had population-specific properties. The LD patterns between autosomal arrangements
and microsatellite loci were in accordance with the genetic differentiation of the
arrangements. Furthermore, we discuss whether this LD patterns in most localities are
due to historical processes associated with the inversion formation or to selection. Our
results provide strong support for distinct selective mechanisms on the maintenance of
inversion polymorphisms, namely: local adaptation hypothesis on chromosome J, E
and O, and coadaptation sensu Dobzhansky on U chromosome.
KEYWORDS: Chromosome Inversion Polymorphisms, Local adaptation,
3. INTRODUCTION
3.1. Chromosomal Inversions
During the evolution of the genus Drosophila, it appears that chromosomal
inversion polymorphism represents an inherent attribute of its genome (GREGORY
2004; KRIMBAS and POWELL 1992), with about 60% of its species presenting
paracentric inversions (POWELL 1997). This kind of inversions are characterized by an
inverted segment of the chromosome where the breakpoints occur on one side of the
centromere (HOFFMANN et al. 2004), i.e., the inversion does not involve the
centromere. Individuals heterokaryotipic for inversions present reduced
recombination (POWELL 1997). The products of single or odd crossover events within
the inversion are unviable by originating unbalanced gametes (HOFFMANN et al. 2004;
POWELL 1997). Additionally, inversion heterozygotes promote mechanical pairing
problems in the inversion breakpoints (GRIFFITHS et al. 2004). These factors
contribute to inversions becoming “inherited intact as single simple Mendelian units”
for the majority of the chromosome (POWELL 1997).
3.2. Origin of Chromosomal Inversions
Surprisingly, although the study of chromosome rearrangements has been
developed since the 30’s, the evolution and origin of such structures remains largely
unclear (CASALS and NAVARRO 2007). The broadest idea comes from Finnegan in
1989 (FINNEGAN 1989) – the ectopic recombination (or illegitimate recombination or
non-allelic homologous recombination; (CASALS and NAVARRO 2007). This idea is
supported by the existence, in some Drosophila lineages, of transposable elements in
orientation, the result of a recombination event will produce a chromosome inversion
(CASALS and NAVARRO 2007; FINNEGAN 1989). A recent work by Ranz and
collaborators raised another possible scenario (RANZ et al. 2007). The authors found a
high frequency of association between the breakpoint regions of the inversions and
inverted duplications of genes or other nonrepetitive sequences. Furthermore, a very
low association between the breakpoint regions and inverted repetitive sequences was
found in the melanogaster species group. In this new circumstance, the duplications at
the breakpoints are not the cause of the inversion, but a by-product of staggered
breaks caused by the occurrence of an inversion - staggered breaks model (CASALS
and NAVARRO 2007; RANZ et al. 2007). This novel data shed a fresh light onto the
mechanisms behind chromosomal rearrangements and stand, together with the
previous model, as the two most predominant explanations for this process.
3.3. Adaptive Role of Chromosomal Inversions
The adaptation paradigm is one of the most debated topics in evolutionary
biology (LEWONTIN 1974; ORR 2005). Despite this, much is still unknown about the
genetic basis underlying adaptation. Furthermore, its impact in the shaping of
genomes relative to other evolutionary forces/processes is sometimes not easy to
access (e.g. (HAHN and RAUSHER 2008). Namely, historical contingency could have a
confounding effect or bias some interpretations in this problematic (GOULD and
LEWONTIN 1979; TRAVISANO et al. 1995). Chromosomal inversion polymorphisms
were the first genetic markers in which the action of natural selection on natural
populations was empirically shown, through the pioneering work of Dobzhansky and
colleagues (DOBZHANSKY 1970). The seasonal frequency changes (DOBZHANSKY
clinal variation at a broad geographical scale (BALANYA et al. 2003; BALANYA et al.
2004; KRIMBAS and POWELL 1992) points to an adaptive role for these inversions
polymorphisms.
Latitudinal clines for most chromosome arrangements are well establish in
Europe and have been maintained for many years in Drosophila subobscura
populations (BALANYA et al. 2004; KRIMBAS and POWELL 1992). Furthermore, the
repeatable clinal patterns for chromosomal inversions found in both North and South
America few years after its colonization (PREVOSTI et al. 1988), and the maintenance
of these patterns reinforce the idea that the clines evolved by natural selection
(BALANYA et al. 2003). More recently it was shown that the frequency of these
arrangements tracks global warming at a worldwide scale (BALANYA et al. 2006).
However, much is still unknown about the mechanisms that underlie the maintenance
and evolution of these polymorphisms, i.e., the genetic basis of this adaptation (see
(HOFFMANN and RIESEBERG 2008).
Two main selective scenarios, not mutually exclusive, have been suggested to
explain the evolution and maintenance of these polymorphisms: the coadaptation
hypothesis sensu Dobzhansky (DOBZHANSKY 1950) and the local adaptation
hypothesis (KIRKPATRICK and BARTON 2006). The former concept entails two
features; alleles at different loci within gene arrangements interact epistatically within
local populations, and interactions between different gene arrangements from the
same population promote selective advantage in heterokaryotypes (DOBZHANSKY
1950; PRAKASH and LEWONTIN 1968). As a consequence of these positive epistatic
interactions within local populations, genetic exchange among chromosomal
arrangements from different populations will lead to an outbreeding depression due to
chromosomal arrangements have population-specific properties.
Under the local adaptation hypothesis (KIRKPATRICK and BARTON 2006) no
epistasis is required for inversions to be favored. When an inversion arises it may
capture together modules of alleles that are independently adapted to local conditions.
These alleles will be maintained in the inversion due to recombination reduction in
heterokaryotypes. Consequently, they will increase in frequency since they will have
higher fitness relative to the ones susceptible to recombination. Therefore, the alleles
harbored within the inversion will spread, and as a result the inversion will spread
with them. One expected output of this model would be no genetic differentiation
within the same gene arrangements along different populations, that is, gene
arrangements would have their own identity. On the other hand, under the
coadaptation model, genetic differentiation is expected both between similar gene
arrangements across populations and between different gene arrangements in the same
population. It is important to state that although this local adaptation model does not
require epistasis, it also does not neglect it, as the authors propose that epistasis might
in fact enhance the evolution of chromosome inversions.
3.4. Molecular Markers and Inversions
The association studies between chromosomal inversions and molecular
markers are extremely useful to address the evolution of the genic content of
inversions. In the last decades of the XX century several studies were done trying to
establish an association between allozymes and inversions (LOUKAS and KRIMBAS
1975; LOUKAS et al. 1979; PRAKASH and LEWONTIN 1968, 1971; ZOUROS and
between some allozymes with inversions, with different populations presenting the
same association patterns. Generally, these studies observed similar patterns of
considerable genetic differentiation between arrangements and no differentiation on
the same arrangement for most populations analyzed. Molecular studies conducted in
D.subobscura reveal the same patterns of significant genetic differentiation between
gene arrangements, even though genetic exchange can occur within inversions
between gene arrangements by gene conversion and/or by double crossovers (MUNTE
et al. 2005; NOBREGA et al. 2008; ROZAS and AGUADÉ 1990,1994; ROZAS et al.
1999). Recent molecular studies have claimed that coadaptation is an important
mechanism for the evolution of chromosomal inversion in Drosophila (KENNINGTON
et al. 2006; SCHAEFFER et al. 2003). In both works the authors found significant
genetic differentiation between chromosomal arrangements, which is in accordance
with the coadaptation model sensu Dobzhansky, although no genetic differentiation
was found for the same chromosomal arrangements in different populations. Also,
they report evidence for statistical epistatic selection in loci inside the inversion based
on the detection of regions with high linkage disequilibrium (LD) interspersed by
regions of low LD.
3.5. Objectives
The majority of the molecular studies mentioned above were performed in few
chromosomes and/or populations. So, a more global picture of the molecular genetic
content of these gene arrangements both at the whole genome level and also at a
broad geographical scale is still missing. Here, we present a survey of 31
association with chromosomal inversions on four European ancestral populations and
one North American recently colonized population of this species.
We will thus be able to address the evolution of the genic content of inversions
and infer which of the two selective mechanisms proposed for the evolution and
maintenance of inversion polymorphisms - the coadaptation and the local adaptation
models – better fits our data. Specifically we aim to:
• test the existence of genetic differentiation in different arrangements and/or in the same chromosomal arrangements across different populations.
• study the levels of linkage disequilibria (LD) between microsatellite alleles and inversions, using several loci that are mapped inside and outside these
chromosomal arrangements.
• analyze LD patterns in ancestral and colonizing D. subobscura populations. This will allow us to determine to what extent do the populations of the Old
World that span a broad latitudinal and longitudinal range present the same
patterns of LD as well as compare those with the ones presented by the
colonizing population. We will also address the impact of the bottleneck
associated with the colonization of North America at the genetic level.
• Taking all this information in account, we will further discuss whether this linkage disequilibrium patterns in most localities are due to historical
processes associated with the inversion formation or to selection driving the
4. MATERIAL AND METHODS
4.1. Geographic Samples
Wild Drosophila subobscura samples were collected from four European
populations and one North America population in different years and seasons (Figure
1). The Barcelona (Spain) population was sampled in October 2007 (95 individuals),
Mount Parnes (Greece) in May of 2006 (103 individuals), Drøbak (Norway) and
Sunne (Sweden) in August 2005 (80 and 63 individuals, respectively) and Bellingham
(USA) in October 2006 (94 individuals).
4.2. Chromosomal Inversions
The karyotype of D. subobscura consists of five acrocentric chromosomes and
a dot chromosome. (MAINX et al. 1953) named as A (=X, the sex chromosome), J
FIGURE 1. - Map of Europe (1) and North America (2) and the sampled sites. Adapted from PREVOSTI et al. 1988
in Drosophila melanogaster), U (chromosomal element B and homologous to arm
2L), E (chromosomal element C and homologous to arm 2R), and O (chromosomal
element E and homologous to arm 3R).
In order to score the chromosomal arrangements, wild-caught males or males
descendant from isofemale lines were individually crossed with virgin females of the
chcu strain. The chcu strain carries the recessive markers cherry eyes and curled
wings and its genetic background is highly homogeneous and homokaryotypic for the
chromosomal arrangements AST, JST, UST, EST and O3+4 (KOSKE and MAYNARD SMITH
1954). One female third-instar larva from each cross was dissected and then examined
for its polytene chromosomes to ascertain the arrangements of one set of the
chromosomes from the wild. The remaining of the larva was preserved in ethanol at
-80ºC for posterior DNA extraction. Salivary glands were stained with 2% orcein in
60% acetic acid mixed 50: 50 with lactic acid. The chromosomal arrangements were
designated according to (KUNZE-MÜHL and MÜLLER 1958). All crosses were kept at
18ºC.
4.3. DNA Extraction and Microsatellite Amplification
Genomic DNA was individually extracted from each larva of the crosses (also
used to score inversion polymorphism). The samples were hydrated with TE 0,1x
(10mM TrisHCL, 1mM EDTA, pH 8) overnight at 4ºC prior to extraction. Each larva
was homogenized in a microtube with 160μl of cold solution I (10mM Tris, 60mM NaCl, 5% Sucrose, 10mM EDTA, pH 7,8). Then, 200μl of solution II (300mM Tris, 1,25% SDS, 5% Sucrose, 10mM EDTA, pH 8) were added, the homogenate was
mixed by inversion of the tube and the tube was placed in a water bath at 65ºC for
-20ºC for 20min. After centrifugation for l5min (12000 r.p.m.) an equal volume of
Isopropanol (~400μl) was added to the aqueous phase and the sample was maintained at room temperature for 5 min. After centrifugation for 10min the pellet was rinsed
with 500μl of 70% ethanol, vacuum dried, and resuspended in 50μl of double deionized sterile water. The primers are described in Table 1.
The thirty-one microsatellite loci analyzed in this study were: dsub11, dsub37,
dsub76, dsub05, dsub21, dsub39, dsub70, dsub19, dsub18, dsub59, dsub69, dsub74,
dsub62, dsub27, dsub10, dsub03, dsub42, dsub64, dsub15, dsub46, dsub68, dsub79,
dsub20, dsub53, dsub28, dsub02, dsub14, dsub38, dsub01, dsub04, dsub12 (Table 1).
These markers had been previously identified and characterized in D. subobscura
(PASCUAL et al. 2000), and were chosen due to their localization on the chromosomes
in respect to their inversions (Figure 2; chromosomal localization given by Santos
personal communication).
The markers were amplified using six different multiplex PCR reactions. The
loci of each chromosome were amplified together on a multiplex PCR reaction using
the Qiagen Multiplex Amplification Kit. The loci dub64, dsub46 and dsub20 were
amplified apart on two PCR reactions: dsub64 with the Amersham Taq polymerase
and dsub46+dsub20 with the Qiagen Kit. The amplification reactions with the Qiagen
Kit were performed for a total volume of 15 μl with 7,4 μl of the Kit’s Master Mix, 1,5μl of primer mix (2 μM each primer) and 1μl of DNA. The multiplex amplification reactions with the Amersham Taq polymerase were carried out in a 15μl reaction containing 1,5µl of 10x Buffer, 2,4µl dNTP (at 1mM each), 0,12µL of Taq
polymerase, 2,1µl of MgCL2 (25mM), 1,2µL of primer mix (2 μM each primer), 0,15
All reactions were performed on an AB GeneAmp PCR System 2700 machine
using the following steps: 15 min at 94°C, then
30 cycles of 30s at 94°C, 30s at 50°C and 30s at 72°C followed by 30min at 60°C.
After amplification, the products were visualized in an agarose gel and then loaded on TABLE 1- Primers and characteristics of the 31 microstallite loci.
an ABI PRISM 3700 automatic sequencer from the Scientific and Technical Services
of the University of Barcelona, with CST ROX 70–500 (BioVentures, Inc.) used as
internal molecular ladder, and allele sizes were assigned with GeneMapper™ ID
version 3.7 (Applied Biosystems, Inc.)
FIGURE 2.-Schematic representation of the location of the microsatellite
loci in chromosomes A, J, U, E and O of Drosophila subobscura, , with
inversion positions also marked (for O chromosome are only represented the most common arrangements). The centromere is placed on the left (black circle) and the telomere on the right. The linear order of micrsosatellite is their localization in the standard arrangements
4.4. Statistical Methods
Molecular Genetic variability was measured using both allelic richness and
expected heterozigosity (He, or gene diversity) with FSAT software package
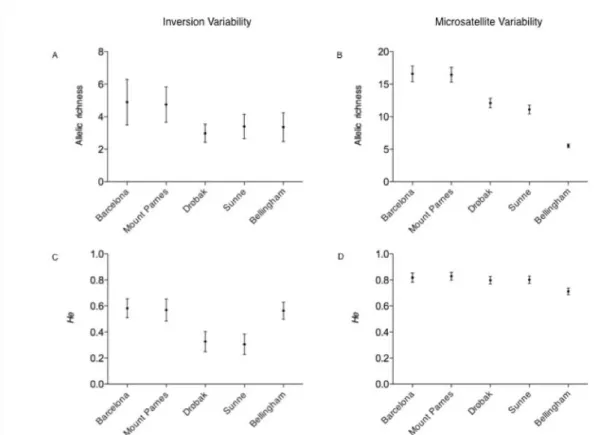
(GOUDET 2001). The variability of each population (Figure 3) was an average of the
variability of all microsatellite loci of all chromosomes. Patterns of inversion
variability were obtained considering each chromosome as a locus and each
arrangement as an allele. The allelic richness and expected heterozygosity were
compared among populations with the Wilcoxon Matched Pairs Test using Statistica 9
software.
Genetic differentiation was calculated with F-statistics (WEIR and
COCKERHAM 1984) and their significance were determined using FSTAT (GOUDET
2001) with sequential Bonferroni correction. To determine the genetic differentiation
of chromosomal arrangements we treated each arrangement of a European population
as a “subpopulation”. Then, we compared the genetic differentiation (FST) of all pairs
of comparisons between arrangements of the same chromosome and grouped in three
categories: i) the same chromosome arrangement in different populations, ii) different
chromosome arrangements in the same population, and iii) different chromosome
arrangements in different populations. The FST in the loci that mapped inside and
outside the inversions was calculated by pair of comparisons of the inversions
represented on the majority of the populations: AST, A1 and A2; JST and J1; EST, E1+2,
E1+2+9 and E1+2+9+12; UST, U1+2 and U1+2+8; OST, O3+4 and O3+4+8. We used the
Mann-Whitney U test of Statistica 9 software to compare the groups of loci inside and
outside for each category, and to analyze the differentiation of all loci of each
chromosome in the different categories.
chromosome in each population was quantified with the multiallelic version of
Lewontin’s D’-statistic, D’m=Σij piqi|D’ij| (LEWONTIN 1964) using the software
PowerMarker version 3.25 (LIU and MUSE 2005). Statistical significance was
evaluated using the Fisher exact test implemented in PowerMarker. The P-values
were obtained with 10000 permutations (Markov chain Monte Carlo gave similar
results) and adjusted for multiple comparisons.
The specific LD patterns between microsatellite alleles and chromosomal
arrangements was calculated with an interallelic disequilibrium measure (D’ statistic)
between multiallelic markers implemented in MIDAS (GAUNT et al. 2006). The
significance was measured using a Chi square (χ2
) with Yates correction. Only the
significant associations after the correction were represented. The chromosomal
arrangements with a frequency of less than 5% in a population were not analyzed to
avoid the detection of singletons. In the same way, for a significant association
between microsatellite alleles and inversions, only the alleles that appeared more than
5.RESULTS
5.1. Population Variability
The populations differ in their genetic diversity according to their
geographical localization on both levels of biological organization: inversion
polymorphisms and microsatellite loci (Figure 3). The two Southern European
populations, Barcelona and Mount Parnes, were the most variable for microsatellite
loci (Table 2) both in allelic richness (mean value of 16.51) and gene diversity (mean
value of 0.83) (see Figure 3B and 3D, respectively). For these molecular markers,
although the two Northern European populations - Drøbak and Sunne - had
significantly lower values of allelic richness (12.08 and 11.09, respectively) relative to
both Southern populations (Wilcoxon Match Pairs Test, P < 0.0003 for all population
comparions), their gene diversity (or expected heterozygosity) was relatively similar
(mean He = 0.8 for the Northern populations vs. mean He = 0.83 for the Southern
populations). The colonizing population, Bellingham, was the less variable for the
microsatellite loci and presented both a significantly lower allelic richness (mean
value of 5.52) (Wilcoxon Match Pairs Test, P < 0.000002 for all population
comparisons) and gene diversity (He = 0.71; Wilcoxon Match Pairs Test, P < 0.0002
for all population comparisons) relative to Europe.
The patterns of inversion variability were measured considering each
chromosome as a locus and each arrangement as an allele (Figure 3). The populations
of Barcelona and Mount Parnes had the highest values of allelic richness (averages of
4.89 and 4.74, respectively; here allelic richness refers to number of arrangements per
and He for their inversion polymorphism. However differences in allelic richness
between Northern and Southern locations were not statistically significant (Wilcoxon
Matched Pairs Test (W), P > 0.05). However, differences were statistically significant
when comparing Barcelona vs. Northern European populations for He (W, P < 0.05).
Bellingham also presented lower, although not significant, allelic richness in
comparison with the Southern European populations i.e. its values of allelic richness
were identical to those of the two North European populations (average of 3.36;
Figure 3A). The Bellingham population, on the other hand, had similar expected
heterozygotes for their inversions as the two South European populations (He = 0.56;
Figure 3C) and significantly higher values of He relative to the two Northern
European populations (W, P < 0.05 for both population comparisons). That is, in spite FIGURE 3.- Variability of the inversion polymorphism (A and C) and the microsatellite
loci (B and D) in each population. The variability is measured on their allelic richness
of Bellingham having roughly the same number of different chromosomal
arrangements as the North European populations, their frequencies were intermediate
as happens in the South European populations.
Analysis of the genetic diversity patterns for each chromosome - that is, the
genetic diversity for the microsatellite loci that mapped in each chromosome –
showed that the genetic composition of all European chromosomes were significantly
different from the colonizing in their allelic richness (W, P <0.05) and in the expected
heterozygosity only for the A and O chromosomes (W, P < 0.05) – see Table 2. There
were also significant differences in allelic richness for the A chromosome between the
Southern populations (Barcelona and Mount Parnes) and the Northern populations
(Drøbak and Sunne) (W, P < 0.05), and on the O chromosome for both Southern
populations and Sunne (W, P < 0.05).
The levels of microsatellite loci variability also differed between the sex (A)
and autosomal (J, U, E and O) chromosomes in Europe and North American
populations (Table 3). While A chromosomes were more variable than autosomes in
European populations (particularly for He, Mann-Whitney U Test, P < 0.05 for all
populations), the North American population had slightly higher variability for the
autosomal chromosomes, although differences were not statistically significant
5.2. Population Differentiation
Significant genetic differentiation (measured through FST values) between the
European and the colonizing population was found for microsatellite loci (Figure 4B).
Likewise, genetic differentiation was also found between Northern and Southern
European populations for most chromosomes, with the loci in the U chromosome
showing the largest genetic differentiation between them. In contrast, we found
almost absence of genetic differentiation between the two Northern or the two
Southern populations (Figure 4B).
TABLE 2 – Genetic variability of the 31 microsatellite loci in all populations
At the chromosomal polymorphism level there were also differences between
populations (Figure 4A and Table 4). The differences in frequency of all
chromosomes arrangements were higher between the Southern and the Northern
populations of Europe than with Bellingham (Figure 4A). In fact, while the
chromosomal polymorphism in the Northern Europe populations was almost limited
to “standard” chromosomes; in contrast, the Southern populations and the colonizing
one had a more balanced polymorphism for all chromosomes (Table 4).
5.3. Genetic content of the chromosomal arrangements
The genetic composition of the different chromosomal arrangements between
the European populations was measured through genetic differentiation values (FST)
between them. The genetic composition of all chromosomal arrangements of
Bellingham was very different from the composition of chromosomal arrangements of
Europe for all pairwise comparisons of populations due to the founder effect. Since
our question was if there were differences in the genetic content of the chromosomal
arrangements between populations possibly at mutation-drift equilibrium, Bellingham
was excluded from this analysis to avoid any bias in the results.
TABLE 3 - Differences of sex and autosomal chromosomal microsatellite variability in Europe and North American populations
Mean values of variability ± Standard error. Mann-Whitney U test; ns P>0,05, *
The analyses of genetic differentiation (FST) were done for all pairs of
comparisons between arrangements of the same chromosome and grouped in
threecategories: i) the same chromosome arrangement in different populations, ii)
different chromosome arrangements in the same population, and iii) different FIGURE 4.- Genetic differentiation (FST) of the chromosomal polymorphism (A)
and microsatellite loci (B) for each chromosome by pair comparisons of populations. The populations are named as BCN (Barcelona), MP (Mount Parnes), D (Drøbak), S (Sunne) and B (Bellingham). The asterisks (*) represent the comparisons that were significantly different after Bonferroni correction
chromosome arrangements in different populations (Figure 5). These three categories
were subdivided according to the microsatellite loci that mapped inside the inversion
(white), outside the inversion (black) and all the loci localized in the chromosome
(gray). The A chromosome presented low genetic differentiation in the three
categories (Figure 5A) and no significant differentiation between the loci inside and
outside the inversions was observed (Mann-Whitney U Test, P > 0.05). Chromosomes
J, E and O had the same pattern of genetic differentiation (Figure 5B, 5D and 5E).
There was very low genetic differentiation in the same chromosomal arrangement TABLE 4 – Chromosomal arrangement frequency in four European
along the different European populations, both in the loci inside and outside, and no
significant differentiation between them (P >0.05). On the other hand, there was high
genetic differentiation between the different inversions in the same population for the
loci inside the arrangements of the J, E and O chromosomes. In contrast, the
microsatellite loci outside the arrangements presented low differentiation and were
significant different from the loci inside (P <0.05 for J and O chromosomes; P <0.001
for the E chromosome). The pattern of genetic composition in different arrangements
for different populations was the same as before: high differentiation for the loci
located inside the considered inversions, low differentiation for the loci outside, and
significant differentiation between the two groups of loci (P <0.001 for J chromosome
and E; P <0.01 for the O chromosome). So, for the J, E and O chromosomes the same
chromosome arrangements in different populations were more similar between them
than different arrangements in the same population for the microsatellite loci that
mapped inside the arrangements. Nevertheless, the microsatellite loci that mapped
outside the arrangements always presented low genetic differentiation. The U
chromosome showed an opposite scenario (see Figure 5C): the loci inside the
arrangement had high genetic differentiation between the same arrangement in
different populations and these loci were significant different from the loci located
outside the arrangements (P <0.001) which presented low differentiation. Moreover,
in the U chromosome, the loci inside the different arrangements were genetic
differentiated in the same population, however were not significantly different from
the loci outside (P >0.05). As for the different arrangements in different populations,
loci located inside the inversion presented significant differentiation and there was
significant genetic differentiation between the loci inside and outside the inversions
5.4. Linkage Disequilibrium
Analyses of linkage disequilibrium between the neutral molecular markers and
the chromosomal arrangements were conducted to increase the knowledge of the
genetic content of the different chromosomal arrangements in the different FIGURE 5.- Genetic differentiation (FST) of the arrangements of each chromosome.
The pairs of comparisons between arrangements of the same chromosome and grouped in three categories: i) the same chromosome arrangement in different populations, ii) different chromosome arrangements in the same population, and iii) different chromosome arrangements in different populations. These three categories were subdivided according to the microsatellite loci that mapped inside the inversion (white), outside the inversion (black) and all the loci localized in the chromosome (gray). The error bars represent the standard error. Asterisks (*) represent the significance difference between the loci inside and outside of each category, and the differentiation of all loci of each chromosome in the different categories (Mann-Whitney U test; * P<0,05, ** P<0,01, *** P<0,001).
populations of D.subobscura and the evolutionary forces behind it. Non-random
association between the microsatellite loci and chromosomal inversions was analyzed
through the multiallelic version of Lewontin’s D’ – statistic (LEWONTIN 1964) (see
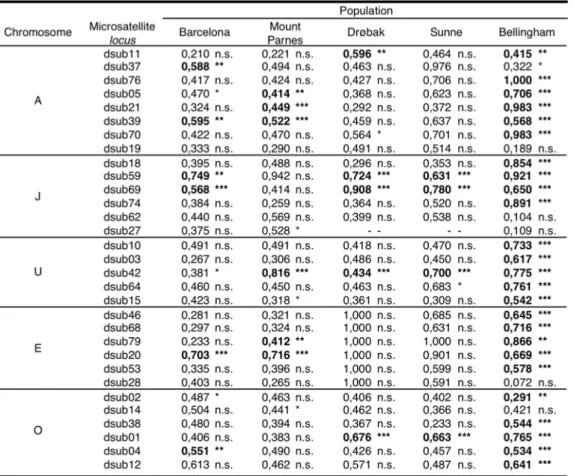
Table 5). The general pattern for the five chromosomes was significant linkage
disequilibrium (LD) for the markers localized inside the arrangements in the case of
the Old World populations; and significant LD along all chromosomes for the New
World population (Table 5 and Figure 2). For the A chromosome, Barcelona and
Mount Parnes had significant LD in all markers located within the inversion A2 with
the exception of dsub21 in Barcelona ( Fisher’s Exact tests, P < 0.05; Table 5). As for
the two Northern populations, no LD was detected for chromosome A in Sunne,
probably due to the high frequency of Ast arrangement in that population (Table 4). In
Drøbak, presenting also a significant proportion of A1 (Table 4) significant linkage
disequilibrium (D’m) was observed for the locus most proximally located within this
inversion (Table 5).
For chromosome J in the populations of Barcelona, Drøbak and Sunne, very
significant D’m (Table 5) were observed for loci inside the inversion J1 (dsub59 and
dsub69), and non-significant LD for the loci outside the inversion, even in the ones
nearby the inversion (dsub18 and dsub74). Nevertheless, no significant LD was
observed in those loci for Mount Parnes, and only locus dsub27 presented significant
LD although it is located towards the telomere and not within any inversion.
Similarly, the marker located inside the arrangements U1+2 and U1+2+8 (dsub42) had
significant LD with the chromosome U for all European populations. For
chromosome E, locus dsub20, located inside the different arrangements, presented
populations. The pattern of LD for O chromosome was not as clear as described
above for the other chromosomes probably because this chromosome has multiple
arrangements (Table 4). The two Southern populations had significant LD (P <0.05;
Table 5) in markers located inside the inversion O7, dsub02 for Barcelona and dsub14
for Mount Parnes. The Northern had strong LD on dsub01 that is positioned inside the
inversion O6 (P <0.001; Table 5)
The former analysis gave a general picture of LD patterns between the
microsatellite markers and the chromosomes. Nonetheless, the specific chromosomal
arrangements that were in LD with those markers, and the microsatellite alleles TABLE 5 - Linkage disequilibrium between microsatellite loci and chromosomes -
D’m
Fisher’s Exact test * P<0,05, ** P<0,01, *** P<0,001. The significant values after the Bonferroni are in bold.
involved on it remained unanswered. For that, it was applied an interallelic
disequilibrium measure between microsatellite alleles and chromosomal arrangements
(Table 6).
TABLE 6 - Interallelic disequilibrium (D’) between microsatellite alleles and
chromosomal arrangements
Note: Only microsatellite alleles (in bp) presenting significant D’ coefficients with inversions are shown (χ2Yates correction, P<0.05).
The Southern European populations had significant LD between inversion A2 and
allele 277 (bp) of locus dsub39 (D’ =1 in Barcelona and D’ =0.65 in Mount Parnes,
with both P <0,001) that is located near its distal breakpoint (Figure 2). In the TABLE 6 - Continued
Note: Only microsatellite alleles (in bp) presenting significant D’ coefficients with inversions are shown (χ2Yates correction, P<0.05).
proximal breakpoint of inversion A2 there was also LD in Barcelona and Mount
Parnes although different alleles were implicated (locus dsub05; see Table 6).
Interestingly, in Drøbak all loci inside inversion A1 presented significant LD with this
arrangement (Table 6), which had more than 20% frequency in the population (Table
4). Bellingham presented significant LD for almost all loci analyzed with the
arrangements AST and A1 sometimes with several alleles of the same locus in
disequilibrium.
All populations presented significant LD patterns between JST and two loci
(dsub59 and dsub69) located within the J1 inversion (Table 6). Remarkably, the
microsatellite alleles in disequilibrium with JST were the same across populations for
locus dsub59 (allele 245 bp), and along Barcelona, Drøbak and Sunne for locus
dsub69 (allele 143 bp). In the same way, E and O chromosomes presented significant
LD values between markers located inside the inversions and their “standard”
chromosomes for the same allele on different populations (Table 6). Barcelona,
Mount Parnes and Bellingham had allele 255bp of dsub20 in LD with EST; Barcelona
and Mount Parnes had alleles 196 and 198bp of dsub04 (mapped inside the
arrangement O3+4) in LD with OST; and finally, Mount Parnes and the two Northern
populations had allele 263bp of dsub01 (mapped inside the inversion O6) in LD with
OST. Like the other chromosomes, U had higher levels of LD in a marker located
inside the arrangements (dsub42), however the alleles presenting significant LD with
different arrangements differed between populations (Table 6).
It is curious to note that the alleles responsible for the LD patterns with all the
chromosome’s inversions (except for chromosome J) in Europe and the North
for that colonizing population the association between alleles and inversions was
6.DISCUSSION
The native Palearctic fly Drosophila subobscura spans more than 30º latitude
in the Old World: from North Africa to Scandinavia, where well-documented, stable
latitudinal clines in inversion frequencies have been described (KRIMBAS and POWELL
1992). Shortly after the two non-independent colonization events of North and South
America (PASCUAL et al. 2007) the species developed parallel latitudinal clines
reinforcing the idea of an adaptive role of the chromosomal inversion polymorphism
on the establishment of the clines (AYALA et al. 1989; PREVOSTI et al. 1988).
Furthermore, it has been shown that changes in frequency of these polymorphisms are
responding to global climate warming (BALANYA et al. 2006). However, the selective
mechanisms involved in the maintenance of chromosomal polymorphisms are still a
matter of dispute, being the two main hypothesis the coadaptation sensu Dobzhansky
(DOBZHANSKY 1950) and the local adaptation by Kirkpatrick and Barton
(KIRKPATRICK and BARTON 2006).
6.1 Patterns of Genetic Variability and Differentiation
The European populations differ in their microsatellite loci variability
according to their latitudinal localization (Figure 3). The Southern European
populations were more variable in their allelic richness than the Northern European
ones, but did not differ in their expected heterozigosity. This difference between
allelic richness and He is a classic pattern of a population bottleneck (NEI et al. 1975).
After a bottleneck it takes more time to a population to recover their ancestral number
depend on the severity of the bottleneck and the subsequent intrinsic rate of growth,
but the number of alleles depends on the mutation rate to generate new alleles. The
decrease of variability towards North was probably due to a postglaciar expansion,
where the Southern peninsulas acted as “variability refuges” (HEWITT 2000).
Furthermore, the smaller effective population size in the Northern localities, due to
their marginal location relative to the distribution area of the species, can also
contribute to this reduced genetic variability. Significant molecular genetic
differentiation between the Southern and Northern European populations was found
for almost all chromosomes, being particularly high for chromosome U (Figure 4B).
This result could be a byproduct of the genetic composition of the chromosomal
arrangements in different populations (see below). At the inversion polymorphism
level, the Northern European populations consistently presented lower level of
variability when compared to the Southern ones, particularly for He (Figure 3A and
3C). Furthermore, the frequencies of arrangements between South and North of
Europe were very distinct (Figure 4A). This is caused by the well-defined cline of
inversion frequencies in Europe (KRIMBAS and POWELL 1992).
Patterns of molecular genetic variability in the Bellingham population clearly
show the effects of the colonization event of the North American continent (Figure 3).
Due to this event, both allelic richness and He were reduced relative to the ancestral
populations at the microsatellite level but only reduction in allelic richness for
inversions. Despite Bellingham being localized in the extreme north of the cline in
North America, it did not present the same pattern of reduction in chromosomal
variability as the North European populations. This is explained by the fact that the
North America cline is not so steep as the European one (BALANYA et al. 2003).
frequencies (low allelic richness and high He, respectively Figure 3A and 3C), and as
a result was less different in the arrangement frequency from the Southern European
populations than were the Northern European populations (Figure 4A). Furthermore,
this colonizing population presented significant genetic differentiation at the
microsatellite level relative to all other ancestral populations, as a consequence of the
founder event associated with colonization of North America (Table 2 and Figure
4B), in agreement with previous studies (PASCUAL et al. 2001, 2007). Interestingly,
the genetic differentiation of Bellingham was larger with the Northern than the
Southern European populations both at the microsatellite and inversion level. This is
in agreement with the previously suggested Mediterranean origin of the colonizers
(BRNCIC et al. 1981; PASCUAL et al. 2007). Furthermore the higher similarity with the
Barcelona population points to a more probable western Mediterranean origin of the
colonizers (Figure 4).
The lower genetic variability for the sex-linked loci relative to autosomal ones
in Bellingham (Table 3) are also a consequence of the bottleneck. The sex
chromosome has a smaller effective population size than the autosomes (males have
only one copy; NeX=3/4 NeA), and consequently after a bottleneck it takes more time to
recover its genetic variability. However, the ancestral populations were more variable
in the sex-linked loci, which is consistent with the background selection model
(CHARLESWORTH et al. 1993), in which the neutral markers linked to the deleterious
alleles are purged from the population. In a heterogametic system recessive
deleterious mutations are removed more efficiently from the sex chromosome,
because there is less chance for recombination to combine different neutral alleles
model, the ancestral populations have more neutral variation on the sex chromosome,
as also observed in other Drosophila species (e.g. (KAUER et al. 2002).
6.2. Genetic Composition of Chromosomal Arrangements: Different Histories for Different Chromosomes
Two main hypotheses were proposed to address the selective mechanisms
underlying inversion polymorphisms: the coadaptation sensu Dobzhansky
(DOBZHANSKY 1950) and the local adaptation model (KIRKPATRICK and BARTON
2006). The coadaptation model has two outputs about genetic variation on the
chromosomal arrangements: genetic differentiation among different chromosomal
arrangements and genetic differentiation within a chromosomal arrangement among
populations. Instead, the local adaptation model does not have chromosomal
population-specific properties. So, the genetic content would remain constant in the
same arrangement across populations. We tested these predictions in our dataset.
Unexpectedly, we did not observe a general pattern of genetic composition of
the arrangements in all chromosomes that could be explained by one of these
hypotheses. In fact, our data revealed distinct evolutionary mechanisms for the
patterns of European chromosomes in respect to the maintenance of their
polymorphisms. This observation in itself contradicts previous indications that the O
chromosome is representative of all chromosomes in D. subobscura (SANTOS 2007).
Chromosome A was the only chromosome that did not present a pattern of
arrangements genetic composition predicted by any of the aforementioned hypothesis
other in the same or in different populations, independently of the loci being inside or
outside the inversion. Different non-exclusive processes can cause the lack of genetic
differentiation between arrangements. First, this chromosome had high variability on
the ancestral populations (Table 2) probably due to background selection, as discussed
above. Consequently, this high variability might generate homoplasy in the allele
distribution and thus obscure possible genetic differences. Alternatively, genetic
exchange between arrangements can contribute to reduce genetic differentiation as
reported between the A2/AST arrangements (NOBREGA et al. 2008). Despite the
genetic exchange found by Nóbrega and collaborators they also detected strong
genetic differentiation between arrangements in markers inside the A2 inversion.
However, this observation does not contradict our results in the sense that this study
used a colonizing population and isolated from the continent, from the island of
Madeira (KHADEM et al. 1998)). Similarly, in our data there was high genetic
differentiation between A2/AST in the colonizing American population (Bellingham,
FST=0,33), that in a certain way could be compared with the result mentioned above:
the bottleneck effect may possibly increase the genetic differentiation between
arrangements.
In spite of the arrangements of chromosome A did not differ genetically
between them as well as the loci inside and outside the inversions, the LD patterns
relative to the inversions presented significant differences across loci (Table 5 and 6).
Exclusively the markers inside the inversions presented non-random association with
chromosome A (Table 5). Markers located outside of the inversion but near its
breakpoints (dsub76 and dsub70) did not present significant LD, making the
inversion’s origin as the cause for the LD (“founding” disequilibrium, see below) less
alleles (D’, Table 6). The Southern European populations had clear indications of LD
in inversion A2, especially in Mount Parnes.The same allele of locus dsub39, which is
located near its distal breakpoint, presented LD with A2 on both Southern populations.
The locus located near the proximal breakpoint of inversion A2 also presented LD in
Barcelona and Mont Parnes although different alleles are involved. Moreover, a locus
located in the center of the A2 inversion (dsub21) also presents significant LD in
Mount Parnes. The inversion A2 is typical of the Southern populations, so the strong
LD observed could be caused by selection acting on genes nearby those loci,
especially in the distal region. Inversion A1 is common in Northern latitudes and their
frequencies increased in North Atlantic European populations (BALANYA et al. 2004).
Therefore, the strong LD observed in Drøbak between inversion A1 and the loci
localized inside it might be a selective sweep on inversion A1 in the northern
populations.
The patterns presented by chromosomes J, E and O were in accordance with
the local adaptation hypothesis (see Figure 5B, 5D and 5E). The genetic content of
each chromosomal arrangement remained constant at a wide range of geographical
distribution and for all loci whether inside or outside the inversions. Previous studies
also observed no evidence for geographic differentiation for a given chromosome O
arrangement (ROZAS and AGUADÉ 1990; ROZAS et al. 1995, 1999). Moreover, in the
same population loci located inside the inversion were highly differentiated between
arrangements. Therefore the gene arrangements had their own “identity” across
Europe. A neutral hypothesis might have the same pattern of non-differentiation of
the same arrangement, in the sense that each inversion had a monophyletic origin
(POWELL 1997) and will originate gene-inversion disequilibria for all polymorphic
there is evidence for genetic exchange (gene flux) between different chromosomal
arrangements through gene conversion and/or double crossovers (MUNTE et al. 2005;
NOBREGA et al. 2008; ROZAS and AGUADÉ 1990,1994; ROZAS et al. 1999), and gene
flow between populations (PASCUAL et al. 2001). Both gene flux and gene flow were
supported by our data. In the first case, there was no genetic differentiation in the loci
located outside the inversion between different arrangements in the same population.
Secondly, in the same line of reasoning, the loci outside the inversions were not
genetically differentiated between different populations whether it was in the same or
in different arrangements (Figure 5). In spite of all gene flux and flow the
chromosomal arrangements “identity” was kept. So, strong selection must be invoked
in order to counterbalance these aforementioned homogenizing processes and thus
contributing to the maintenance of the existing latitudinal clines in these chromosomal
inversions
The LD analyses for chromosomes J, E and O were in accordance with the
local adaptation scenario. Non-random association between chromosomal
arrangements and microsatellites was almost exclusive for the loci inside the
inversions, whether those were near the breakpoint or in the center of the inversion. In
general, the loci localized outside the inversions did not have significant LD with the
arrangements, even those near the inversion breakpoint – the most striking being
dsub74 on chromosome J – ruling out, once again, the “founding” disequilibrium
effect. The same LD pattern across populations, that is involving the same
microsatellite alleles with the same chromosome arrangement such as for locus
dsub59 and the JST inversion (Table 6), suggests that the genetic composition of the
arrangements was maintained by selection. As (LEWONTIN 1974) said: “The
populations is a very sensitive detector of natural selection”. Therefore, our
hypothesis that selection through a local adaptation process has been holding the
genetic content of the chromosomal arrangements of J, E and O became more robust.
Remarkably, the classical association studies between allozymes and inversions in
D.subobscura made on the 70’s also presented a consistency of the LD patterns in
different populations for chromosomes E and O (LOUKAS and KRIMBAS 1975;
LOUKAS et al. 1979; ZOUROS and KRIMBAS 1973); it is interesting that some of this
allozymes mapped nearby the microsatellite loci that were in LD: Est-9 is close to
dsub20 on chromosome E and, Lap to dsub01 and Acph to dsub04 on chromosome O.
In fact, it seems that the local adaptation mechanism is widespread through the
genus Drosophila: D.pseudoobscura and D.persimilis (PRAKASH and LEWONTIN
1968, 1971), D.pseudoobscura (SCHAEFFER et al. 2003) and D.melanogaster
(KENNINGTON et al. 2006) presented similar genetic composition for the same
arrangement irrespective of the geographic localization. Nonetheless, these studies
claimed evidence for coadaptation since they observed epistatic selection within
inversions (on the statistical sense, view (PHILLIPS 2008)) and genetic differentiation
between different arrangements. Yet, epistatic selection and genetic differentiation
between gene arrangements do not rule out the local adaptation mechanism
(KIRKPATRICK and BARTON 2006; SANTOS 2009).
The genetic pattern of European U chromosome was distinct from the other
chromosomes (Figure 5C). The genetic composition inside the inversion of the same
arrangement was largely dissimilar across Europe populations. The arrangements of
chromosome U had population-specific properties (genetic compositions) in the Old
World. Even with genetic exchange and migration, as before, detected by no