E
FFECTSA
SSOCIATED WITHI
NDEXC
OMPOSITIONC
HANGES:
E
VIDENCE FROM THEE
URONEXTL
ISBONS
TOCKE
XCHANGEJoão Duque ††
ISEG - Instituto Superior de Economia e Gestão Universidade Técnica de Lisboa
Rua Miguel Lupi, 20, 1249-078 Lisboa, Portugal Tel. +351 213925800
Email:jduque@iseg.utl.pt
Gustavo Madeira
ISEG - Instituto Superior de Economia e Gestão Universidade Técnica de Lisboa
Rua Miguel Lupi, 20, 1249-078 Lisboa, Portugal Tel. +351 213925800
Email: gustavo-madeira@clix.pt
Contact author: João Duque
†† Financial support granted by the Fundação para a Ciência e a Tecnologia (FCT) is gratefully
EFFECTS ASSOCIATED WITH INDEX COMPOSITION CHANGES: EVIDENCE FROM THE EURONEXT LISBON STOCK EXCHANGE
ABSTRACT
According to previous studies in many other markets, changes in a stock market index composition have shown abnormal returns are available at the date when index changes become effective. Stocks (added or deleted) tend to generate abnormal returns. But as market microstructure and stock index governing rules differ from country to country and from index to index, studies on previously unstudied markets are relevant
This study examines the stock reaction that occurs when shares are added to or deleted from the Euronext Lisbon stock index PSI-20, studied in terms of abnormal returns. And although the vast majority of papers in the literature are concerned with price effect and volume effect, this study also focuses on the trading volume and on the volatility effect.
Although the rules governing the PSI-20 index are publicly available, the market seems to be surprised when announcements of composition change are released. Stock price returns react positively for additions to and negatively for deletions from the index. All these observed effects are evident for the time period between the announcement day and the effective day of the change. When the effective day of the change arrives, the market still reacts to stock additions to the index, decreasing significantly the price that was being raised until then, in what may be a sign of a previous overreaction when the announcements were made.
It also reacts in terms of trading volume. A positive abnormal trading volume is observed after additions to and deletions from the index, with some persistency after the event.
The volatility effects do not seem to be statistically significant.
All statistically significant findings on price returns seem to be temporary which lends itself to the empirical support for the price pressure hypothesis. However, the empirical evidence of a persistent increase in trading volume either for additions to or for deletions from the index becomes a puzzling and contradictory support for the liquidity hypothesis.
JEL Classification: G11, G12, G14.
Keywords: Stock index revisions, index composition, price and volume effects, event study, abnormal returns.
1. Introduction
Several studies document that changes in a stock market index composition have an impact on different stock characteristics such as price returns, trading volume, bid-ask spread or even volatility. These changes may be observed either when they are announced or when they become effective. If markets are at least semi-strongly efficient and stock index governing rules are publicly available there is no reason for such effects. However, there have been suggestions for theoretical explanations and a lot of empirical evidences on the subject for different capital markets. But as market microstructure and stock index governing rules differ from country to country and from index to index, studies on previously unstudied markets are still relevant.
The vast majority of the papers on the subject were developed on the US market although others have done similar studies using markets such as Australia, Canada, Finland, France, Germany, Hong Kong, India, Indonesia, Italy, Japan, Malaysia, New Zealand, Norway, Philippines, Singapore, South Korea, Spain, Sweden, Taiwan or Turkey. Until now, no studies have been conducted on the Portuguese stock market.
This study examines the effects that occur when stocks are added to or deleted from a stock market index, particularly the most notorious index representative of the Portuguese Stock Market (PSI-20), an index composed of the 20 most frequently traded blue-chip stocks.
Most of the papers on this subject report the existence of stock market inefficiencies using different variables but primarily using stock price returns as the key variable for study. This study will focus on the index replacement effects upon several variables such as price returns, trading volumes and volatility, in order to determine the magnitude of the impact and the timing during which these effects can be observed.
Using data from 1996 to 2001 and analysing three different sub-periods we started by providing evidence that deletions are associated with negative price effects while additions are associated with positive price effects. Second, we found that investors do not wait until the effective date of index change to rebalance their portfolios. Third, the market seems not to anticipate additions, while deletions show clear anticipation signs. Fourth, the behaviour of additions to and deletions from the index can be explained by the price pressure hypothesis.
Fifth, trading activity increases permanently after the change either for additions or for deletions which is puzzling and contradictory to the liquidity hypothesis. Finally, the findings suggest that the Portuguese stock market is not efficient even in its semi-strong form. However, based on the analysis of sub-periods, we concluded that some improvement was observed in terms of efficiency.
The study proceeds as follows. The second section describes the literature review and the explanations given by researchers for the effects observed during a revision of the index composition. The third section describes the methodology used and in Section 4 we describe the dataset. In Section 5 the results are presented and we conclude with Section 6.
2. Literature Review
Since Shleifer (1986) and Harris and Gurel (1986) who examined the effects associated with the changes in S&P500 index composition, this subject has been widely studied, mainly in the United States stock market. Although the topic that we cover in this paper is a result of an empirical finding, the literature on the subject, apart from describing or rejecting the empirical effects of index composition, is also concerned with plausible explanations for the phenomena. We will first introduce what we found as possible explanations for the effect and then we will present the literature on the empirical findings.
2.1. Explanation hypothesis
Several hypotheses have been proposed in the literature in order to explain why traded stocks should present some changes in their patterns if they are simply added to or deleted from the list of equities that are included in stock indexes. These changes are not exclusively related to stock price behaviour, being possibly extended to trading volumes or even other characteristics such as spreads, stock price return distributions, etc.
Although a very significant number of authors present a vast number of explanations, they can be summarised as five major explanation hypotheses.
The price pressure hypothesis (due to downward sloping short run demand curves) suggests that changes in index composition have consequences on demand and trading
activity. However, these effects should rationally be temporary and might be related to the action of index funds when trying to minimise the tracking error of managed portfolios. In this case, in the long run, the effect is expected to vanish.
The imperfect substitutes hypothesis (due to downward sloping long run demand curves) suggests that when the indexers buy stocks, the number of available shares to be traded (free float) tends to reduce. Therefore, the market price of the stocks should increase if the long-term demand curve is downward sloping and if it is not affected by the price insensitivity to the demand behaviour of the indexers. Under the imperfect substitutes explanation hypothesis the effects reported should be permanent because the new price (after the announcement) shows a new equilibrium distribution for the stock price. This means that equilibrium prices change when demand curves shift to overcome the excess demand.
The liquidity or information cost hypothesis states that the effects shown are due to the change in the general costs related to trading as a result of a persistent increase in the stock trading volume when stocks are added to indexes. The hypothesis is based on the assumption that investors demand a premium for holding stocks with higher trading costs or with less available information. As trading volume should increase when stocks are added to reference indexes, a reduction in volatility and in bid/ask spread should be observable. Therefore, this hypothesis predicts a decrease in the stocks’ trading costs and an increase in stock prices for stocks just added to the index. Amihud and Mendelson (1986) were the first to formalise the liquidity hypothesis deriving the asset returns function as a concave and increasing function of the bid-ask spread.
According to the information hypothesis (or attention hypothesis or certification hypothesis or shadow cost hypothesis) it is assumed that all investors know the basic structure of security returns. The deletion from or the addition of a stock to the stock market index provides new information to the stock market regarding its future prospects. Under these assumptions an addition is considered good news, while a deletion is bad news. An example of this situation occurs when a stock is added to an index. When added to an index the stock increases its value just as a result of belonging to the stock market index (a comparison can be drawn made with a soccer team that reaches the premier league). The newly added stock (or company) will have closer scrutiny by analysts and will be the subject of greater attention from institutions and the media. This should lead to a lower risk associated with the
information availability and accuracy. Therefore, when stocks are added to the index more investors are aware of its existence and, as a consequence, the required rate of return should fall due to the decrease in non-systematic risk. According to this hypothesis the effects reported are expected to be permanent.
This hypothesis finds its roots in Merton (1987), who developed the theory of equilibrium pricing with incomplete information.
According to the selection criteria hypothesis the effects are due to the selection criteria used to determine the index composition. The effects detected in an index composition change are due to the underlying fundamentals of the stocks themselves. Therefore, when stocks are added to the index this is a good sign because they should be the result of stronger fundamentals, with a stronger historical performance. Prices should then react accordingly, showing an increase in market capitalisation.
In Annex 1 we present a table which relates each paper to its corresponding supported hypothesis.
2.2. Empirical Findings
Since Shleifer (1986) and Harris and Gurel (1986) presented the conclusions of their studies on the changes in composition of the S&P500 index, a vast number of studies were developed on the subject. The majority of the studies were developed using data from the American stock market and particularly the S&P500 index. The list of papers presenting empirical findings on the subject for the American market is extensive: Shleifer (1986), Goetzmann and Garry (1986), Harris and Gurel (1986), Woolridge and Gosh (1986), Lamoureux and Wansley (1987), Jain (1987), Pruitt and Wei (1989), Dhillon and Johnson (1991), Edmister et al. (1994 and 1996), Beneish and Gardner (1995), Collins et al. (1995), Beneish and Whaley (1996), Lynch and Mendenhall (1997), Coopers and Woglom (2002) and Chen et al. (2002).
More interesting is to notice that only after 1997 we find empirical literature covering other markets. And if for more than one decade there was only literature for the American market (from 1986 to 1997) since then, the empirical literature is mainly devoted to covering other non-American markets: Chung and Kryzanowski (1998), Liu (2000) and Hanaeda and
Sarita (2003) studied the Japanese market; Brealey (2000) covered the English market; Deininger, Kaserer and Roos (2000) studied the German market; Elayan, Li and Pinfold (2001) observed the New Zealand market; Bechmann (2002) examined the Danish market and Bildik and Gulay (2001) considered the Turkish market (please refer to Annex 2 where a summary table presents all the relevant empirical literature).
All except one of those papers refer to a single market, leaving room for new studies where interrelated phenomena can be explored, since Chakrabarti et al. (2002) provided the first international study. They examined the MSCI Country Indexes from 1998 to 2001 and monitored 19 countries measured by the changes in the indexes: Australia, Canada, Finland, France, Germany, Hong Kong, India, Indonesia, Italy, Japan, Malaysia, Norway, Philippines, Singapore, South Korea, Sweden, Taiwan, United Kingdom and the United States.
In terms of sampling time window the vast majority of the studies used data covering between 5 to 10 years. Exceptions to this are the studies of Beneish and Gardner (1995) who used 60 years of the DJIA (Dow Jones Industrial Average), Chen et al. (2002) who used 45 years of the S&P500, Coopers and Woglom (2002) who used 20 years of the same index and Pruitt and Wei (1989) who, also using the S&P500, were the first to break the 10 years barrier of data collection. The international study of Chakrabarti et al. (2002) also use 13 years of data.
Another observation that results from the literature is that while the early studies only concerned the effects resulting from the additions to the index - Shleifer (1986), Woolridge and Gosh (1986), Lamoureux and Wansley (1987), Jain (1987), Dhillon and Johnson (1991), Edmister et al. (1994 and 1996), Collins et al. (1995), Beneish and Whaley (1996) - since the publication of the paper of Lynch and Mendenhall in 1997, almost all studies observe both effects (additions and deletions to the index).
When studying changing index composition the major effects that are observed are the price effect (using abnormal price returns), and the volume effect. Only a small number of studies were devoted to observing effects on other variables such as on the volatility or on the bid-ask spread.
Within the price effect, the literature can be categorised into two major concerns: the short run effect of additions to and deletions from the index as a consequence of the announcement or as a consequence of the effective index change composition, and the long run effect which relates to changes in the index with permanent price consequences.
By far the vast majority of the studies treat the problem of changing index composition from the price effect perspective. The most common finding associates a positive price effect with stocks that are added to the indexes (as in Shleifer (1986), Harris and Gurel (1986), Woolridge and Gosh (1986), Lamoureux and Wansley (1987), Jain (1987), Dhillon and Johnson (1991), Edmister et al. (1994 and 1996), Beneish and Whaley (1996), Lynch and Mendenhall (1997), Chung and Kryzanowski (1998), Deininger, Kaserer and Roos (2000), Barontini and Rigamonti (2000), Liu (2000), Elayan, Li and Pinfold (2001), Coopers and Woglom (2002), Bechmann (2002), Chakrabarti et al. (2002), Chen et al. (2002), Hanaeda and Sarita, 2003) and a negative price effect with stocks that are deleted from the indexes (see Goetzmann and Garry (1986), Harris and Gurel (1986), Jain (1987), Edmister et al. (1994 and 1996), Beneish and Gardner (1995), Lynch and Mendenhall (1997), Deininger, Kaserer and Roos (2000), Barontini and Rigamonti (2000), Brealey (2000), Liu (2000), Elayan, Li and Pinfold (2001), Bechmann (2002), Chen et al. (2002), Hanaeda and Sarita, 2003). However, while Beneish and Gardner (1995) reject the existence of any price effect, Brealey (2000), although finding a positive, in signal, price effect for additions, did not find it statistically significant.
Although, as we saw, there is a huge list of papers concerned with the price effect, only a small number of studies deal with its significant permanency. And while there is a great consensus on the signal and the significance of price effects, opinions split apart when collecting evidence on the time for which price effects are observable. This is particularly relevant because, as seen before, this is crucial for supporting or rejecting some of the explanatory hypotheses. For example, while Lynch and Mendenhall (1997) and Chung and Kryzanowski (1998) found the price effect for additions temporary, Liu (2000), Bechmann (2002) and Chakrabarti et al. (2002) found it permanent. For deletions, the disagreement is also noticeable. While Lynch and Mendenhall (1997) found the negative price for deletions temporary, Liu (2000) and Bechmann (2002) found it permanent.
A second issue concerns the volume effect, that is whether trading volumes of stocks added to or deleted from stock index compositions change significantly. The majority of the papers find a positive volume effect for stocks added to the indexes (as in Harris and Gurel (1986), Woolridge and Gosh (1986), Dhillon and Johnson (1991), Edmister et al. (1994 and 1996), Beneish and Whaley (1996), Lynch and Mendenhall (1997), Chung and Kryzanowski (1998), Deininger, Kaserer and Roos (2000), Liu (2000), Bechmann (2002), Chakrabarti et al. (2002) and Hanaeda and Sarita, 2003) and a negative volume effect for stocks that are deleted
from the indexes (such as Edmister et al. (1994 and 1996), Beneish and Gardner (1995), Deininger, Kaserer and Roos (2000), Bechmann (2002) and Chakrabarti et al., 2002). However, the finding is not unanimous. While Beneish and Gardner (1995) found no significant effect for stocks added to the indexes, Liu (2000) and Hanaeda and Sarita (2003) found a positive effect for stocks deleted from the indexes and Pruitt and Wei (1989), Collins, Wansley and Robinson (1995), Barontini and Rigamonti (2000) or Bildik and Gulay (2001) found a positive volume effect in general not associated with additions to or deletions from the indexes.
Still related to the volume effect is the problem of its permanency. And while Harris and Gurel (1986), Dhillon and Johnson (1991), Edmister et al. (1994 and 1996), Lynch and Mendenhall (1997), Liu (2000), Bechmann (2002) and Chakrabarti et al. (2002) found the volume effect permanent, Beneish and Whaley (1996) and Chung and Kryzanowski (1998) found it temporary1.
As stated before, only a small number of studies are concerned with other variables. For instance, Dhillon and Johnson (1991) and Edmister et al. (1994 and 1996) studied the bid-ask spread (finding a significant reduction in the bid-bid-ask spread associated with stock additions to the S&P500 index), Edmister et al. (1994 and 1996) concluded that stocks added to the index showed higher price volatility when compared to the market in the previous two years before the addition, and Cooper and Woglom (2002) showed a permanent increase in the stock price volatility for stocks that change their status regarding index composition.
3. Methodology
In this study we use the event study methodology firstly suggested by Fama et al (1969) in order to establish a connection between the variables under observation (price, volume, bid/ask spread and volatility) during the event window. The event window is the length of time over which one may observe the stock reaction to the event. It will be defined in reference to the announcement day (henceforth referred to as AD) as well as in reference to the effective day of change (henceforth referred to as ED). It must be pointed out that the
1 Liu (2000) is a particular case because he found a permanent positive volume effect for additions to the S&P500 index, but
window length varies from firm to firm, because the length between AD and ED varies from case to case.
In order to collect additional data to explain the effects detected, the sample was divided according to the following time intervals2:
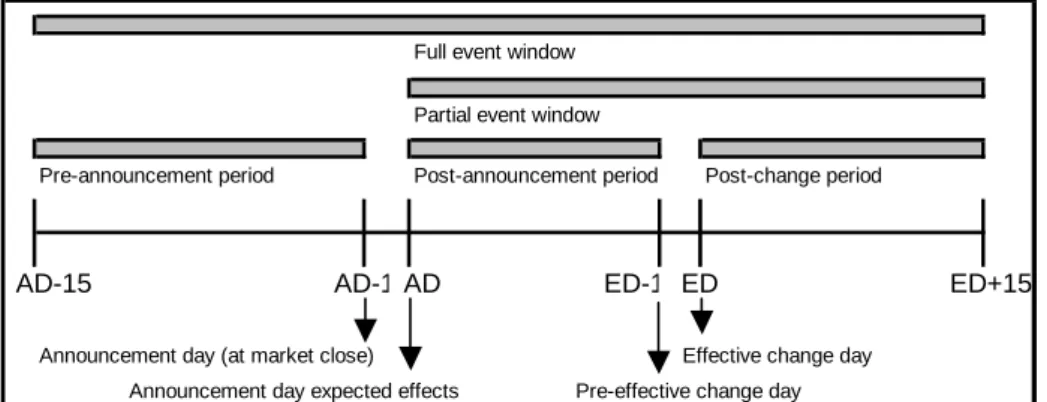
- Pre-announcement period (from AD-15 to AD-1) during which we will test if there is any market anticipation to the index change.
- The announcement day (AD) when it is expected that any stock price reaction to the announcement will be observed. The announcement to the market is assumed to be made on day AD-1 at the close of the market. Therefore the effects from the announcement, if any, are only expected on AD.
- The post-announcement period is defined as the time window between AD to ED-1. This analysis gives the opportunity of following the market reaction from the announcement day until the day before the effective change date.
- On effective change date (ED) the change is assumed to occur at the market opening. - In the post-change period (from ED to ED+15) one can analyse the persistence of the
effects detected.
Additionally, in order to determine whether the effects detected are temporary or permanent the full event window (from AD-15 to ED+15) and the partial event window (from AD to ED+15) are computed.
The time windows under study are summarised in Figure 1. PLEASE INSERT FIGURE 1
3.1. Abnormal return (Price effects)
The abnormal return (AR) in stock i at day t is measured by a market adjusted returns model as defined by equation 13:
2 Previous studies use event windows as short as 10 days and as long as 120 days around the event day. We
m,t i,t
i,t R R
AR = − eq. 1
where, is the instantaneous rate of return of stock i on day t and is the instantaneous rate of return of the market portfolio on day t. The PSI-20 TR (a performance index, based on the PSI-20 index methodology but adjusted for gross dividend payments) is used as a proxy for the market portfolio.
i,t
R Rm,t
The stock price cumulative abnormal return over the event window is calculated by summing up daily abnormal returns over the event window and is called CAR, defined by equation 2.
( )
∑
= = 2 1 2 1; t t t t AR t t CARi eq. 2The average abnormal return (AAR) over the window is the stock CAR divided by the number of days in the window. Additionally, a measure of the abnormal return over the event window can be obtained by taking sample averages of firms’ CAR (ACAR is the CAR averaged through the number of stocks in the sample).
At this point the ACAR must be tested and in order to do so we will use the methodology suggested by Boehmer, Musumeci and Poulsen (1991)4. This test will check whether the null hypothesis of zero abnormal return is rejected. In order to perform the statistical test under the null hypothesis, abnormal returns have to be jointly normal and have a stationary distribution: ) , 0 ( i it N AR ∩
σ
However, in order to perform the test, the first step is to compute the abnormal returns on stock i on the event day t standardised by the estimation period standard deviation (which goes from AD-40 to AD-15).
3 Others papers also report market adjusted returns models such as Bildik and Gulay (2001), Barontini and
Rigamenti (2000), Lynch and Mendenhall (1997) and Beneish and Whaley (1996). More sophisticated models of the return generating process can be used to calculate abnormal returns. However, market models provided similar conclusions when compared to market adjusted returns. As was reported by Edmister et al. (1994) market model coefficients are biased by a selection effect. That is due to the fact that a stock with a significant price increase relative to the market is more likely to be included in an index. Using a post-replacement estimation period Edmister et al. (1994) show that abnormal return seems to be persistent. Therefore, by using market adjusted returns the bias estimation problem can be avoided. Additionally, Jain (1987) observed that the market model parameters are non-stationary across the replacement.
The purpose of standardisation is to ensure that each abnormal return will have the same variance. Since the average is null, by dividing each firm’s abnormal return by its standard deviation the AR is standardised.
i i,t i,t AR SAR σ = eq. 3
The standard deviation σi can be computed by:
(
)
∑
= − − = T t t i AR AR T 1). 1 , ( 1 t i, i σ eq. 4where T represents the number of trading days in the estimation period and ARi,t the
average abnormal return of stock i.
Placing equation 4 into equation 3 and adding a commonly used term in order to adjust the forecast error (adjust the standard error by the prediction error in order to account for the different time horizon), gives equation 5:
( )
∑
= − − + + = T e m me m mt it it R R R R AR SAR i 1 2 2 . ) ( ) ( T 1 1 σ eq. 5where Rm,e stands for the market return on day e of the estimation period and Rm is the average market return in the estimation period.
In the second step, ordinary cross-sectional technique is applied to measure and test the significance of the existence of abnormality. The following t-test is applied to test the hypothesis in which the average standardised abnormal returns (SAR) across firms are equal to zero. 1 2 1 1 − = ∩
∑
n SAR N i it t N SAR N σ3.2. Abnormal trading volume (Trading volume effects)
Trading volume will be defined as the daily turnover of a stock. In order to test the abnormal trading volume the Harris and Gurel (1986) volume ratio (henceforth referred to as VR and represented by equation 6) is used, by linking the firm trading volume to the market trading volume (the PSI-20 is used as a market volume proxy).
m i mt it it V V V V VR = eq. 6
where, represents the average trading volume of stock i during the period from AD-40 to AD-15, represents the average market trading volume during the same time period, represents the trading volume of stock i on day t in the event period and stands for the market trading volume on day t in the event period.
i V m V Vit mt V
In order to isolate the abnormal trading volume in the event period of a change in the index, the VR is computed by averaging the event daily volatility by the estimation period (AD-40 to AD-15).
After the VR is computed it is averaged across the number of stocks in the sample. Assuming that an index replacement has no effect on the trading volume, the liquidity effect can be measured through the analysis of the trading volume per period. If during the event window the daily trading volume is not different from normal, VR equals one. The volume ratio (VR) will also be statistically tested (t-test).
3.3. Abnormal volatility (Volatility effects)
The impact of an index replacement on stock price volatility is also studied. For this purpose the methodology applied by Deininger et al. (2000) will be replicated in the present study.
For every stock in the sample the annual volatility is computed according to equation 7, using 30 days before and after the effective replacement date and announcement date.
[ ]
(
)
2 1 1 1 250∑
= − − = T t it it T i T R E R σ eq. 7Due to the fact that the stock return probably will not be stationary, the sample average of the difference between stock and market volatility (call it abnormal volatility) will be computed using equation 8:
(
)
∑
= − = I i T m T i N AV 1 1σ
σ
eq. 8A statistical test (paired sample test) must be performed in order to evaluate if the effect event has impact on volatility and if the returns have a normal and stationary distribution.
To ensure the robustness of the study a non-parametric test will also be applied and in this case the sign-rank test of Wilcoxon will be used.
4. Sample and data description
The PSI-20 was introduced in 1995. However, it has been computed since 31st December 1992, starting with a base value of 3000 points at that time. The index represents the 20 largest and most liquid share issues selected from the universe of companies listed on the main Portuguese market. The index is used as a benchmark for the equity market and as an underlying index for futures and options.
A Technical Committee defines the index revisions. The meetings of the Technical Committee may be ordinary (periodical) or extraordinary. The Technical Committee meets periodically twice a year, in December and June. The extraordinary meetings take place whenever necessary. The decisions taken by the Technical Committee become effective in the first trading session of the month following the relevant meeting. For the periodic reviews that take place in January and July, a ranking is computed on the basis of data collected on 30th November and 31st May, respectively. The index is subject to interim reviews in January and July. Combining the need for a stable yet flexible sample, the review of the PSI-20 composition is be based on the following rules:
(i) an index constituent will be replaced whenever: a) it is placed below 22nd in the new ranking;
b) it ranks 21st or 22nd and is to be replaced by a non-constituent placed 18th or higher in the new ranking.
(ii) A non-constituent will be included in the index whenever: a) it is placed 18th or higher in the new ranking;
b) it ranks 19th or 20th in the new ranking replacing an index constituent that ranks 22nd or lower.
The waiting list identifies those securities with the highest probability of being included in the index whenever an index constituent needs to be replaced. The waiting list is calculated and published on the first trading day of each month, with the exception of December and June, in which the waiting list is published at the same time as the index portfolio for the following semester, following the Technical Committee’s periodic meeting.
The same selection methodology has been used to select listed stocks since inception until 1st October 2001. On that date, the Portuguese Stock Exchange (formerly BVLP, and Euronext Lisbon since December 2001) decided to modify the selection methodology.
According to the original selection methodology, the stocks were selected based on liquidity and market value. The index calculation follows the traditional Laspeyres methodology for weighted price indexes, according to which the weight of any individual issue reflects the proportion of its capitalisation in the overall capitalisation5. On top of this the PSI-20 is nowadays calculated according to additional restrictions related to the free float and market capitalisation in order to avoid excessive weight for a small number of stocks and the risk of thin trading for some index components.
Daily prices and trading volumes for the stocks included in PSI-20 were collected from Dathis (a Euronext Lisbon database). All prices were adjusted for dividends, stocks splits, rights issues, etc. Euronext Lisbon supplied announcement days (AD), while effective change dates (ED) were determined by the authors (PSI-20 composition analysis).
We started with an initial sample of 70 stocks from which the PSI-20 index was computed over the period comprising January 1996 (Euronext Lisbon could not provide 1995 announcement dates) to October 2001. The sample ended in October 2001 due to the adoption of new selection methodology for the index. The initial sample was reduced to a final sample of 39 events (for a sample description see Annex 3). The screening tests applied consisted of:
- Stocks with an insufficient price history were not accepted in the sample. That is, all the stocks with less than 30 historical price observations before the announcement day were excluded;
- Stocks that were de-listed following the deletion from the index were excluded. Therefore, all deleted stocks with less than 30 price observations after the effective change date were excluded;
- All changes that were related with company name changing, and that suffered spin-off operations or mergers and acquisitions were excluded.
The number of additions and deletions in the final sample and the average number of days between the announcement day and the effective change day of our final sample are presented in Table 1.
In the observation period 17 stocks have been added (and 22 have been deleted) from the PSI-20 index.
PLEASE INSERT TABLE 1
The annual average number of trading days between the announcement day and the effective change day shows a range between 3 and 20 days with a mean of 15,1 days. This number tended to decrease in the later years, particularly in 2000.
The period under study includes the full period (from 1996 to 2001) and five different sub-periods (1996 to 1998; 1999 to 2001; 1996 to 1997; 1998 to 1999 and 2000 to 2001) which were determined by dividing the full period into three parts in order to perform a sub-period variability analysis6.
5. Empirical Results
5.1. Abnormal Returns (Price effects)
The price effects following a stock addition to the PSI-20 index are summarised in Figure 2 and Table 2.
PLEASE INSERT FIGURE 2 PLEASE INSERT TABLE 2
First, we start by performing a full period analysis. During the 15 trading days preceding AD the return is negative but very close to zero, which is a clear evidence of no market anticipation. Then on the AD we observe a positive and statistically significant abnormal return of 1.78% and the abnormal return stays statistically significant between the AD and the ED ([AD;ED-1]). However, on ED we observe an inversion of behaviour and on ED we observe a negative and statistically significant abnormal return of -0.40%. Nevertheless, when the observation window is extended in order to incorporate the fortnight following ED ([ED;ED+15]) the statistical significance of the abnormal return vanishes. And the same effect happens with cumulative abnormal returns when we observe the time window that includes AD and is extended for 15 days following ED ([AD;ED+15]). This means that the positive abnormal return observed on AD and even accrued during the period up to ED is offset in the 15 days following the effective change. As a general conclusion it appears that the price effect for added stocks to the index portfolio seems to be temporary and a overreaction.
Regarding the sub-period analysis the results lead us to conclude there is an interesting change of pattern. For the sub-period 1996-1997 we observe a positive, although non-significant, abnormal return before ED, even after AD. This means that even after announcing that a change was going to occur the market behaved as if it were “asleep”, “waking up” after the effective day of the change. After this we recorded a negative abnormal return which is statistically significant and lasted for 15 days!
During the following sub-period (1998-1999) it seems that the market had learned with the previous experience and started to react more promptly. The event window [AD;ED-1] showed a positive and statistically significant abnormal return, but the effect soon vanished after the ED.
Finally, for changes during the last sub-period (2000-2001) no significant effects were observed, meaning that the learning process seems now to be complete and the signs of
inefficiency of the early years passed. However, some caution should be exercised when interpreting the results of this period because the sample size was reduced to four events.
PLEASE INSERT FIGURE 3 PLEASE INSERT TABLE 3
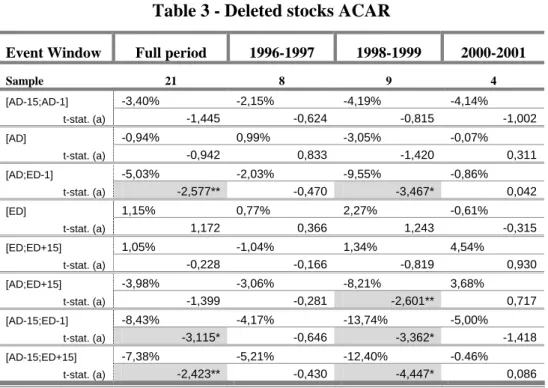
We then studied the price effects of stock deletions that are summarised in Figure 3 and Table 3. Deletions would be expected to show a negative abnormal return. And, in fact, we observed a negative and significant abnormal return of -5,03% from the AD up to the ED ([AD;ED-1]). This result is so strong that it turns the cumulative abnormal returns for the time windows [AD-15;ED-1] and [AD-15;ED+15] significantly negative.
When the sub-periods are studied, only the second sub-period (1998-1999) shows any abnormal returns, but this is absolutely in line with what was found for the entire sample.
To summarise, both additions and deletions show abnormal price return effects. For additions the positive effect starts at AD and lasts up to ED, reverting the effect thereafter. For deletions from the index, the negative effect starts at AD and lasts up to ED-1, vanishing from then on, but no overreaction was found. Since neither effect lasts in time, the findings seem to be consistent with the price pressure hypothesis.
Further insight can be gained with the trading volume analysis.
5.2. Abnormal Volume (Trading volume effects)
It is known from literature that volume changes have a perceivable effect on the transaction costs and could induce a change in the volatility and in stock bid/ask spread. According to the methodology described in section 3.2, the volume ratio VR will state the trading volume level, according to the following:
- VR = 1 the trading volume is not different from expected;
- VR < 1 the trading volume in the event window is lower than expected; - VR > 1 the trading volume in the event window is higher than expected.
As for the stock price effects, trading volume was closely examined using similar event windows. Figure 4 plots the VR evolution over the event window while Table 4 summarises the volume ratios for stocks added to the index with the t-test result.
PLEASE INSERT FIGURE 4 PLEASE INSERT TABLE 4
The analysis of VR through the event window provides strong evidence of abnormal trading activity showing an almost symmetrical pattern and reaching the highest value in event window [AD;ED-1]. Before AD (during the event window [AD-15;AD-1]) VR is close to the expected trading volume. However, between the announcement day (AD) and the effective change day (ED) VR raises, which is a symptom of the fact that investors start to adjust their portfolios in accordance with index additions. After the effective change day there is a decrease in market activity. However, the decrease is not enough to return to the expected trading levels observed before the addition (see Table 4). Some persistent effect on trading activity is perceivable, to a statistically significant level of 1,4 times the expected volume.
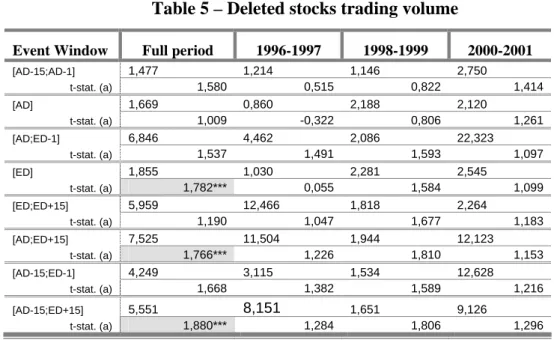
When we study the trading activity related with deletions from the stock index (Table 5 and Figure 5) the results are quite similar. The only difference is that trading activity only becomes significant after ED. The average VR for the event window that tests persistency ([AD; ED+15]) is statistically significant with a level of more than 7 times its expected volume!
PLEASE INSERT FIGURE 5 PLEASE INSERT TABLE 5
These findings of persisting abnormal trading activity after changes for both additions to and deletions from the index composition reveal a conflicting support for the liquidity hypothesis. From one side the permanent positive trading volume effect for additions to the index supports the liquidity hypothesis but the same permanent positive trading volume effect for deletions from the index contradicts what we have just said.
5.3. Abnormal volatility (volatility effects)
Several studies7 show that an increase (decrease) of the trading volume per transaction could lead to a decrease (increase) of the bid-ask spread and volatility. According to the methodology described in section 3.3, volatility analysis will be divided into two different perspectives: based on a 60 day range centred on the effective change date (ED) and on the announcement day (AD).
Regarding the additions (Tables 6 and 7) we found a strong increase in the average volatility after the announcement (from 8.6% to 11.7%) and a slight decrease after the effective change (from 10.8% to 10.4%). However, none of these changes are statistically significant apart from the most recent time period (2000-2001) where volatility registered a statistically significant (and dramatic) increase passing from an average 5.6% to an average 24.5%!
PLEASE INSERT TABLE 6 PLEASE INSERT TABLE 7
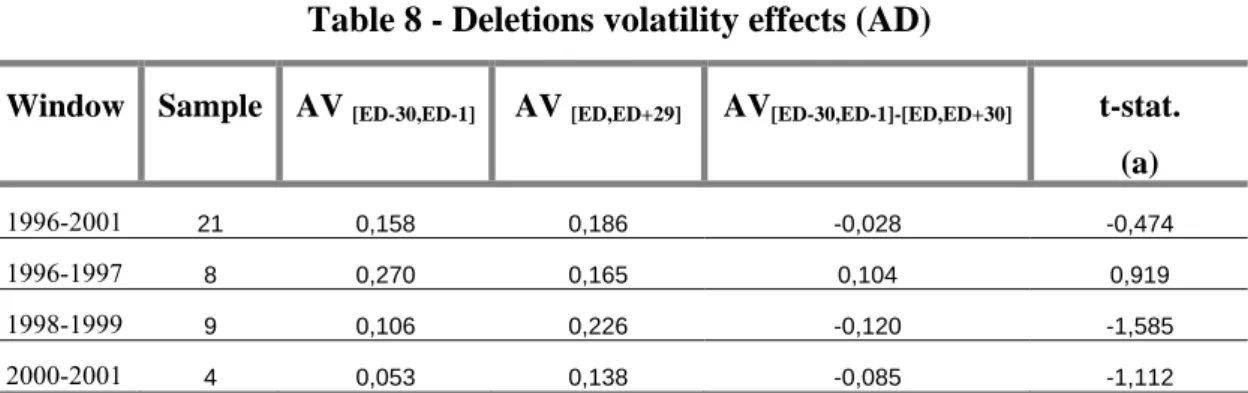
When deletions to the index are observed, the results are similar to those found for additions. After the announcement there is an increase in volatility (from 15.8% to 18.6%) and a decrease after the effective change (from 18.1% to 15.0%). But once again, the differences found are not statistically significant, even for any sub-period under scope.
PLEASE INSERT TABLE 8 PLEASE INSERT TABLE 9
7 See among others Amihud and Mendelson (1986) who developed a ground-breaking model that shows an
increasing and concave relation between expected return and relative spread (bid-ask spread in relation to stock price).
If these results are read without observing statistical significance, they may well be considered surprising, since we were expecting some decrease in volatility. According to the liquidity or information cost hypothesis, and considering the observed price and trading effect described earlier in this study, we hypothesised a decrease in volatility. But after the announcements what we found was an increase on volatility. Nevertheless, being aware that these results are, with a single exception, statistically insignificant, we can only accept the null hypothesis on volatility behaviour after the stock index composition. This conclusion, added to the previous findings on temporary price and trading volume effects, only reinforces the thesis of surprising price changes after the announcement days, in support of the price pressure hypothesis.
6. Conclusion
A vast set of similar studies about index replacements reported stock market inefficiencies (namely abnormal returns and abnormal trading volume). However due to different market regulations, stock market structure and index revisions rules, it is pertinent to extend the analysis to markets where these studies have not yet been undertaken. The Portuguese stock market and its main index is one of those.
This study examined the effects of index change composition for the PSI-20 index from 1996 to 2001. The study provides empirical evidence on stock price abnormal returns, trading volume and volatility for additions to and deletions from the index using an event window methodology around the announcement date and the effective date of the changes.
The rules for governing the PSI-20 index were kept constant during the period under analysis and were publicly available. Therefore, if some surprising results are observed this means that the Portuguese market fails to prove its efficient at the semi-strong form.
The market seems to be surprised when announcements of composition change are released by the stock index Technical Committee. In terms of stock price returns it reacts positively for additions to and negatively for deletions from the index. All these observed effects are evident for the time period between the announcement day and the effective day of the change. But what is surprising is that on the effective day of the change the market reacts
to stock additions to the index, decreasing significantly the price that was being raised until then. This may be a sign of a previous overreaction when the announcements were made.
The market also reacts in terms of trading volume. A positive abnormal trading volume is observed after additions to and deletions from the index and the increase of trading persists for up to at least 15 days after the event.
In terms of volatility the results are not statistically significant and we cannot reject the hypothesis of no change in volatility either after the announcement day or after the effective day of the change.
The analysis carried out on sub-samples composed of sub-time periods for observation was not conclusive because the number of changes within each sub-period is small, suffering from the statistical problem affecting small samples.
All those statistically significant findings in terms of price returns seem to be temporary, not lasting for more than the effective day of the change. This would lead us to support the price pressure hypothesis. However, in terms of trading volume we found signs of persistency for the increase of trading after either additions to or deletions from the index which becomes a puzzling and contradictory support for the liquidity hypothesis.
The findings suggest that the Portuguese stock market is not efficient even in its semi-strong form but based on the analysis of sub-periods, we concluded that some improvement was observed in terms of efficiency.
References
Acharya, S. (1993), Value of latent information: Alternative event study methods, Journal of
Finance, 48, pp. 363-385.
Amihud, Y. and Mendelson, H. (1986), Asset pricing and the bid-ask spread, Journal of
Financial Economics, 17, pp. 233-249.
Barontini, R. and S. Rigamonti (2000), Stock Index Futures and the Effect on Cash Market in Italy. Evidence from Changes in Indexes Composition, EFMA 2000 Athens Meeting, June 28 - July 1, Social Science Research Network (SSRN).
Bechmann, K. (2002), Price and Volume Effects Associated with Changes in the Danish Blue-Chip Index - The KFX Index, EFMA 2002 London Meetings, June 26-29, Social Science Research Network (SSRN)andCopenhagen Business School Finance Working Paper.
Beneish, M. D. and Gardner, J. C. (1995), Information Costs and Liquidity Effects from Changes in the Dow Jones Industrial Average List, Journal of Financial and Quantitative
Analysis, 30 (1), pp. 135-157.
Beneish, M.D. and Whaley, R.E. (1996), An anatomy of the ‘S&P 500 game’: The effects of changing the rules, Journal of Finance, 51, pp. 1909-1930.
Beneish, M.D. and Whaley, R.E. (1997) A scorecard from the S&P game, Journal of
Portfolio Management, 23(2), pp. 16-23.
Bildik, R. and G. Gulay (2001), Effects of Changes in Index Composition on Stock Market: Evidence from the Istanbul Stock Exchange, EFMA 2001 Lugano Meetings, June 27-30, Social Science Research Network (SSRN).
Binder, J. (1998), The event study methodology since 1969, Review of Quantitative Finance
and Accounting, 11, pp. 111–137.
Boehmer E., J. Musumeci and A. B. Poulsen (1991), Event-study Methodology Under Conditions of Event-Induced Variance, Journal of Financial Economics, 30, 253-272. Brealey, R. A. (2000), Stock Prices, Stock Indexes and Index Funds, Bank of England
Quarterly Bulletin, 40 (1), pp. 61-68.
Brown, S. J. and Warner, J. B. (1985), Using daily stock returns, the case of event studies,
Journal of Financial Economics, 14, pp. 3-31.
Cable, J., and Holland, K. (1999), Modeling normal returns in event studies: A model-selection approach and pilot study, European Journal of Finance, 5, 331-341.
Chakrabarti, R., Huang, W., Jayaraman, N. and Lee, J. (2002), The “Index Effect” On Stock Prices and Trading Volumes: International Evidence, EFMA 2002 London Meetings, June 26-29, Social Science Research Network (SSRN).
Chen, H., Noronha, G., Singal, V. (2002), Investor Awareness and Market Segmentation: Evidence from S&P 500 Index Changes, EFA 2002 Berlin Meetings, 21-24 August, Social Science Research Network (SSRN).
Chung, R. and Kryzanowski, L. (1998), Are the Market Effects Associated with Revisions to the TSE300 Index Robust?, Multinational Finance Journal, 2(1), pp. 1-36.
Collins, M. C., Wansley, J. and Robinson, B. (1995), Price and Volume Effects Associated with the Creation of Standard & Poor´s MidCap Index, Journal of Financial Research, 18 (3), pp. 329-350.
Coopers, D. and Woglom, G. (2002), The S&P500 Effect: Not such good news in the long run, FED Working Paper, 48/2002.
Copeland, T. and Mayers, D. (1982), The Value Line enigma (1965-1978): A case study of performance evaluation issues, Journal of Financial Economics, 10 (November), pp. 289-321.
Coutts, A., Mills, T. and Roberts, J. (1994), The market model and the event study method: A synthesis of the econometric criticisms, International Review of Financial Analysis, 3, pp. 149-171.
Coutts, A., Mills, T. and Roberts, J. (1995), Misspecification of the Market Model - The Implications for event studies, Applied Economic Letter, 2, pp. 163-165.
Deininger, C., Kaserer, C. and Roos, S. (2000), Stock Price Associated with Index Replacements in Germany, EFMA 2001 Lugano Meetings, June 27-30, Social Science Research Network (SSRN)
Dhillon, U. and Johnson, H. (1991), Changes in the Standard and Poor's 500 List, Journal of
Business, 64 (1), pp. 75-85.
Draper, P. and Paudyal, K. (1995), Empirical Irregularities in the Estimation of Beta: The Impact of Alternative Estimation Assumptions and Procedures, Journal of Business Finance
and Accounting, 22 (1), pp.157-177.
Edmister, R. O., Graham, A. S., and Pirie, W. L. (1994), Excess returns of index replacement stocks: Evidence of liquidity and substitutability, The Journal of Financial Research, 17 (Fall), pp. 333-346.
Edmister, R. O., Graham, A. S., and Pirie, W. L. (1996), Trading Cost Expectations: Evidence from the S&P 500 Index Replacement Stock Announcements, Journal of Economics and
Finance, 20, pp. 75-85.
Elayan, F., Li, W. and Pinfold, J. (2001), Price Effects of Changes to the Composition of New Zealand Share Indices, Massey university at Albany, Working Paper.
Fama, E., Fisher, L., Jensen, M. and Roll, R. (1969), The adjustment of stock prices to new information, International Economic Review, 10, pp. 1-21.
Fama, E. and French, K. (1992), The cross-section of expected stock returns, Journal of
Finance, 47 (June), pp. 427-465.
Goetzmann, W. N. and Garry, M. (1986), Does delisting from the S&P affect stock price?,
Financial Analysts Journal, 42, pages 64–69.
Goetzmann, W. N. and Massa, M. (1999), Index funds and stock market grow, NBER
Working Paper, n.º 7033, March.
Hanaeda, H. and Serita T. (2003), Price and Volume Effects Associated with a Change in the Nikkei 225 Index List: New Evidence from the Big Change on April 2000, forthcoming on
International Finance Review, 4 (December).
Harris, L. and Gurel, E. (1986), Price and Volume Effects Associated with Changes in the S&P 500 List: New Evidence for the Existence of Price Pressures, The Journal of Finance, 41 (4), pp. 815-829.
Hillmer, S. C., and Yu, P. L. (1979), The market speed of adjustment to new information,
Journal of Financial Economics, 7, pp. 321-345.
Jain, P. C. (1987), The effect on Stock Price of Inclusion in or Exclusion from the S&P500,
Financial Analysts Journal, 43 (January/February), pp. 58-65.
Kryzanowski, L. and Zhang, H. (1992), The contrarian investment strategy does not work in Canadian markets, Journal of Financial and Quantitative Analysis, 27 (September), pp. 383-395.
Lamoureux, C. G. and Wansley, J. W. (1987), Market Effects of Changes in the Standard & Poor’s 500 Index, Financial Review, 22 , pp. 53-69.
Liu, S. (2000), Changes in the Nikkei 500, New Evidence for Downward Sloping Demand Curves for Stocks, International Review of Finance, 1(4), 245-267.
Lynch, A. W. and Mendenhall, R. R. (1997), New Evidence on Stock Price Effects
Associated with Changes in the S&P 500 Index, Journal of Business, 70, n.º 3, pp. 351-383. MacKinlay, C. (1997), Event studies in economics and finance, Journal of Economic
Literature, 35, 13-39.
Merton, R. C. (1987), A simple model of capital market equilibrium with incomplete information, Journal of Finance, 42, pp. 483-510.
Prabhala, N. R. (1997), Conditional methods in event studies and an equilibrium justification for standard event-study procedures, The Review of Financial Studies, 10, pp. 1-38.
Pruitt, S. W. and Wei, K. C. J. (1989), Institutional Ownership and Changes in the S&P500,
The Journal of Finance, 44(2), pp. 509-513.
Scholes, M. and Williams, J.(1977), Estimating betas from nonsynchronous data, Journal of
Business Finance and Accounting, 5, pp. 309-327.
Shleifer, A. (1986), Do Demand Curves for Stocks Slope Down?, The Journal of Finance, 41 (3), pp. 579-590.
Strong, N. (1992), Modeling abnormal returns: A review article, Journal of Business Finance
and Accounting, 19 (4), pp. 533-553
Woolridge, J. R. and Ghosh, C. (1986), Institutional trading and security prices: the case of changes in the composition of the S&P 500 index, Journal of Financial Research, 9, pp. 13-24.
Table 1 - Descriptive statistics on the final sample
Events Trading days between announcement and effective change
Year
Addition Deletion Total Addition Deletion Annual average Global average
1996 3 3 6 18,0 18,0 18,0 1997 2 5 7 20,0 19,8 19,9 1998 4 5 9 17,3 18,0 17,7 1999 4 4 8 16,8 16,8 16,8 2000 2 3 5 3,0 10,7 7,6 2001 2 2 4 11,0 11,0 11,0 15,1 Total 17 22 39
Table 2 - Added stocks ACAR
Event Window Full period 1996-1997 1998-1999 2000-2001
Sample 17 5 8 4 [AD-15;AD-1] -0,06% 0,94% 0,66% -2,76% t-stat. (a) 0,825 0,707 0,950 -0,148 [AD] 1,78% 0,32% 2,40% 2,39% t-stat. (a) 2,626** 0,615 1,860 1,056 [AD;ED-1] 3,33% 2,02% 5,63% 0,37% t-stat. (a) 3,952* 1,591 3,075** 0,014 [ED] -0,40% -0,58% -0,74% 0,49% t-stat. (a) -1,915*** -2,198*** -1,673 0,160 [ED;ED+15] -3,02% -6,37% -2,16% -0,53% t-stat. (a) -1,231 -2,150*** -0,279 -0,188 [AD;ED+15] 0,31% -4,35% 3,47% -0,17% t-stat. (a) 0,605 -1,851 1,259 -0,109 [AD-15;ED-1] 3.27% 2,97% 6,29% -2,39% t-stat. (a) 2,901** 1,704 2,668** -0,104 [AD-15;ED+15] 0,26% -3,40% 4,13% -2,92% t-stat. (a) 1,121 -0,740 1,576 -0,200 (a) Statistically significant (marked with grey colour): * for 1%; ** for 5% and *** for 10%
Table 3 - Deleted stocks ACAR
Event Window Full period 1996-1997 1998-1999 2000-2001
Sample 21 8 9 4 [AD-15;AD-1] -3,40% -2,15% -4,19% -4,14% t-stat. (a) -1,445 -0,624 -0,815 -1,002 [AD] -0,94% 0,99% -3,05% -0,07% t-stat. (a) -0,942 0,833 -1,420 0,311 [AD;ED-1] -5,03% -2,03% -9,55% -0,86% t-stat. (a) -2,577** -0,470 -3,467* 0,042 [ED] 1,15% 0,77% 2,27% -0,61% t-stat. (a) 1,172 0,366 1,243 -0,315 [ED;ED+15] 1,05% -1,04% 1,34% 4,54% t-stat. (a) -0,228 -0,166 -0,819 0,930 [AD;ED+15] -3,98% -3,06% -8,21% 3,68% t-stat. (a) -1,399 -0,281 -2,601** 0,717 [AD-15;ED-1] -8,43% -4,17% -13,74% -5,00% t-stat. (a) -3,115* -0,646 -3,362* -1,418 [AD-15;ED+15] -7,38% -5,21% -12,40% -0.46% t-stat. (a) -2,423** -0,430 -4,447* 0,086 (a) Statistically significant (marked with grey colour): * for 1%; ** for 5% and *** for 10%
Table 4 - Added stocks trading volume
Event Window Full period 1996-1997 1998-1999 2000-2001
[AD-15;AD-1] 0,991 0,941 1,117 0,974 t-stat. (a) 0,228 -0,453 0,481 -0,074 [AD] 2,000 0,802 2,483 2,774 t-stat. (a) 1,381 -0,853 1,153 0,835 [AD;ED-1] 2,475 2,059 2,726 2,909 t-stat. (a) 2,667** 1,102 1,734 1,529 [ED] 2,147 0,321 3,096 3,287 t-stat. (a) 1,454 -2,995** 1,242 1,308 [ED;ED+15] 1,065 1,122 1,059 1,223 t-stat. (a) 0,624 0,219 0,347 0,615 [AD;ED+15] 1,378 1,322 1,504 1,515 t-stat. (a) 1,876*** 0,693 1,291 1,050 [AD-15;ED-1] 1,318 1,407 1,396 1,346 t-stat. (a) 1,714 1,003 0,981 0,987 [AD-15;ED+15] 1,206 1,236 1,286 1,277 t-stat. (a) 1,515 0,656 0,928 1,175 (a) Statistically significant (marked with grey colour): * for 1%; ** for 5% and *** for 10%
Table 5 – Deleted stocks trading volume
Event Window Full period 1996-1997 1998-1999 2000-2001
[AD-15;AD-1] 1,477 1,214 1,146 2,750 t-stat. (a) 1,580 0,515 0,822 1,414 [AD] 1,669 0,860 2,188 2,120 t-stat. (a) 1,009 -0,322 0,806 1,261 [AD;ED-1] 6,846 4,462 2,086 22,323 t-stat. (a) 1,537 1,491 1,593 1,097 [ED] 1,855 1,030 2,281 2,545 t-stat. (a) 1,782*** 0,055 1,584 1,099 [ED;ED+15] 5,959 12,466 1,818 2,264 t-stat. (a) 1,190 1,047 1,677 1,183 [AD;ED+15] 7,525 11,504 1,944 12,123 t-stat. (a) 1,766*** 1,226 1,810 1,153 [AD-15;ED-1] 4,249 3,115 1,534 12,628 t-stat. (a) 1,668 1,382 1,589 1,216 [AD-15;ED+15] 5,551 8,151 1,651 9,126 t-stat. (a) 1,880*** 1,284 1,806 1,296 (a) Statistically significant (marked with grey colour): * for 1%; ** for 5% and *** for 10%
Table 6 – Additions volatility effects (AD)
Window Sample AV [ED-30,ED-1] AV [ED,ED+29] AV[ED-30,ED-1]-[ED,ED+30] t-stat.
(a)
1996-2001 17 0,086 0,117 -0,031 -1,155
1996-1997 5 0,104 0,160 -0,056 -1,061
1998-1999 8 0,091 0,050 0,041 0,932
2000-2001 4 0,056 0,245 -0,189 -3,024
(a) Statistically significant (marked with grey colour): * for 1%; ** for 5% and *** for 10%
Table 7 – Additions volatility effects (ED)
Windows Sample AV[ED-30,ED-1] AV [ED,ED+29] AV[ED-30,ED-1]-[ED,ED+30] t-stat.
(a)
1996-2001 17 0,108 0,104 0,005 0,066
1996-1997 5 0,096 0,134 -0,038 2,200***
1998-1999 8 0,110 0,071 0,039 -0,747
2000-2001 4 0,137 0,174 -0,037 1,597
Table 8 - Deletions volatility effects (AD)
Window Sample AV [ED-30,ED-1] AV [ED,ED+29] AV[ED-30,ED-1]-[ED,ED+30] t-stat.
(a)
1996-2001 21 0,158 0,186 -0,028 -0,474
1996-1997 8 0,270 0,165 0,104 0,919
1998-1999 9 0,106 0,226 -0,120 -1,585
2000-2001 4 0,053 0,138 -0,085 -1,112
(a) Statistically significant (marked with grey colour): * for 1%; ** for 5% and *** for 10%
Table 9 – Deletions volatility effects (ED)
Window Sample AV [ED-30,ED-1] AV [ED,ED+29] AV[ED-30,ED-1]-[ED,ED+30] t-stat.
(a)
1996-2001 21 0,181 0,150 0,032 -0,994
1996-1997 8 0,217 0,128 0,089 1,484
1998-1999 9 0,203 0,174 0,028 0,951
2000-2001 4 0,062 0,137 -0,075 -0,881
Figure 1 – Event windows under study
Full event window Partial event window
Pre-announcement period Post-announcement period Post-change period
AD-15 AD-1 AD ED-1 ED ED+15
Announcement day (at market close) Effective change day Announcement day expected effects Pre-effective change day
Figure 2 – Full period added stocks ACAR
ACAR (Additions) -4% -3% -2% -1% 0% 1% 2% 3% 4% A D - 15 ;A D - 1 A D A D ;E D - 1 E D E D ;E D +15
Figure 3 – Full period deleted stocks ACAR
ACAR (Deletions) -6,00% -5,00% -4,00% -3,00% -2,00% -1,00% 0,00% 1,00% 2,00% A D - 15 ;A D - 1 A D A D ;E D - 1 E D E D ;E D +15
Figure 4 – Full period added stocks VR
Volume ratio (Additions)
0,00 0,50 1,00 1,50 2,00 2,50 3,00
A D-15;A D-1 A D A D;ED-1 ED ED;ED+15
Figure 5 – Full period deleted stocks VR
Volume ratio (Deletions)
0,00 1,00 2,00 3,00 4,00 5,00 6,00 7,00 8,00
ANNEX 1
Explanation hypotheses for index composition changes effects
Explanation hypothesis Researcher(s) Price pressure Imperfect substitutes
Liquidity Information Selection criteria
Shleifer (1986) √
Goetzmann and Garry (1986) (a)
Harris and Gurel (1986) √
Amihud and Mendelson (1986) √
Woolridge and Gosh (1986) √ √
Lamoureux and Wansley (1987) √
Jain (1987) √
Pruitt and Wei (1989) √
Dhillon and Johnson (1991) √ √
Edmister et al. (1994 and 1996) √
Beneish and Gardner (1995) √
Collins, Wansley and Robinson (1995)
√ Beneish and Whaley (1996) √
Lynch and Mendenhall (1997) √ √ Chung and Kryzanowski (1998) √
Deininger, Kaserer and Roos (2000) √
Barontini and Rigamonti (2000) √ √
Brealey (2000) (b)
Liu (2000) √
Hanaeda and Sarita (2001) √
Elayan, Li and Pinfold (2001) √
Bildik and Gülay (2001) √
Cooper and Woglom (2002) √
Bechmann (2002) √
Chakrabarti et al. (2002) √ √
Chen et al. (2002) √
Hanaeda and Sarita (2003) √
(a) They examined the AT&T spin-off in 1983 and they did not presented any explanation hypothesis.
(b) Brealey collected evidence against the selection criteria, “… abnormal returns are observed for both indexes (which) suggests that the effect is not simply due to the growth of index funds or performance benchmarking,” and he concluded that those price effects are likely to be very small.
ANNEX 2
Index replacement effects on the announcement day
Findings
Researcher(s) Index Time
Period Additions Deletions
S&P500 1966-1975 -0.2% n.a. Shleifer (1986)
S&P500 1976-1983 2.79% n.a. Goetzmann and Garry (1986) S&P500 1983 n.a. -2.00% Harris and Gurel (1986) S&P500 1978-1983 3.13% -1.40) Woolridge and Gosh (1986) S&P500 1977-1983 2.77% n.a.
S&P500 1966-1975 0.50% n.a. Lamoureux and Wansley (1987)
S&P500 1976-1985 2.30% n.a. Jain (1987) S&P500 1977-1983 3.10% -1.17% Pruitt and Wei (1989) S&P500 1973-1986 - - Dhillon and Johnson (1991) S&P500 1984-1988 3.30% n.a. Edmister et al. (1994 and 1996) S&P500 1983-1989 3.30% n.a. Beneish and Gardner (1995) DJIA 1929-1988 0.57% -2.31% Collins, Wansley and Robinson (1995) S&P MidCap400 1991 -0.149% n.a. Beneish and Whaley (1996) S&P500 1986-1989 3.67% n.a.
S&P500 1989-1994 5.90% n.a.
Lynch and Mendenhall (1997) S&P500 1990-1995 3.16% -6.26% Chung and Kryzanowski (1998) TSE300 1990-1994 2.5%nonannual 1.70% annual -1.30% annual
2.9%nonannual Deininger, Kaserer e Roos (2000) DAX
MDAX 1988-1997
2.38% 1.72%
-0.80% -1.36% Barontini and Rigamonti (2000) MIB30
MIDEX 1995-1999
0.84% 0.76%
-0.84% -0.03% Brealey (2000) FTSE All Shares FTSE 100 1994-1999 -0.40% 0.50% -0.30% 0.10% Liu (2000) Nikkei500 1991-1999 1.54% (2.57%) Elayan, Li and Pinfold (2001) NZSE 40
NXSE 10 1991-2000
0.96% 1.37%
(2.20%) (3.14%) Bildik and Gulay (2001) ISE 1995-2000 0.16% -0,38% Coopers and Woglom (2002) S&P500 1978-1998 3.50% n.a. Bechmann (2002) KFN Index 1989-2000 0.26% -0.22% Chakrabarti et al. (2002) MSCI 1998-2001 1.11% -1.49% S&P500 1962-1976 -0.04% -0.39% S&P500 1976-1989 3.11% -0.85% Chen et al. (2002)
S&P500 1989-1999 4.93% -5.55% Hanaeda and Sarita (2003) Nikkei225 2000 5.41% -18.79% n.a. – not available
ANNEX 3
Stocks Event Announcement day (AD)
Effective change day (ED)
B.CHEMICAL (PORTUGAL) - Nom. Deleted 15-Dec-95 02-Jan-96
BANIF - Nom. Deleted 15-Dec-95 02-Jan-96
BPSM - Nom. Added 15-Dec-95 02-Jan-96
CPP - Nom./Port.Regist. Deleted 15-Dec-95 02-Jan-96
MUNDIAL CONFIANCA - Nom. Added 15-Dec-95 02-Jan-96
SEMAPA Added 15-Dec-95 02-Jan-96
CORTICEIRA AMORIM, SGPS Deleted 03-Dec-96 02-Jan-97
ENGIL, SGPS Added 03-Dec-96 02-Jan-97
SONAE INDUSTRIA, SGPS Deleted 03-Dec-96 02-Jan-97
BANCO FOMENTO E EXTERIOR-Nom. Deleted 18-Apr-97 28-Apr-97
LISNAVE Deleted 18-Apr-97 28-Apr-97
TELECEL Added 18-Apr-97 28-Apr-97
TRANQUILIDADE-Tipo B-Nom. Deleted 12-Jun-97 01-Jul-97
ENGIL, SGPS Deleted 12-Dec-97 02-Jan-98
SONAE INDUSTRIA, SGPS Added 12-Dec-97 02-Jan-98
SOPORCEL Deleted 12-Dec-97 02-Jan-98
TRANQUILIDADE-Tipo B-Nom. Added 12-Dec-97 02-Jan-98
UNICER - Nom. Deleted 12-Dec-97 02-Jan-98
IMPERIO - Nom. Added 05-Jun-98 01-Jul-98
TRANQUILIDADE-Tipo B-Nom. Deleted 05-Jun-98 01-Jul-98
BTA - Nom. Deleted 25-Jun-98 25-Jun-98
SONAE IMOBILIÁRIA. Added 25-Jun-98 25-Jun-98
BPA - Nom. Added 11-Dec-98 04-Jan-99
SAG GEST, SGPS Added 11-Dec-98 04-Jan-99
SEMAPA Deleted 11-Dec-98 04-Jan-99
SONAE INDUSTRIA, SGPS Deleted 11-Dec-98 04-Jan-99
SAG GEST, SGPS Deleted 14-Jun-99 01-Jul-99
SOPORCEL Added 14-Jun-99 01-Jul-99
INPARSA Deleted 28-Jul-99 30-Jul-99
SEMAPA Added 28-Jul-99 30-Jul-99
IMPERIO - Nom. Deleted 13-Dec-99 03-Jan-00
PARAREDE, SGPS Added 24-May-00 25-May-00
BPSM - Nom. Deleted 07-Jun-00 12-Jun-00
SAG GEST, SGPS Added 07-Jun-00 12-Jun-00
SEMAPA Deleted 27-Jun-00 03-Jul-00
NOVABASE, SGPS Added 13-Dec-00 02-Jan-01
SONAE IMOBILIÁRIA. Deleted 13-Dec-00 02-Jan-01
SEMAPA Added 14-May-01 16-May-01