Soil and Plant Nutrition |
Article
Oxisol under agroecological production system
Enderson Petrônio de Brito Ferreira (*); Adriane Wendland; Agostinho Dirceu Didonet Embrapa Arroz e Feijão, Caixa Postal 179, 75375-000 Santo Antônio de Goiás (GO), Brasil.
(*) Corresponding author: [email protected]
Received: January 5, 2011; Accepted: July 4, 2011
Abstract
Aiming to evaluate the effects of soil management and cover crops on microbial indicators of soil quality, an experiment was carried out under field conditions in which common bean and corn were cropped under no-tillage (NT) and conventional tillage (CT) after sunnhemp, velvet bean, pigeon pea, jack bean, sorghum and fallow (weeds). The basal soil respiration (BSR), C and N
of the microbial biomass (Cmic and Nmic), metabolic quotient (qCO2), total enzymatic activity (TEA), β-glycosidase (β-GA)
activ-ity and acid phosphatase activactiv-ity (APA) were evaluated in samples collected in 0-0.10 m depth. Cmic, qCO
2, TEA, β-GA and APA
were more sensitive in determining the effects caused by tillage and cover crops. Although the cover crops had not provided
a remarkably influence on the studied indicators, in general, the highest values of Cmic, Nmic, BSR, TEA, β-GA and APA and the
lowest values of qCO2 were observed under NT compared to CT. Cmic and TEA values were 35% and 13% higher under NT
when compared to CT, respectively. In addition, NT showed values closer to those found under “Cerrado” area for the studied parameters, indicating a greater sustainability under this soil management system compared to CT management.
Key words: green manure, cover crops, soil quality, sustainability.
Biomassa microbiana e atividade enzimática de um Latossolo do Cerrado sob sistema
agroecológico de produção
Resumo
Com o objetivo de avaliar os efeitos do tipo de manejo do solo e das plantas de cobertura nos indicadores microbianos da qualidade do solo, foi desenvolvido um experimento em condições de campo, com feijoeiro comum e milho, cultivados sob semeadura direta (NT) e preparo convencional do solo (CT), após crotalária, mucuna preta, feijão guandu, feijão de porco,
sorgo e pousio (plantas espontâneas). A respiração basal do solo (BSR), C e N da biomassa microbiana (Cmic and Nmic),
quo-ciente metabólico (qCO2), atividade enzimática total (TEA), atividade de β-Glicosidase (β-GA) e atividade da fosfatase ácida
(APA) foram avaliados em amostras de solo coletadas na profundidade de 0-0,10 m. Cmic, qCO2, TEA, β-GA e APA foram mais
sensíveis na determinação dos efeitos dos sistemas de manejo do solo e das plantas de cobertura. Embora as plantas de
cobertura não tenham causado efeitos marcantes nos indicadores estudados, em geral, os valores mais altos de Cmic, Nmic,
BSR, TEA, β-GA e APA e os valores mais baixos de qCO
2 foram observados sob NT em comparação ao CT. Os valores de Cmic
e TEA foram, respectivamente, 35% e 13% maiores sob NT, quando comparada com o CT. Além disso, a NT possui valores próximos àqueles observados em solo de mata para os parâmetros estudados, indicando maior sustentabilidade sob este sistema de manejo do solo comparado ao CT.
Palavras-chave: Adubos verdes, culturas de cobertura, qualidade do solo, sustentabilidade.
1. IntroductIon
Agroecological production systems adoption has been proposed as a way to minimize environmental impacts caused by human activity aiming to reach agroecosystem sustainability, since they are based on diversified crop-ping systems, ecological soil management and pests bio-control (Altieri, 2002), resulting in food production ensuring biodiversity preservation and, without risks to consumer health (Welch and Graham, 1999).
In this way, agricultural sustainability is based on conservative practices that per pass all the production
chain, as well as the efficient use of natural resources. Thus, it is possible to infer that biological processes occurring in the soil-plant system, performed by mi-croorganisms and small invertebrate activity, constitute the basis on which agroecological farming is sustained (Faria and Franco, 2002).
and cover crops (Carrera et al., 2007); type of fertilizers and the way they are applied (Carrera et al., 2007); plant development stage and cultivars (Ferreira et al., 2008), as well as, pesticides (Ferreira et al., 2009).
Although some consensus concerning the importance of the evaluation of soil quality indicators exists, the num-ber and type of indicators to be used is not unanimous among research groups (Bremer and Ellert, 2004). Moreover the intensity of the environmental impact brought about by agricultural activity is also related to local environmental conditions (Nield and Baas, 2008), making clear that reliability in the use of more appropri-ate soil quality indicators demand more studies at the re-gional level.
On the other hand, it is necessary to consider other factors when selecting soil quality indicators, such as land use, relationship between the soil function indicator to be accessed, ease in data collecting and reliability of ana-lytical results, the interval between sampling times and differences within each area, sensitivity to changes in soil management, the compatibility between sampling time and monitoring, and the necessary skills for data interpre-tation (usda, 1996).
From the perspective of agroecological production, it is essential the use of high quality and amount dry mass producing species as cover crops and soil manage-ment practices that allow reduced soil tillage. However, it is necessary to assess the real impact of these cover spe-cies and soil management practices under agroecological production system. Therefore, the present study aimed to assess changes in some microbiological attributes of an Oxisol cultivated with different five cover crops and two soil management systems (tillage and no-tillage) under organic production system of common bean and corn af-ter cover crops establishment.
2. MaterIal and Methods
study area
The geographic location of the experimental area is 16º 28’ S and 49º 17’ W at 823 m above sea level. According to the Köppen classification the climate is classified as Aw, tropical savanna, megathermic. The rainfall regime is well defined, with a wet season from October to April and a dry season from May to September, and an annual aver-age rainfall of 1460 mm (Silva et al., 2002).
The soil at the experimental site is a clay loam Oxisol with 410 g of sand, 270 g of silt and 320 g of clay kg-1.
The chemical characteristics of the top layer (0.00-0.10 m) are: 2.01% of organic matter, 5.8 mg dm-3 of
phos-phorus, 145.9 mg dm-3 of potassium, 3.6 cmolc dm-3 of
calcium, 1.2 cmolc dm-3 of magnesium and pH 6.2 in
water (1:2.5). The original vegetation was characteristic
of the Brazilian Cerrado (Savanna). The area had been cultivated under conventional tillage (plowing followed by harrow leveling) with corn and soybeans succession for about 30 years.
Since October 2003 this area has been cropped under an agroecological production system, in which sunn hemp
(Crotalaria juncea), velvet bean (Mucunaaterrina), pigeon
pea (Cajanuscajan), jack bean (Canavaliaensiformis), and sorghum (Sorghum bicolor L.) and fallow (spontaneous plants) were cropped as cover crops under Conventional Tillage (CT). Common bean and corn were sowed under CT and No-Tillage (NT) systems.
Cover crops sowing was performed in October 2006 and cut down with cutting-roller in January 2007 and, common bean (Phaseolusvulgaris L.) cv. BRS Horizonte and maize (Zeamayz L.) cv. AG 1051 were cropped after
these ones. The cover crop spacing was 0.45 m between rows, with 15 seeds per meter for sorghum, 35 seeds for sunn hemp and pigeon pea and 8 seeds for velvet bean and jack bean. Common bean spacing was 0.45 m be-tween rows with 15 seeds per meter, and corn spacing was 0.90 m and 6 seeds per meter.
soil sampling
Soil sampling was performed at 0-0.10 m depth in the experimental area and in a neighboring native “Cerrado” area used as reference. Soil samples were taken between rows in each plot at four different times: zero time - ZT (before cover crops sowing - 11/16/2006), common beans and corn pre-planting - PP (01/08/2007), common bean flowering - BF (02/22/2007) and corn flowering - CF (03/16/2007). This period comprises the summer (wet season) with climatic conditions relatively stable over the entire experimental period.
Microbial biomass attributes determination
Each soil sample was composed by five sub-samples, ho-mogenized, packed in plastic bags and stored at 4 °C. Samples were then sieved through an 2 mm mesh, and 20 g were taken, in triplicate, for fumigation and non-fumigation, and the moisture content adjusted to 80% of the water holding capacity. For the extraction of carbon and nitrogen from the microbial biomass (Cmic and Nmic), 60 mL of K2SO4 solution (0.5 M) were added to the sam-ples. After agitating for 40 min at 150 rpm samples were placed to sediment for 30 min and filtered to separate the extract used for Cmic and Nmic determination.
determination was performed using sulfuric acid diges-tion followed by Kjeldahl distilladiges-tion, as described by Tedesco et al. (1995).
Basal soil respiration (BSR) was determined according to Jenkinson and Powlson (1976), where 20 g soil samples were placed in a 3 L flask to incubate for 120 h at 28 oC and
CO2 was trapped in a 100 mL flask containing 10 mL of KOH (0.3 M). After that, 2 mL of BaCl2 (10%) was used to precipitate the CO2, and the excess of NaOH was titrated using HCl (0.1 M). The Metabolic quotient (qCO2) was calculated according to procedures described by Anderson and Domsch (1990), as a ratio of BSR by Cmic.
soil enzyme activities determination
The evaluation of total enzymatic activity (TEA) of the soil was determined by fluorescein diacetate hydroly-sis, as proposed by Ghini et al. (1998). The activities of
β-glycosidase (β-GA) and acid phosphatase (APA) were estimated according to Tabatabai (1994), using the colo-rimetric determination of the p-nitrophenol released by the enzymes when soil samples were incubated with the specific substrates p-nitrophenyl-β-D-glycopironoside and p-nitrophenyl-phosphate, respectively.
experimental design and statistical analysis
The experiment was conducted in a randomized complete block design with 3 replicates, with 150 m2 per plot. Data
were submitted to the analysis of variance and significant differences determined by the Tukey test at p<0.05. To compare data from NT, CT and “Cerrado” area, a ‘t’ test was used at p<0.05 and values found for the “Cerrado” area were used as reference. To assess the effect of cover crops, soil management systems and different sampling times in an integrated way the microbiological attributes data were also submitted to a cluster analysis using the Euclidean distance as coefficient of dissimilarity and com-plete linkage as grouping method. Pearson correlation analysis was also applied to verify the interdependence among the studied microbiological indicators.
3. results and dIscussIon
Microbial biomass attributes under cover crops and soil management systems
The results of microbial biomass C (Cmic) (Figure 1a) were similar to those observed for microbial biomass N (Nmic)
700
600
500
400
300
200
100
0
0.70
0.60
0.50
0.40
0.30
0.20
0.10
0
ZT PP
Harvests Harvests
BF CF ZT PP BF CF
3.00
2.50
2.00
1.50
1.00
0.50
0 500
400
300
200
100
0
(a) (b)
(c) (d)
Cmic
(mg C
mic
kg
-1 soil)
Nmic
(mg N
mic
kg
-1 soil)
BSR
(mg C-CO
2
kg
-1 soil h -1)
q
CO
2
(mg C-CO
2
g
-1 C
mic
h
-1)
CT NT Cerrado
a* a*
a*a*
a* a*
a a b*
a*
a* a* a*
b*
b* a a
a b*
a b*
a*
a*a*
a a a*
b
b* a
a a*
ZT PP BF CF ZT PP BF CF
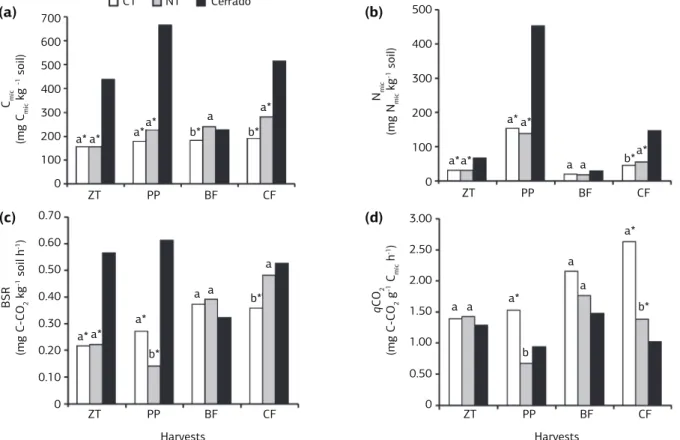
Figure 1. Carbon, Cmic (a) and Nitrogen, Nmic (b) of the microbial biomass, Basal soil respiration, BSR (c) and Metabolic quotient, qCO2
(Figure 1b), except for the samples collected at the com-mon bean flowering stage (BF). Significant differences were found between CT and NT in BF and CF for Cmic, while for Nmic significant difference was observed only in CF. The contents of Cmic and Nmic at zero time (ZT),
pre-planting (PP) and CF on “Cerrado” soil were higher as compared to CT and NT (Figure 1a,b).
Cmic and Nmic were significantly higher in “Cerrado” soil and NT as compared to CT in CF. When large amount of organic matter is accumulated in native “Cerrado” soils as a result of continuous deposition of plant material, the growth of the soil microbial population is stimulated. This condition results in higher levels of Cmic and Nmic in forest soil (Santos et al., 2004), which in a similar way explains the higher levels of Cmic and Nmic found under NT (Figure
1a,b), since this type of soil management favors the accu-mulation of organic matter added into the system by the cover crops (Stockfisch and Koch, 2006).
In general, basal soil respiration (BSR) found in the “Cerrado” soil showed higher values (p<0.05) when com-pared to the soil systems management (CT and NT), except at the BF (Figure 1c). Moreover, significant dif-ferences were found between CT and NT only at BF and CF. High CO2 efflux under “Cerrado” soil (Figure 1c) may have resulted due to the constant incorporation of plant residues with high labile organic matter contents, which increases microbial biomass and its activity and, consequently, increases CO2 release (Santos et al., 2004) as a direct relation with the high microbial biomass con-tent (Adachi et al., 2006).
Significant differences between soil management systems was found for metabolic quotient (qCO2), where NT showed values from 60% to 40% lower as compared to CT in PP and CF, respectively. Values of
qCO2 were also lower under “Cerrado” soil, however,
significant differences were only observed on CT at the PP and, for both management systems (CT and NT) at the CF (Figure 1d).
Hungria et al. (2009), found values of qCO2 under NT 15% lower than under CT. This finding indicates that when the microbial biomass becomes more efficient in the use of the ecosystem resources, less CO2 (per unit of Cmic) is lost through respiration and a higher amount of the C is incorporated into microbial biomass, result-ing on qCO2 decrease (Silva et al., 2007). That means that high stability is found under management systems in which the microbial community is little disturbed, thereby contributing to higher agroecosystem sustain-ability (Dilly et al., 2001).
The effect of the cover crops on the microbiological parameters (Cmic, Nmic, BSR and qCO2) varied according
to the used soil management system and harvesting time (Table 1). At the PP, Cmic was influenced by the type of cover crop used in the two management systems, while at the CF significant differences were only observed for NT. Besides, no effect of cover crops was observed at the BF. On the other hand, Nmic was influenced by the cover crops under NT at the PP, under CT at the BF, and under both management systems at the CM (Table 1).
Cover crops and harvesting times had also contrib-uted to Cmic, Nmic, RBS and qCO2 shifts. Dinesh et al.
(2006) reported that Cmic and Nmic of soil under cover crops were two to three times higher when compared to the control (fallow). In this work, significant differences were not observed at this magnitude, however, the results indicate that some cover crops promoted greater stimulus on the microbial biomass attributes, mainly for BSR and
qCO2 at the BF and CF under CT, which could be related to the effect of these plants on the microbial growth as reported by Dinesh et al. (2006).
Pre-planting (PP) Common bean flowering (BF) Corn flowering (CF)
Cmic
(mg kg-1)
Nmic
(mg kg-1)
BSR
(mg kg-1 h-1)
qCO2
(mg g-1 h-1)
Cmic
(mg kg-1)
Nmic
(mg kg-1)
BSR
(mg kg-1 h-1)
qCO2
(mg g-1 h-1)
Cmic
(mg kg-1)
Nmic
(mg kg-1)
BSR
(mg kg-1 h-1)
qCO2
(mg g-1 h-1)
CT
Cj 188.73 a 147.57 a 0.36 a 1.89 a 233.06 a 19.51 ab 0.45 a 2.02 a 233.97 a 56.83 a 0.52 b 2,30 bc Ma 199.79 a 150.29 a 0.30 a 1.48 a 159.48 a 17.87 abc 0.36 ab 2.31 a 155.68 a 52.02 ab 0.52 b 3,31 a F 180.51 ab 162.31 a 0.23 a 1.27 a 187.02 a 13.16 c 0.43 a 2.30 a 161.92 a 27.13 c 0.46 bc 2,87 ab Sb 165.26 ab 157.28 a 0.28 a 1.69 a 155.87 a 21.06 ab 0.32 ab 2.28 a 207.16 a 44.19 ab 0.74 a 3,72 a Cc 177.61 ab 156.89 a 0.23 a 1.28 a 160.50 a 16.37 bc 0.38 ab 2.48 a 168.29 a 38.63 bc 0.35 bc 2,07 bc Ce 147.45 b 141.95 a 0.23 a 1.56 a 198.31 a 21.97 a 0.29 b 1.48 a 203.78 a 47.89 ab 0.31 c 1,53 c
NT
Cj 180.74 d 144.40 ab 0.14 a 0.77 a 213.44 a 20.17 a 0.34 b 1.97 a 298.83 ab 42.53 b 0.49 a 1,70 a Ma 237.71 b 152.62 a 0.15 a 0.67 a 257.94 a 19.69 a 0.34 b 1.39 a 285.63 ab 65.56 a 0.25 b 0,89 a F 310.02 a 127.21 ab 0.12 a 0.39 a 196.72 a 15.98 a 0.39 ab 2.06 a 287.20 ab 56.28 ab 0.40 ab 1,50 a Sb 199.62 bcd 140.98 ab 0.14 a 0.71 a 235.14 a 17.51 a 0.48 a 2.05 a 306.05 ab 54.25 ab 0.37 ab 1,35 a Cc 197.13 cd 125.46 b 0.11 a 0.58 a 276.05 a 17.42 a 0.42 ab 1.66 a 323.33 a 56.94 ab 0.37 ab 1,25 a Ce 229.30 bc 138.62 ab 0.21 a 0.91 a 258.28 a 18.60 a 0.38 ab 1.48 a 179.33 b 56.94 ab 0.29 b 1,61 a
CV(%) 7.75 5.76 30.66 30.93 9.67 10.56 13.99 32.55 9.99 11.38 18.12 19.32
Crotalaria juncea – Cj; Mucuna aterrina – Ma; Fallow – F; Sorghum bicolor – Sb; Cajanus cajan – Cc; and Canavalia ensiformis – Ce. Same letters means no significant differences among treatments in the same column within management system (Tukey’s test p<0.05).
Table 1. Carbon (Cmic) and nitrogen (Nmic) of the microbial biomass, basal soil respiration (BSR) and metabolic quotient (qCO2) of the
soil enzymatic activities under cover crops and soil management systems
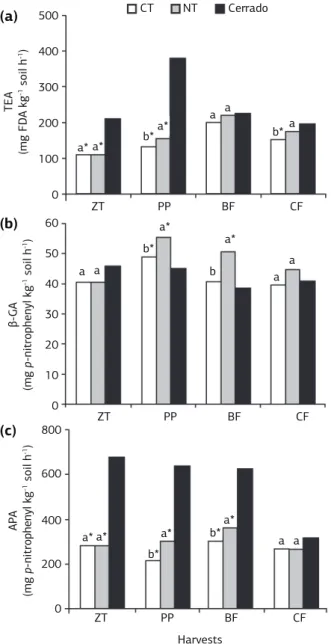
The total enzymatic activity (TEA) at the ZT and PP on the “Cerrado” soil presented values statistically higher than those found under CT and NT and at the CF had differed only from CT. Concerning the management sys-tems at the PP and CF, NT showed TEA values higher than those observed under CT (Figure 2a).
In this research, Cmic content and TEA values were 35% and 13%, higher under NT respectively when compared to CT. On a conventional production tem consisting of different tillage and crop rotation sys-tems carried out on an Oxisol in Paraná state, Brazil, Balota et al. (2004) found values of Cmic 69% higher under NT as compared to CT at 0-0.10 m depth. One explanation for the effect of NT on microbial biomass is that NT systems provide a more suitable habitat for microorganisms.
Similarly, management systems showed effects on the TEA, corroborating findings reported by Omidi et al. (2008), although these effects were not persistent throughout the experimental period, but only at the ZT and PP (Figure 2a). According to Green et al. (2007), NT system can increase the TEA from 18% to 186% at the 0-0.05 m soil layer as compared to CT, however, for larger soil depths difference between CT and NT may not be found.
The “Cerrado” soil showed values of β-Glycosidase activity (β-GA) lower than those observed under CT and NT at the PP and lower than NT at the BF. Moreover, at these same evaluation times NT showed values of β-GA higher than those observed under CT (Figure 2b).
β-GA was also influenced by soil management prac-tices, harvesting times and cover crops. NT system showed greater values of β-GA than CT (Figure 2b) as an influ-ence of the cover crops mainly at BF and CF (Table 2). The largest β-GA found in organically managed soils may be related to the positive effect of green manure on the ac-tivity of that enzyme, probably due to the high microbial biomass produced in response (Tejada et al., 2006), since the β-GA reflects the status of the organic matter and the processes taking place into the soil.
The values of acid phosphatase activity (APA) were consistently higher in “Cerrado” soil, except at the CF when values found under “Cerrado”, CT and NT soils did not show significant difference. Soil management sys-tems showed significant differences only at PP and BF, in which the APA values under NT were higher than those observed for CT (Figure 2c).
The effects of different cover crops on the enzymat-ic activities are shown on table 2. At the PP soil under jack bean, sunn hemp and velvet bean under NT and sorghum under CT showed the highest values of TEA, however, no effects were observed at the other harvesting times. Regarding β-GA, higher values of activity were observes under sunn hemp and jack bean, regardless of the soil system management used. Moreover, high levels of APA might have been associated with legumes, al-though occasionally high values of APA were observed under sorghum (Table 2).
Pearson correlation analysis showed significant and posi-tive relationships between APA and Cmic and between TEA and Cmic, according to the equations APA = 0.623Cmic + 194.9
500 CT
a* a*
a a
a
b*a* b*
a a b
a*
a a b*
a*
NT Cerrado
(a)
(b)
(c)
400
300
TEA
(mg FD
A kg
-1 soil h -1)
h'!
(mg
p
-nitrophenyl kg
-1 soil h -1)
AP
A
(mg
p
-nitrophenyl kg
-1 soil h -1)
200
100
0
60
50
40
30
20
10
0
800
600
400
200
ZT PP
Harvests
BF CF
0
ZT PP BF CF
ZT PP BF CF
a* a* a*
a*
b*
b*
a a
Figure 2. Total enzymatic activity, TEA (a), β-Glycosidase
activity, β-GA (b) and acid phosphatase activity, APA (c) of the
Pre-planting (PP) Common bean flowering (BF) Corn flowering (CF)
TEA β-G A APA TEA β-G A APA TEA β-G A APA
CT
Cj 148.25 a 59.66 a 219.06 ab 269.02 a 40.45 a 224.83 b 161.17 a 47.41 a 252.11 bc Ma 146.88 a 50.08 ab 245.24 a 210.48 a 34.69 a 304.03 ab 141.85 a 23.45 b 194.10 c F 124.57 ab 45.64 ab 189.85 ab 206.21 a 44.47 a 303.57 ab 157.61 a 41.07 ab 317.44 ab Sb 84.42 b 47.72 ab 166.57 b 196.17 a 41.24 a 343.74 a 161.21 a 49.77 a 395.04 a Cc 125.48 ab 48.96 ab 219.04 ab 180.43 a 46.00 a 257.99 ab 143.29 a 43.12 ab 158.78 c Ce 163.74 a 43.14 b 237.48 a 144.28 a 38.44 a 334.27 a 146.20 a 34.69 ab 257.32 bc
NT
Cj 125.13 b 57.76 a 297.53 a 218.27 a 54.29 ab 357.29 a 158.24 a 58.21 a 359.36 a Ma 160.77 ab 58.78 a 308.66 a 205.93 a 52.43 ab 384.65 a 188.31 a 41.10 ab 262.97 ab F 169.16 ab 57.60 a 301.18 a 224.12 a 54.06 ab 391.41 a 165.31 a 51.03 ab 147.60 c Sb 178..92 a 55.09 a 334.59 a 187.72 a 41.64 b 344.83 a 156.83 a 38.83 ab 251.77 abc Cc 127.95 b 53.08 a 266.14 a 212.69 a 46.90 ab 235.90 b 163.44 a 42.60 ab 324.50 ab Ce 164.95 ab 51.41 a 276.48 a 272.84 a 56.67 a 422.45 a 210.37 a 37.69 b 233.73 bc
CV(%) 13.90 10.66 10.81 12.26 12.11 11.08 16.68 18.31 16.20
Crotalaria juncea – Cj; Mucuna aterrina – Ma; Fallow – F; Sorghum bicolor – Sb; Cajanus cajan – Cc; Canavalia ensiformis – Ce. Same letters means no significant differences among treatments in the same column within management system (Tukey’s test p<0.05).
Table 2. Total enzymatic activity (TEA), β-glycosidase (β-GA) and acid phosphatase activity (APA) of the soil cultivated with different
cover crops under conventional tillage system (CT) and no-tillage system (NT). Values are given in mg kg-1 h-1.
(R2 = 0.31**) and TEA = 0.317C
mic + 105.1 (R
2 = 0.36**);
although, positive but not significant correlations were ob-served between APA and Nmic and TEA and Nmic according to the equations APA = 0.495Nmic + 325.2 (R2 = 0.05ns) and
TEA = 0.111Nmic + 171.3 (R2 = 0.03ns). Even without
sig-nificant correlation between β-GA and Cmic, these findings show that soils with high levels of Cmic have raised values of the enzymatic activity, confirming results reported by Klose and Ajwa (2004) who reported that the acid phosphatase activity was higher in soils with high levels of Cmic.
dendrogram analysis of the soil quality indicators
The multivariate analysis of Cmic, Nmic, BSR, qCO2,
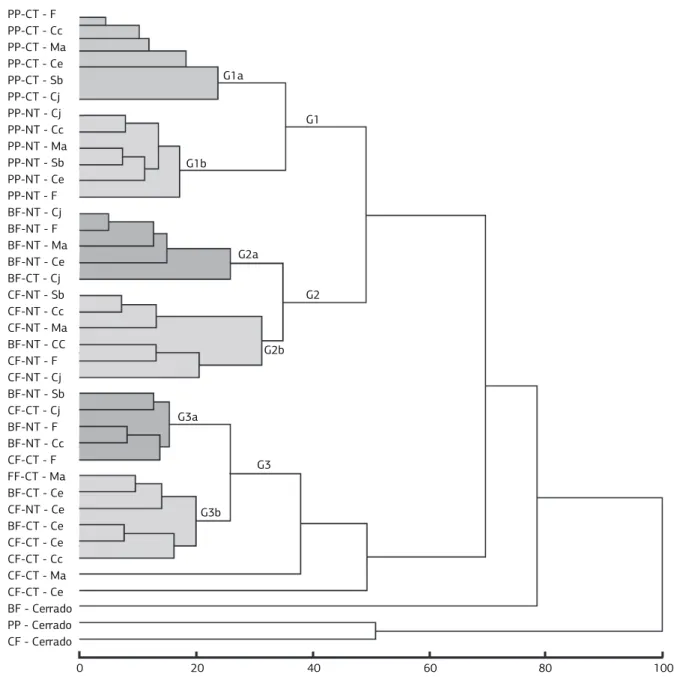
TEA, β-GA and APA data, collected under NT, CT and “Cerrado” at the PP, BF and CF harvesting times, was performed using cluster analysis, allowing the separation of the treatments in three different groups depending on the systems of soil management and harvesting times (Figure 3).
The first group (G1) was formed exclusively by the treatments evaluated at the PP. This group was divided into two subgroups comprising the cover crops under CT (G1a) and the cover crops under NT (G1b). In the subgroup formed by the NT, sunn hemp/pigeon pea and velvet beans/sorghum/jack beans are closer while fallow forms an outer group. The second group (G2) is formed almost exclusively by cover crops under NT, but it was subdivided into two groups, where the first comprises the cover crops at the BF (G2a) and the second the cover crops at the CF (G2b). The group G3 is formed mostly by cover crops under CT, however, it contains the treatments evaluated at the BF and CF (Figure 3).
On the cluster analysis was clearly verified an effect of management systems (CT and NT). In addition, harvest-ing times showed a secondary effect on the clusterharvest-ing of treatments, which had been occurring regardless of the cover crops type (Figure 3). Thus, soil management sys-tem was considered to be the main factor for clusters for-mation, with harvesting time playing a secondary effect. Besides that, cover crops did not influence the final distri-bution of treatments. Although cover crops were consid-ered a key factor affecting soil properties more than plant species (Rutigliano et al., 2004), this effect was not ob-served in this work, which may had been suppressed by more pronounced effects of management systems and harvesting times.
Moreover, it was also observed that the intra-group homogeneity was reduced from PP to CF, which provided a reduction in the capability of treatments clustering over time. This explains the formation of groups and subgroups containing treatments evaluat-ed in different sampling periods, especially at BF and CM. On a study regarding the effect of management history and cover crops on soil microorganisms under organic production system, Robertson and Mor-gan (1996) pointed out that microbial biomass C and N declined during the first 6 months in ex-pasture soils, but remained larger than in ex-vegetable soils, in which there was little change in microbial biomass C and N with time.
4. conclusIon
Some microbiological soil quality indicators are sensitive enough to detect differences among cover crops and soil management systems. Among them, Cmic, qCO2, TEA,
β-GA and APA were more sensitive to soil management, since they showed the effects of the management systems in at least two of the harvesting times.
NT management provides higher microbial bio-mass and enzymatic activity than CT; however, cover crops showed less evident effect on microbiological soil quality indicators as compared to soil manage-ment systems.
This research also points out the importance of NT management in increasing biological activity of soils and also identifies key biological soil quality indicators that are sensitive to tillage management, even under lesser dis-turbed agroecosystems, as was observed for the common bean and corn agroecological production systems.
acknowledgMents
The authors would like to thank to Incra/FAPED/ Embrapa accord for the financial support and Dr. Edson Herculano Neves Vieira for English review.
Figure 3. Cluster analysis performed by using the Euclidian distance as dissimilarity coefficient and total linkage as grouping method.
Dendrogram constructed with the average of the microbial data at the pre-planting (PP), common bean flowering (BF) and corn flowering
(CF), under conventional tillage system (CT) and no-tillage system (NT) and different cover crops (Crotalaria juncea – Cj, Mucuna
aterrina –Ma, Cajanus cajan – Cc, Canavalia ensiformis – Ce, Sorghum bicolor – Sb and Fallow – F) and “Cerrado”.
PP-CT - F PP-CT - Cc PP-CT - Ma PP-CT - Ce PP-CT - Sb PP-CT - Cj PP-NT - Cj PP-NT - Cc PP-NT - Ma PP-NT - Sb PP-NT - Ce PP-NT - F BF-NT - Cj BF-NT - F BF-NT - Ma BF-NT - Ce BF-CT - Cj CF-NT - Sb CF-NT - Cc CF-NT - Ma BF-NT - CC CF-NT - F CF-NT - Cj BF-NT - Sb CF-CT - Cj BF-NT - F BF-NT - Cc CF-CT - F FF-CT - Ma BF-CT - Ce CF-NT - Ce BF-CT - Ce CF-CT - Ce CF-CT - Cc CF-CT - Ma CF-CT - Ce BF - Cerrado PP - Cerrado CF - Cerrado
0 20
G3b
G2b G2 G2a
G3 G3a
G1b
G1 G1a
reFerences
ADACHI, M.; BEKKu, V.S.; RASHIDAH, W.; OKuDA, T.; KOIZuMI, H. Differences in soil respiration between different tropical ecosystems. Applied Soil Ecology, v.34, p.258-265, 2006.
ALTIERI, M.A. Agroecology: the science of natural resource management for poor farmers in marginal environments. Agriculture, Ecosystems and Environment, v.93, p.1-24, 2002.
ANDERSON, T.H.; DOMSCH, K.H. Application of
eco-physiological quotients (qCO2 and qD) on microbial biomasses
from soils of different cropping histories. Soil Biology and Biochemistry, v.22, p.251-255, 1990.
BALOTA, E.L.; COLOZZI FILHO, A.; ANDRADE, D.S.; DICK, R.P. Long-term tillage and crop rotation effects on microbial biomass and C and N mineralization in a Brazilian Oxisol. Soil and Tillage Research, v.77, p.137-145, 2004.
BREMER, E.; ELLERT, K. Soil quality indicators: a review with implications for gricultural ecosystems in alberta. (2004). [cited 2009 Aug 29]. Available from: http://www1.agric.gov.ab.ca/$department/ deptdocs.nsf/all/aesa8681/$FILE/sqi_review_final.pdf.
CARRERA, L.M.; BuYER, J.S.; VINYARD, B.; ABDuL-BAKI, A.A.; SIKORA, L.J.; TEASDALE, J.R. Effects of cover crops, compost, and manure amendments on soil microbial community structure in tomato production systems. Applied Soil Ecology, v.37, p.247-255, 2007.
DILLY, O.; WINTER, K.; LANG, A.; MuNCH, J.C. Energetic eco-physiology of the soil microbiota in two landscapes of southern and northern Germany. Journal of Plant Nutrition and Soil Science, v.164, p.407-413, 2001.
DINESH, R.; SuRYANARAYANA, M.A.; CHAuDHuRI, S.G.; SHEEJA, T.E.; SHIVA, K.N. Long-term effects of leguminous cover crops on biochemical and biological properties in the organic and mineral layers of soils of a coconut plantation. European Journal of Soil Biology, v.42, p.147-157, 2006.
FARIA, S.M.; FRANCO, A.A.; Identificação de bactérias eficientes na fixação biológica de nitrogênio para espécies leguminosas arbóreas. Seropédica: Embrapa Agrobiologia, 2002. 16p. (Embrapa Agrobiologia. Documentos, 158)
FERREIRA, E.P.B.; DuSI, A.N.; XAVIER, G.R.; RuMJANEK, N.G. Rhizosphere bacterial communities of potato cultivars evaluated through PCR-DGGE profiles. Pesquisa Agropecuária Brasileira, v.43, p.605-612, 2008.
FERREIRA, E.P.B.; DuSI, A.N.; COSTA, J.R.; XAVIER, G.R.; RuMJANEK, N.G. Assessing insecticide and fungicide effects on the culturable soil bacterial community by analyses of variance of their DGGE fingerprinting data. European Journal of Soil Biology, v.45, p.466-472, 2009.
GHINI, R.; MENDES, M.D.L.; BETTIOL, W. Métodos de hidrólise de diacetato de fluoresceína (FDA) como indicador da
atividade microbiana no solo e supressividade a Rhizoctonia solani.
Summa Phytopathologica, v.24, p.239-242, 1998.
GREEN, V.S.; STOTT, D.E.; CRuZ, J.C.; CuRI, N. Tillage impacts on soil biological activity and aggregation in a Brazilian Cerrado Oxissol. Soil and Tillage Research, v.92, p.114-121, 2007.
HuNGRIA, M.; FRANCHINI, J.C.; BRANDÃO-JuNIOR, O.; KASCHuK, G.; SOuZA, R.A. Soil microbial activity and crop sustainability in a long-term experiment with three soil-tillage and two crop-rotation systems. Applied Soil Ecology, v.42, p.288-296, 2009.
JENKINSON, D.S.; POWLSON, D.S. The effects of biocidal treatments on metabolism in soil: a method for measuring soil biomass. Soil Biology and Biochemistry, v.8, p.209-213, 1976.
KLOSE, S.; AJWA, H.A. Enzymes activities in agricultural soils fumigated with methyl bromide alternatives. Soil Biology and Biochemistry, v.36, p.1625-1635, 2004.
KOCH, H-J.; STOCKFISCH, N. loss of organic matter upon ploughing under a loess soil after several years of conservation tillage. Soil and Tillage Research, v.86, p.73-83, 2006.
NIELD, J.M.; BAAS, A.C.W. The influence of different environmental and climatic condition on vegetated aeolian dune landscape development and response. Global and Planetary Change, v.64, p.76-92, 2008.
OMIDI, H.; TAHMASEBI, Z.; TORABI, H.; MIRANSARI, M. Soil enzymatic activities and available P and Zn as affected by
tillage practices, canola (Brassica napus L.) cultivars and planting
dates. European Journal of Soil Biology, v.44, p.443-450, 2008.
ROBERTSON, F.A.; MORGAN, W.C. Effects of management history and legume green manure on soil microorganisms under ‘organic’ vegetable production. Australian Journal of Soil Research, v.34, p.427-440, 1996.
RuTIGLIANO, F.A.; D’ASCOLI, R.; SANTO, A.V. Soil microbial metabolism and nutrient status in a Mediterranean area as affected by plant cover. Soil Biology and Biochemistry, v.36, p.1719-1729, 2004.
SANTOS, V.B.; CASTILHOS, D.D.; CASTILHOS, R.M.V.; PAuLETO, E.A.; GOMES, A.S.; SILVA, D.G. Biomassa, atividade microbiana e teores de carbono e nitrogênio totais de um planossolo sob diferentes sistemas de manejo. Revista Brasileira de Agrociência, v.10, p.333-338, 2004.
SILVA, S.C.; XAVIER, L.S.; SANTANA, N.M.P.; CARDOSO, G.M.; PELEGRINI, J.C. Informações meteorológicas para pesquisa e planejamento agrícola referentes ao município de Santo Antônio de Goiás, GO, 2001. Santo Antônio de Goiás: Embrapa Arroz e Feijão, 2002. 21p. (Embrapa Arroz e Feijão. Documentos, 136)
SILVA, M.B.; KLIEMANN, H.J.; SILVEIRA, P.M.; LANNA, A.C. Atributos biológicos do solo sob influência da cobertura vegetal e do sistema de manejo. Pesquisa Agropecuária Brasileira, v.42, p.1755-1761, 2007.
SPARLING, G.P.; WEST, A.W. A direct extraction method to estimate soil microbial C: Calibration in situ using microbial
respiration and 14C labelled cells. Soil Biology and Biochemistry,
TABATABAI, M.A. Soil Enzymes. In: PAGE, A.L.; MILLER,
R.H.; KEENEY, D.R. (Eds.). Methods of soil analysis. 2nd ed.
Madison: ASA, 1982. p.903-943. (Agronomy, 9)
TEDESCO, M.J.; GIANELLO, C.; BISSANI, C.A.; BOHNEN, H.; VOLKWEISS, S.J. Análises de solo, plantas e outros materiais. 2.ed. Porto Alegre: universidade Federal do Rio Grande do Sul, 1995. 174p.
TEJADA, M.; GARCÍA, C.; GONZALEZ, J.L.; HERNÁNDEZ, M.T. Organic amendment based on fresh and composted beet vinasse: influence on physical, chemical and biological properties and wheat yield. Soil Science Society of American Journal, v.70, p.900-908, 2006.
uSDA – The united States Department of Agriculture, National Resources Conservation Service. Indicators for Soil Quality
Evaluation. 1996. (cited 2009 Aug 20). Available from: http://soils. usda.gov/sqi/publications/files/sq_thr_2.pdf.
VANCE, E.D.; BROOKES, P.C.; JENKINSON, D.S. An extraction method for measuring soil microbial biomass C. Soil Biology and Biochemistry, v.19, p.703-707, 1987.
VEPSÄLÄINEN, M.; KuKKLONEN, S.; VESTBERG, M.; SIRVIÖ, H.; NIEMI, R.M. Application of soil enzyme activity test kit in a field experiment. Soil Biology and Biochemistry, v.33, p.1665-1672, 2001.