http://dx.doi.org/10.1590/1413-70542017416015217
Predicting the metabolizable energy of first and second
corn harvests for piglets
Predição da energia metabolizável do milho de primeira e segunda safra para leitões
Lucas Antonio Costa Esteves1*, Newton Tavares Escocard de Oliveira2, Laura Marcela Diaz Huepa1, Silvia Letícia Ferreira3, Leandro Dalcin Castilha1,Paulo Cesar Pozza1
1Universidade Estadual de Maringá/UEM, Departamento de Zootecnia, Maringá, PR, Brasil
2Universidade Estadual do Oeste do Paraná/UNIOESTE, Departamento de Zootecnia, Marechal Cândido Rondon, PR, Brasil
3Universidade Estadual Paulista “Júlio de Mesquita Filho”/UNESP, Faculdade de Medicina Veterinária e Zootecnia, Botucatu, SP, Brasil *Corresponding author: lucasantonio_esteves@hotmail.com
Received in June 16, 2017 and approved in August 18, 2017
ABSTRACT
Corn is one of the primary ingredients in swine diets, but there is a variation in its chemical composition and metabolizable energy (ME) content. Therefore, faster methods are required that can determine more accurate ME values to improve piglet diets. This study determined and predicted the ME of corn from first and second harvests for piglets. Two experiments were conducted to determine the ME values for 18 corn batches, evaluating corn from first and second harvests. The corn batches were analysed to determine the concentration of dry matter (DM), starch (ST), neutral detergent fiber (NDF), acid detergent fiber (ADF), crude protein (CP), ether extract (EE), ash, calcium (Ca), phosphorus (P) and gross energy (GE). To determine the ME values, 40 piglets were used in each experiment, grouped into a randomized block design with four replicates. The ME of the corn from the first and second crops ranged from 3281 to 3509 and from 3143 to 3652 kcal/kg on an as-fed basis, respectively, and the fitted equations to predict the ME presented a low R2. The best fit equation for predicting the ME of corn for piglets was determined to be ME= - 6306.15 + 400.652ADF + 117.286ST + 24924.7Ca + 2489.66P – 148.41CP (R2=0.44) for the first harvest; ME= -7560.08 + 2.66895GE – 120.69ADF (R2=0.48) for the second harvest; and ME= 2848.95 + 68.5714NDF + 161.938EE – 5563.5Ca – 1454.2P (R2=0.41) for the joint harvest.
Index terms: Metabolizability coefficients; prediction equations; swine.
RESUMO
O milho é um dos principais alimentos utilizados em rações para suínos, porém existem variações em sua composição química e conteúdo de energia metabolizável (EM). Portanto, são necessários métodos rápidos para se determinar os valores de EM de forma precisa, melhorando as dietas dos leitões. O trabalho determinou e ajustou equações de predição de EM do milho de 1a e 2a safra para leitões. Foram realizados dois experimentos para determinar os valores de EM de 18 cultivares de milho, avaliando-se os milhos de 1ª e 2ª safras. Foram realizadas as análises de matéria seca (MS), amido (AMI), fibra em detergente neutro (FDN), fibra em detergente ácido (FDA), proteína bruta (PB), extrato etéreo (EE), matéria mineral (MM), cálcio (Ca), fósforo (P) e energia bruta (EB) dos milhos. Para a determinação dos valores energéticos foram utilizados 40 animais em cada experimento, distribuídos em um delineamento experimental de blocos ao acaso com quatro repetições. Os valores de EM dos milhos de 1ª e 2ª safra variaram de 3281 a 3509 e de 3143 a 3652 kcal/kg MN, respectivamente, as equações ajustadas para predizer a EM apresentaram baixo R2. Os melhores ajustes para predizer a EM do milho para leitões são representados pelas equações EM= - 6306,15 + 400,652FDA + 117,286AMI + 24924,7Ca + 2489,66P – 148,41PB (R2=0,44), para os milhos de 1ª safra; EM = -7560,08 + 2,66895EB – 120,69FDA (R2=0,48), para os milhos de 2ª safra; e para o período completo de safras foi ajustada a equação EM= 2848,95 + 68,5714FDN + 161,938EE – 5563,5Ca – 1454,2P (R2=0,41).
Termos para indexação: Coeficiente de metabolizabilidade; equações de predição; suínos.
INTRODUCTION
Corn is one of the primary ingredients in swine diets worldwide, as it is grown in many locations and has a higher nutritional value than other feeds. Conventional corn and soybean meal diets for growing pigs contains approximately 50-70% of the metabolizable energy (ME) supplied by corn (Kil et al., 2014). However, the energy value and chemical composition may vary due to factors
such as the cultivars used, the cultivation period, and the processing and storage.
The ME from pig feed is usually obtained from feed composition tables (NRC, 2012; Rostagno et al., 2017); however, these tables show the average values from several studies.
An adequate knowledge of feed ME is required to
requires a calorimeter and a metabolic assay and is laborious, time-consuming and expensive. In contrast, the prediction equation is an indirect method based on a proximal composition of the feed ingredients routinely obtained from laboratories and is a quick and economical alternative to the nutritional assessment (Zonta et al., 2006).
The ME presented by Rostagno et al. (2017) was determined using growing pigs (20-75 kg). However, piglets have different nutrient digestibility compared with
growing and finishing pigs, and according to Le Goff and
Noblet (2001), the total tract digestibility of nutrients and energy improve as the pigs’ weight increases. Thus,
the ME calculated for growing and finishing pigs may
not be suitable for formulating piglets’ diets. In addition, the harvest season may affect the chemical composition of corn, which may also lead to changes in the ME values.
Adequate knowledgeof the ME of corn is necessary
to fit specific prediction models to estimate the ME for
piglets. The objectives of this study were to determine
the chemical composition and energy values of first and second harvest corn for piglets as well as to fit prediction
equations for the ME.
MATERIAL AND METHODS
Two experiments were conducted in the pig metabolism room at the Universidade Estadual de Maringá-UEM (23° 21’S, 52° 04’W, 564 m altitude).
Eighteen corn cultivars were evaluated, nine from
the first harvest (planting from August to December,
experiment 2) and nine from the second harvest (planting from January to March, experiment 1). The corn cultivars were obtained from different regions around Brazil to achieve a variable chemical composition.
The chemical composition of the corn cultivars was
determined at the Laboratório de Análise de Alimentos e
Nutrição Animal (UEM). The concentrations of dry matter
(DM), neutral detergent fiber (NDF), acid detergent fiber (ADF), crude protein (CP), ether extract (EE), ash and phosphorus (P) were determined per the methods described
by Silva and Queiroz (2012). The starch (ST) concentration was determined per the methods described by the Instituto
Adolfo Lutz (2008).
Calcium analysis (Ca) was performed at the
Laboratório de Bromatologia da Faculdade de Medicina Veterinária e Zootecnia da Universidade de São Paulo.
In each experiment, 40 crossbred barrows (Tybor
X Topigs 20) were used, averaging 8.75 ± 0.22 kg
(experiment 2) and 9.48 ± 0.06 kg (experiment 1) of initial
weight, and were individually housed in metabolic cages
similar to those described by Pekas (1968). The animals
were grouped into a randomized block design with ten treatments (nine corn cultivars and a basal diet), four replicates and one animal per experimental unit.
The corn cultivars replaced 25% of the basal diet, which comprised corn soybean meal, whey powder, whole
milk powder, fish meal, sugar, soybean oil, vitamins,
minerals, amino acids and additives, to meet the nutritional requirements proposed by the NRC (2012).
The amount of daily feed offered to the animals was based on their metabolic weight (BW0.75). To avoid loss and facilitate intake, approximately30% of the feed
was moistened with water. Feed was provided four times
a day (07:30, 10:30, 13:30 and 16:00).
After each meal, water was provided in the same feeder at a ratio of 5 ml of water/g of feed to avoid excess water intakewithout affecting the feed intake.
Each experiment lasted 12 days with a
seven-day adaptation period, followed by five seven-days to collect faeces and urine. Ferric oxide (Fe2O3) was used as a
faecal marker to define the beginning and end of the
collection period.
Faeces were placed in plastic bags and stored (-18 °C). At the end of each experiment, the samples were
thawed, and a 300 g aliquot was removed and dried (55 °C) for 72 hours. The samples were ground after drying.
The urine was collected daily into plastic buckets
containing 20 mL of HCl (1:1) to avoid nitrogen
volatilization and bacterial proliferation. Aliquots of 10%
were filtered and placed in plastic vials, labelled and stored (3 °C) until the gross energy (GE) analysis.
The GE of the faeces, urine, diet and corn samples were determined using an adiabatic calorimeter (Parr®
Instrument Co. AC6200) at COMCAP/UEM per the
procedures described by Silva and Queiroz (2012).
The values of the digestible energy (DE), metabolizable energy (ME), digestibility coefficient of gross energy (DCGE) and metabolizability coefficient of gross energy (MCGE) were determined.
The DCGE and MCGE of the corn cultivars were
analysed by an analysis of variance and Tukey’s test at
5% significance.
To adjust the prediction equations for the ME, a full multiple linear regression model was adjusted using the
GE, CP, EE, ash, ST, NDF, ADF, Ca and P as regressors
using the ordinary minimum square method. The models
and second harvests, and a joint model of both harvests was also adjusted.
The simple and multiple linear regression procedures with indirect disposal techniques (backward)
were used to fit the prediction equations using the Sistema para Análises de Estatística e Genética (SAEG), developed by the Universidade Federal de Viçosa (UFV, 2007).
The main selection criteria were the parameters’
significance determined by the regression models and verified by a partial t-test. The non-significant parameters
were removed from the model, and the analysis was conducted again. The estimated parameters of the regression models were made by using the ordinary least
squares method. A significance level of 5% was used to
test the hypothesis.
RESULTS AND DISCUSSION
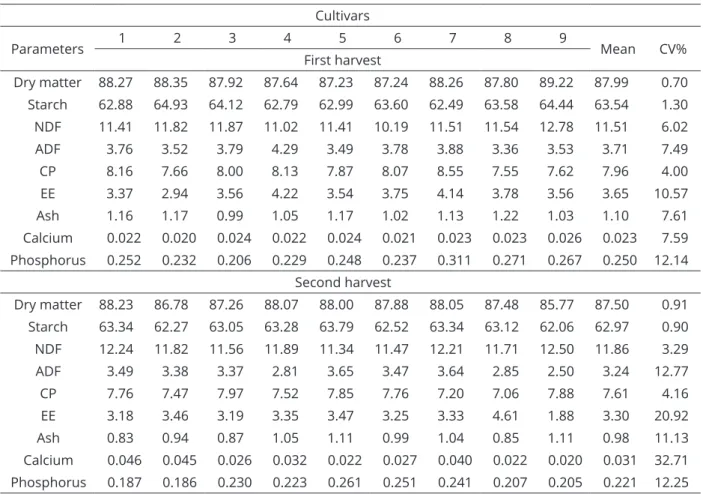
The DM ranged from 87.23 to 89.22% and from 85.77 to 88.23% (Table 1) for the first and second corn
harvests, respectively. These values are similar to those obtained by Castilha et al. (2011), who observed a range of
86.29 to 89.04% when assessing four different corn batches.
Similarly, Rostagno et al. (2017) found an average value
of 88.90% DM, while the NRC (2012) presented 88.31%. Different ranges in the variation and average values
were also observed for the ST concentration based on the assessed harvests (Table 1), with acoefficient of variation
(CV) at 1.30% and 0.90% for the first and second harvests,
respectively.
These results agree with those presented by the NRC (2012) and Rostagno et al. (2017), which were 62.55 and 63.40%, respectively. The variation in ST content
between the first and second harvests is important to
consider since the ST concentration of corn contributes
to its GE value.
The minimum and maximum NDF obtained for
the second harvest corn ranged from 11.34 to 12.50%.
The NDF for the first harvest was even more varied (10.19 to 12.78%); however, the average values were similar between harvests. The obtained NDF values are
in agreementwith those of Rostagno et al. (2011). Eyng et al. (2009) assessed eight corn cultivars and reported high
levels of NDF with a higher variation (14.39 to 17.65%). Nagata et al. (2004) also observed high levels of NDF (14.13 to 15.90%), and Li et al. (2014) observed a wide variation (9.56 to 17.36% at DM basis).
Expressive CVs were observed for the fiber fractions of the corn. These fractions must be considered
when assessing pig diets, since high fiber levels increase
intestinal fermentation and methane synthesis (Kil; Kim; Stein, 2013).
A high EE variability was observed in the assessed
corn (Table 1), which was similar for the second (1.88 to 4.61%) and first (2.94 to 4.22%) harvests. The average
values presented by the NRC (2012) and Rostagno et
al. (2017) were 3.48 and 3.81%, which are similar to the average values obtained in the second and first harvests
of this study, respectively.
The CVs obtained for the CP in the first (4.00%)
and second (4.16%) harvests should be considered when
formulating pig diets. Corn can present the desired CP
levels, but this is generally found in cultivars that were improved for this purpose.
The Ca concentrations (Table 1) are similar to those proposed by Rostagno et al. (2017), except for corns 1, 2 and 7 from the second harvest. The CV obtained for the second harvest corn (32.71%) was higher than that of the
first harvest corn.
The varied chemical composition may be associated with the high availability of commercial corn cultivars
(Farinelli et al., 2003). Previous research on different
corn cultivars also demonstrated this variation in chemical
composition (Li et al., 2014; Castilha et al., 2011; Eyng
et al., 2009).
This variation may also be a result of other factors, such as the cultivation period and location or differing results from the laboratories where the analyses were conducted(Cromwell et al., 1999).
The DCGE and MCGE were different (P<0.05)
between corn cultivars for both the first and second
harvests (Table 2), indicating that only the GE do not provides a good estimation of DE and ME values.
Despite the morphological changes that were
followed by lower brush border enzyme activities in the
piglets’ gut post-weaning (Pácha, 2000), the average MCGE values obtained in this study were similar to those
presented in the feed composition tables (Rostagno et al., 2017; NRC, 2012).
The variation in the chemical composition, DCGE and MCGE was higher for the second harvest corn, than the first. This variation in the chemical composition may cause the observed differences (P<0.001) in the MCGE values.
The DCGE and MCGE ranged from 86.06 to 91.44% and 83.02 to 88.44% for the first harvest, and from 83.53 to 93.90% and 81.32 to 92.06% for the second
harvest, respectively. This variation may be associated with the chemical composition, because according to Noblet
and Henry (1993) a proper use of DE and ME from the
Table 1: Chemical composition (%) of first and second harvest corns, on an as-fed basis.
Cultivars
Parameters 1 2 3 4 5 6 7 8 9 Mean CV%
First harvest
Dry matter 88.27 88.35 87.92 87.64 87.23 87.24 88.26 87.80 89.22 87.99 0.70
Starch 62.88 64.93 64.12 62.79 62.99 63.60 62.49 63.58 64.44 63.54 1.30
NDF 11.41 11.82 11.87 11.02 11.41 10.19 11.51 11.54 12.78 11.51 6.02
ADF 3.76 3.52 3.79 4.29 3.49 3.78 3.88 3.36 3.53 3.71 7.49
CP 8.16 7.66 8.00 8.13 7.87 8.07 8.55 7.55 7.62 7.96 4.00
EE 3.37 2.94 3.56 4.22 3.54 3.75 4.14 3.78 3.56 3.65 10.57
Ash 1.16 1.17 0.99 1.05 1.17 1.02 1.13 1.22 1.03 1.10 7.61
Calcium 0.022 0.020 0.024 0.022 0.024 0.021 0.023 0.023 0.026 0.023 7.59
Phosphorus 0.252 0.232 0.206 0.229 0.248 0.237 0.311 0.271 0.267 0.250 12.14
Second harvest
Dry matter 88.23 86.78 87.26 88.07 88.00 87.88 88.05 87.48 85.77 87.50 0.91
Starch 63.34 62.27 63.05 63.28 63.79 62.52 63.34 63.12 62.06 62.97 0.90
NDF 12.24 11.82 11.56 11.89 11.34 11.47 12.21 11.71 12.50 11.86 3.29
ADF 3.49 3.38 3.37 2.81 3.65 3.47 3.64 2.85 2.50 3.24 12.77
CP 7.76 7.47 7.97 7.52 7.85 7.76 7.20 7.06 7.88 7.61 4.16
EE 3.18 3.46 3.19 3.35 3.47 3.25 3.33 4.61 1.88 3.30 20.92
Ash 0.83 0.94 0.87 1.05 1.11 0.99 1.04 0.85 1.11 0.98 11.13
Calcium 0.046 0.045 0.026 0.032 0.022 0.027 0.040 0.022 0.020 0.031 32.71
Phosphorus 0.187 0.186 0.230 0.223 0.261 0.251 0.241 0.207 0.205 0.221 12.25
NDF - neutral detergent fiber, ADF – acid detergent fiber, CP – crude protein, EE – ether extract, CV – coefficient of variation.
The average ME from the second harvest corn (3343 kcal/kg) was similar to that (3360 kcal/kg) proposed by Rostagno et al. (2017) as well as to the average value
for the first harvest corn (3400 kcal/kg).
The ME of first harvest ranged from 3281 to 3509 kcal/kg, while for the second harvest, it ranged from 3143 to 3652 kcal/kg (Table 2). The lower ME variation from the first harvest compared with second harvest corn, may be related to the low variation in the chemical composition (Table 1). These results demonstrate the need for methods that accurately estimate the ME of corn since there is considerable variation in the ME values for the first and second harvests, with an expressive variation in the second harvest (509 kcal/kg).
The correlation matrix (Table 3) from the fitted
prediction equations demonstrated that the ME was
negatively correlated with the total NDF, CP, ash and P of the first and second harvests as well as the total
harvest period (first and second harvests together).
However, different individual responses were observed.
For example, in comparing the second harvest with the total harvest period, the ADF was negatively correlated with the ME, which was not the case with the first
harvest. The Ca was also different, because only on the total period and on the second harvest it was negatively correlated with the ME. The EE and the ST were positively correlated with the ME, across all conditions.
Kim et al. (2004) also found that different correlations exist between the nutrient and energetic values based on which month the feed is cultured. They studied different wheat varieties for piglets and found that
the total content of xylose, insoluble xylose, NDF, total P and phytic P negatively influenced the 1999 harvest wheat DE. However, the 2000 wheat harvest did not present a
correlation among these parameters. By combining the
Table 2: Gross (GE), digestible (DE) and metabolizable (ME) energy, digestibility (DCGE) and metabolizability
(MCGE) coefficients of gross energy and ME:DE ratio of the first and second harvests for piglets on an as-fed basis.
Corn GE (kcal/kg) DCGE1 (%) DE (kcal/kg) MCGE1 (%) ME (kcal/kg) ME:DE
First harvest
1 3952 86.06b 3401 83.02b 3281 0.96
2 3932 88.50ab 3480 85.79ab 3374 0.97
3 3978 89.28ab 3552 85.35ab 3396 0.96
4 3980 90.60a 3606 87.31ab 3475 0.96
5 3911 88.83ab 3474 86.00ab 3364 0.97
6 3870 91.44a 3539 88.15a 3412 0.96
7 3955 88.81ab 3512 85.33ab 3375 0.96
8 3929 90.29a 3547 86.88ab 3413 0.96
9 3968 91.28a 3622 88.44a 3509 0.97
CV(%) - 1.90 - 2.23 -
-P-value - 0,004 - 0,017 -
-Second harvest
1 3921 90.86ab 3563 89.31ab 3502 0.98
2 3854 84.98cd 3275 83.55cd 3220 0.98
3 3865 83.53d 3228 81.32d 3143 0.97
4 3874 88.41bc 3425 86.35bc 3345 0.98
5 3887 88.05bc 3423 87.51bc 3401 0.99
6 3889 86.60bcd 3368 84.97bcd 3304 0.98
7 3899 85.86cd 3348 84.49cd 3294 0.98
8 3967 93.90ª 3725 92.06a 3652 0.98
9 3743 87.99bc 3293 86.26bc 3229 0.98
CV(%) - 2.05 - 2.18 -
-P-value - <0,001 - <0,001 -
-1Means followed by different letters in the column differs by Tukey’s test (P<0.05). CV – coefficient of variation.
In a similar way, Li et al. (2014) also noticed that the ME was negatively correlated with the CP, NDF, ADF and ash. In addition, Pozza et al. (2010) found that crude fiber was negatively correlated and EE was positively
correlated with energetic values.
The positive correlation between ME and EE may be due tothe fat in the gut allowing a better use of nutrients in the diet, since it may inhibit gastric emptying
and provide improvements in the digestibility (Pozza et al., 2008).
Ash acts as a GE diluent, reducing the feed’s organic material content (Morgan et al., 1987), thereby negatively affecting the GE values. The Ca and total P
content were also negatively correlated with the ME since they are part of the ash content.
Piglets use less fiber than grown pigs, which also may
have contributed to the negative correlation with the ME.
Similarly, Noblet and Le Goff (2000) also reported that fiber (crude fiber, NDF and ADF) negatively affects the DE and ME.
Fiber is a complex dietary component that may
interfere with the pigs’ complete starch digestion because it may encapsulate the ST, limiting digestive enzyme
access, and consequently, digestion (Lenis et al., 1996). Moreover, some fiber types raise digestive viscosity, which
Table 3: Correlation matrix among the corn culture components based on the harvest.
First harvest
Item ME ST NDF ADF CP EE Ash Ca P GE
ME 1.0000 - - -
-ST 0.1687 1.0000 - - -
-NDF -0.0314 0.0471 1.0000 - - -
-ADF 0.1674 -0.4026 -0.4892 1.0000 - - -
-CP -0.1567 -0.6238 -0.5591 0.7197 1.0000 - - - - -EE 0.3454 -0.5818 -0.3892 0.6280 0.5771 1.0000 - - -
-Ash -0.3402 -0.1498 -0.0177 -0.4702 -0.2217 -0.2217 1.0000 - -
-Ca 0.1723 -0.2229 0.6196 -0.2821 0.1575 0.1575 -0.2082 1.0000 - -P -0.1097 -0.6571 0.0934 -0.2058 0.3643 0.3643 0.4137 0.2121 1.0000 -GE 0.2290 -0.1077 -0.6927 0.1232 0.3628 0.2919 -0.5237 -0.4073 0.0358 1.0000
Second harvest
Item ME ST NDF ADF CP EE Ash Ca P GE
ME 1.0000 - - -
-ST 0.0921 1.0000 - - -
-NDF -0.0478 0.1717 1.0000 - - -
-ADF -0.2256 -0.2385 -0.5097 1.0000 - - -
-CP -0.4844 0.1945 0.0804 -0.0243 1.0000 - - - -
-EE 0.5278 -0.1028 -0.6178 0.2147 -0.7354 1.0000 - - -
-Ash -0.3131 0.2520 0.1928 -0.1866 0.2495 -0.5420 1.0000 - -
-Ca -0.1266 -0.4536 0.1961 0.4544 -0.2711 0.0576 -0.3761 1.0000 -
-P -0.2388 0.0540 -0.5665 0.3550 0.1121 0.0068 0.4968 -0.5211 1.0000
-GE 0.6298 -0.0769 -0.3650 0.1113 -0.6746 0.9032 -0.7242 0.0635 -0.2289 1.0000 First and second harvest
Item ME ST NDF ADF CP EE Ash Ca P GE
ME 1.0000 - - -
-ST 0.1352 1.0000 - - -
-NDF -0.0918 -0.0011 1.0000 - - -
-ADF -0.0032 -0.1313 -0.5776 1.0000 - - -
-CP -0.2503 -0.2165 -0.4034 0.4532 1.0000 - - - - -EE 0.5001 -0.2253 -0.5290 0.4328 -0.0890 1.0000 - - -
-Ash -0.1840 0.1022 -0.1448 0.1110 0.2902 -0.1916 1.0000 - -
-Ca -0.1582 -0.2832 0.3543 -0.0622 -0.3933 -0.1073 -0.5089 1.0000 - -P -0.0865 -0.2894 -0.3103 0.3390 0.3390 0.2573 0.5850 -0.4800 1.0000 -GE 0.4724 -0.0542 -0.3381 0.5100 0.5099 0.7793 -0.0865 -0.2340 0.0464 1.0000
The CP was also negatively correlated with the ME
(Table 3), and per the NRC (2012), when there is low quality or excess protein, the amino acids may not be used for protein synthesis and may instead be catabolized and used as an energy source. This result in nitrogen being excreted in the urine, with a loss of energy and a reduced ME. The energy lost through the urine represents a ranged percentage
of DE, which is dependent on the urinary nitrogen amount. The ST shows a high DE and ME, reaching 3594 and
3533 kcal/kg, respectively, on an as-fed basis (Rostagno et al., 2017). However, this value may change, since the ST is formed by amylose (glycose molecules bound by a
straight-chain that bind α(1-4)) and amylopectin (glycose molecules bound by a branched-chain that bind α(1-4) and α(1-6)). The
amylose:amylopectin ratio of corn may affect the digestibility
of the ST and other nutrients. Due to chain branching, the
amylopectin may be more easily hydrolysed by hydrolytic enzymes. Thus, the ST digestibility and ME increase with the increased amylopectin content (Mazur; Nakatani, 1993).
The prediction equations (Table 4) presented a low R2, suggesting that the adherence of the equations to the observed ME values was of low magnitude. However,
Pelizzeri et al. (2013) validated prediction equations for
the corn ME values with an intermediate R2 (0.63 to 0.79). The R2 for the prediction equations was also
more intermediate than those found by Li et al. (2014), which ranged from 0.20 to 0.87. The higher R2 value was
obtained when the equations were composed with DE as the regressor since DE is a digestible fraction; however, these equations were more difficult to use.
Table 4: Intercept, regression and determination coefficients of the prediction equations for the metabolizable
energy (ME) of the corn cultivars from the first, second and total harvest period (first and second harvests),
adjusted on a dry matter basis.
First harvest
Equations fitted for the thorough model
Equation Intercept GE ADF NDF EE ST Ash Ca P CP R2
ME1 -6306.15 - 400.652 - - 117.286 - 24924.7 2489.66 -148.41 0.44 ME2 -8532.92 - 295.476 - - 135.412 - 29396 2150.88 - 0.35 ME3 -1294.83 - 150.791 - - 54.5973 - 22407 - - 0.22
Equations fitted using NDF. CP. EE. Ash and GE
ME4 5086.31 - - - 142.047 - -328.10 - - -154.84 0.39
ME5 4578.66 - - - 155.598 - - - - -150.45 0.30
ME6 3522.57 - - - 82.2153 - - - 0.11
Second harvest
Equations fitted of the thorough model
ME1 -7560.08 2.66895 -120.69 - - - 0.48
ME2 7412.44 2.53486 - - - 0.40
Equations fitted using NDF. CP. EE. Ash and GE
ME3 -15010.2 3.86472 - 85.6882 - - 485.543 - - - 0.49
ME4 5815.85 - - - -229.46 0.23
First and second harvests
Equations fitted of the thorough model
ME1 2848.95 - - 68.5714 161.938 - - -5563.5 -1454.2 - 0.41 ME2 3872.19 - - - 128.416 - - -4248.5 -1520.8 - 0.36
Equations fitted using NDF. CP. EE. Ash and GE
ME3 334.272 0.90886 - - 57.9377 - - - - -86.93 0.32
GE - gross energy, ADF - acid detergent fiber, NDF - neutral detergent fiber, EE - ether extract, ST - starch, Ca - calcium,
The equation that presented the highest R2 (0.49) was adjusted for the second harvest corn, which was more varied in its chemical composition and ME values. These equations may be validated by an independent dataset, since their applicability and accuracy must be assessed for relating the ME to other corn cultivars.
The adjusted equations are composed by using a maximum of four chemical composition parameters as
the regressors. There is much interest in using DE and
ME prediction equations composed by only one or more chemical composition parameters.
CONCLUSIONS
The ME of the different corn cultivars for the
piglets ranged from 3281 to 3509 kcal/kg for the first
harvest corn and from 3143 to 3652 kcal/kg for the second
harvest corn. The best fit equation for predicting the ME of corn for piglets is ME= - 6306.15 + 400.652ADF + 117.286ST + 24924.7Ca + 2489.66P – 148.41CP for the first harvest corn; ME= -7560.08 + 2.66895GE – 120.69ADF for the second harvest corn; and ME= 2848.95 + 68.5714NDF + 161.938EE – 5563.5Ca – 1454.2P for
the total harvest period.
REFERENCES
CASTILHA, L. D. et al. Modelos matemáticos para predição
dos valores energéticos do milho para suínos. Revista
Brasileira de Saúde e Produção Animal, 12(2):456-467,
2011.
CROMWELL, G. L. et al. Variability among sources and
laboratories in nutrient analyses of corn and soybean meal. Journal of Animal Science, 77(12):3262-3273,
1999.
EYNG, C. et al. Composição química e valores energéticos de
cultivares de milho para aves. Revista Brasileira de Saúde
e Produção Animal, 10(1):60-72, 2009.
FARINELLI, R. et al. Desempenho agronômico de cultivares
de milho nos períodos de safra e safrinha. Bragantia,
62(2):235-241, 2003.
INSTITUTO ADOLFO LUTZ. Métodos Físico-Químicos para Análise de Alimentos. Odair Zenebon, Neus Sadocco
Pascuet e Paulo Tiglea (Coord). 4 ed. São Paulo: Instituto Adolfo Lutz. 2008. 1020p.
KIL, D. Y.; KIM, B. G.; STEIN, H. H. Feed energy evaluation for
growing pigs. Asian-Australasian Journal of Animal
Sciences, 26(9):1205-1217, 2013.
KIL, D. Y. et al. Digestibility of crude protein and amino acids
in corn grains from different origins for pigs. Animal Feed Science and Technology,196:68-75, 2014.
KIM, J. C. et al. Effect of variety growing region and growing
season on digestible energy content of wheats grown
in Western Australia for weaner pigs. Animal Science,
78(1):53-60, 2004.
LE GOFF, G.; NOBLET, J. Comparative total tract digestibility
of dietary energy and nutrients in growing pigs and adult sows. Journal of Animal Science,
79(1):2418-2427, 2001.
LENIS, N. P. et al. Effect of dietary neutral detergent fiber on ileal digestibility and portal flux of nitrogen and amino
acids and on nitrogen utilization in growing pigs. Journal
of Animal Science, 74(11):2687-2699, 1996.
LI, Q. et al. Predicting corn digestible and metabolizable energy
content from its chemical composition in growing pigs.
Journal of Animal Science and Biotechnology, 5(1):11, 2014.
MAZUR, A. K.; NAKATANI, H. Multiple attack mechanism in the porcine pancreatic α amylase hydrolysis of amylose and
amylopectin. Archives of Biochemistry and Biophysics,
306(1):29-38, 1993.
MORGAN, C. A. et al. The prediction of the energy value of
compounded pig foods from chemical analysis. Animal Feed Science and Technology, 17(2):81-107, 1987.
NAGATA, A. K. et al. Energia metabolizável de alguns
a l i m e n t o s e n e r g é t i c o s p a r a f r a n g o s d e c o r t e ,
determinada por ensaios metabólicos e por equações de predição. Ciência e Agrotecnologia, 28(3):668-677,
2004.
NATIONAL RESEARCH COUNCIL - NRC. Nutrient requirements
of swine. 11 ed. Washington. DC: National Academy, 2012.
400p.
NOBLET, J.; HENRY, Y. Energy evaluation systems for pig diets: A review. Livestock Production Science, 36(2):121-141, 1993.
NOBLET, J.; LE GOFF, G. Utilisation digestive et valeurs
énergétiques du blé, du mais et leurs co-produits chez le porc en croissance et la truie adulte. Journées de la
Recherche Porcine en France, 32:177-183, 2000.
PÁCHA, J. Development of intestinal transport function in
PEKAS, J. C. Versatile swine laboratory apparatus for physiologic
and metabolic studies. Journal of Animal Science,
27(5):1303-1306, 1968.
PELIZZERI, R. N. et al. Avaliação de modelos de predição da
energia metabolizável do milho para suínos. Arquivo
Brasileiro de Medicina Veterinária e Zootecnia,
65(2):460-468, 2013.
POZZA, P. C. et al. Determinação e predição dos valores de
energia digestível e metabolizável da farinha de vísceras para suínos. Revista Brasileira de Saúde e Produção
Animal,9(4):734-742, 2008.
POZZA, P. C. et al. Determinação e predição de valores energéticos de silagem de grãos úmidos de milho
para suínos. Ciência e Agrotecnologia,
34(1):226-232, 2010.
ROSTAGNO, H. S. et al. Tabelas brasileiras para aves e suínos: Composição de alimentos e exigências nutricionais.
3.ed. Viçosa:UFV, 2011. 252p.
ROSTAGNO, H. S. et al. Tabelas brasileiras para aves e suínos: Composição de alimentos e exigências nutricionais.
4.ed. Viçosa:UFV, 2017. 488p.
SILVA, D. J.; QUEIROZ, A. C. Análises de alimentos: Métodos químicos e biológicos. 3.ed. Viçosa: UFV, 2012. 235p. UNIVERSIDADE FEDERAL DE VIÇOSA – UFV. Sistema para
análise estatística e genética – SAEG, versão 9.1. Viçosa: UFV, 2007.
ZONTA, M. C. de M. et al. Energia metabolizável de farinhas
de soja ou produtos de soja determinada pelo método