AR
TIGO
AR
TICLE
1 Facultad de Ciencias de la Salud, Universidad de Tarapacá. Calle 18 de Septiembre 2222. 1010069 Arica Tarapaca Chile. [email protected] 2 Pan American Health Organization. Washington USA.
3 Universidad de La Frontera. Temuco Chile. 4 Universidad Católica de Temuco. Temuco Chile. 5 Programa de Pós-Graduação em Saúde Baseada em Evidências, Universidade Federal de São Paulo. São Paulo SP Brasil.
Transport accident mortality in Chile: trends from 2000 to 2012
A mortalidade por acidentes de transporte em Chile:
tendências de 2000 a 2012
Resumo O objetivo deste estudo é descrever as tendências da mortalidade por acidente em trans-porte no Chile, entre 2000-2012, por ano, dis-tribuição geográfica, gênero, idade e tipo de aci-dente. Estudo populacional. Foram usados dados de mortalidade por acidentes de transporte entre 2000-2012. Taxas brutas e ajustadas de mortali-dade por acidentes no transporte por região foram calculadas por 100.000 habitantes. A variação percentual anual (APC) da taxa e os riscos re-lativos (RR) foram calculados. A taxa média de mortalidade por acidentes no transporte (TAMR) no Chile (2000-2012) foi de 12,2. As taxas dos ho-mens (19.7) foram maiores que as das mulheres (4.8), com RR de 4.1. As taxas foram mais ele-vadas no sul do país (15.9), apresentando cresci-mento nos últimos anos, com uma APC significa-tiva e posisignifica-tiva nas áreas norte e central. A região de Maule teve a maior taxa (21.1), embora a de Coquimbo tenha apresentado APC (2.2%) signi-ficativa. A taxa mais elevada (20.3) foi verificada no grupo de 25-40 anos. Em 2008 foi registrada a taxa mais elevada (14.3). O tipo mais frequente de acidente é o que envolve pedestres. Em geral, a APC tende a apresentar crescimento significativo. Isto, somado a um rápido crescimento automotivo anual, só irá agravar a mortalidade por acidentes de transporte.
Palavras-chave Acidentes de transporte, Morta-lidade, Chile, América Latina
Abstract The aim of this study is to describe the trends of transport accident mortality in Chile from 2000 to 2012 by year, geographic distri-bution, gender, age group, and type of accident. Population-based study. Data for transport acci-dent mortality in Chile between 2000 and 2012 were used. The crude and adjusted per region transport accident mortality rates were calculated per 100,000 inhabitants. The annual percentage change (APC) of the rates and relative risks (RR) were calculated. The average transport accident mortality rate (TAMR) in Chile (2000-2012) was 12.2. The rates were greater in men (19.7) than in women (4.8), with a RR of 4.1. The rates were higher in the country’s southern zone (15.9), in-creasing in recent years in the southern zone, with a significant positive APC in the northern and central zones. The Maule region had the highest rate (21.1), although Coquimbo was the region with the most significant APC (2.2%). The high-est rate (20.3) was verified in the 25-40 age group. The highest rate (14.3) was recorded in 2008. The most frequent type of accident was pedestrian. In general the APC trends of the rates are increasing significantly. This, added to rapid annual auto-motive growth, will only exacerbate mortality due to transport accidents.
Key words Transport accidents, Mortality, Chile, Latin America
Tamara Otzen 1
Antonio Sanhueza 2
Carlos Manterola 3
Monica Hetz 4
O
tz
Introduction
According to calculations by the World Health Organization (WHO), 56 million people died worldwide in 2012, of whom 1.24 million were due to transport accidents, which represents al-most 3,500 deaths/day (600 more deaths/day than in 2000). These data put transport accidents as the ninth cause of death in the world and sev-enth in middle-high income countries1. Current trends indicate that transport accidents will be-come the fifth cause of death by 20302.
The International Statistical Classification the Diseases and Related Health Problems, Tenth Edition (ICD-10) is one of the most frequently used international standards to prepare statis-tics of morbidity and mortality in the world3. Transport accidents are defined as any accident involving a means designed essentially to take to people or goods from one place to another, or used primarily for that purpose at the time of the accident. They are included in chapter XX, codes V01-V99 (external causes of morbidity and mor-tality), and are divided according to: the type of injury (pedestrian, pedal cyclist, motorcyclist, occupant of vehicle), the type of vehicle involved (from bicycle to air transport), type of accident (with active or passive participation), and un-specified others3.
In 2012, transport accidents were the main cause of death in the 5-14 age group in the Americas, and the second cause in the 15 to 44 age group, which in crude terms means a total of 142,252 deaths, and the number of injured peo-ple is estimated to be more than 5 million. In the Southern Cone, 28.6% of deaths are a result of transport accidents2,4.
In a study that used figures from 2006-2007 for transport accidents, Chile, with a mean rate of 13.7 per 100,000 inhabitants, was below the mean rate for the Americas (15.8)2. It must also be noted that there were 73,276 transport acci-dents in Chile in 2013, of which 1,623 were fatal-ities5. These numbers denote a mortality rate of 9.2 per 100,000 inhabitants6. In addition, in 2012 there were 11,485 more transport accidents than in the 2010 with an increase of 100 in the number of fatalities7.
In Chile, the main causes of fatal transport accidents between 2000 and 2012 were: pedestri-an recklessness, driver recklessness, presence of alcohol, and loss of control by the driver (total 76.7%)5. In 2012 the type of transport accidents with the greatest number of fatalities was pedes-trian collision (42.7%). The age group with the
highest mortality by transport accidents accord-ing to 2012 figures was 19 - 63 (84.7%). In addi-tion more men (83%) died than women5.
A large part of the research conducted in Chile has only been descriptive, without delving more deeply into the relationship of these rates to other variables. Far from this trend, in 2014 a study in Chile was carried out that sought to determine how the reform of the 2005 traffic law, police behavior and investment in highway infra-structure affected fatal traffic accidents and those causing severe casualties between 2000 and 2012. It found that they brought about a reduction in deaths and accidents, from 7% to 60%8. World-wide, a meta-analysis performed with studies from 1975 to 2007 found that road safety cam-paigns reduced accidents by 9%9. Another study was published in 2015 to determine the effects of the increase in police traffic enforcement record-ed after the introduction of Chile’s 2005 traffic law reform on reducing traffic fatalities and in-juries; it reported that the introduction of the reform and legal penalties actually did have the desired effect for the 2007-2012 period10.
In addition to the suffering that this issue represents for those injured and their relatives, it also produces a considerable demand for pre-hospital and hospital trauma care, with the resulting overload in health care services and the high cost involved for society as a whole2.
In this light, the aim of this study was to de-scribe the transport accidents mortality trends in Chile between 2000 and 2012 by year, gender, age group, geographic distribution, and type of accident.
Materials and methods
Design: Population-based study.
Subjects: The databases used were provided
by the National Office of the Chilean Foren-sic Medical Service (SML) and Pan-American Health Organization (PAHO). Specifically, the SML gave us the number of deaths from 2000 to 2012 by sex and region, and the PAHO the num-ber of deaths from 2000 to 2011 by age group and type of accident.
Deaths classified with codes V01-V99 of ba-sic cause of death according to the ICD-10 were selected3.
Study variables: Year, geographic distribution, gender, age group, and type of accident.
aúd
e C
ole
tiv
a,
21(12):3711-3718,
2016
northern (regions of Tarapacá, Antofagasta, Ar-ica and Parinacota, Atacama, and Coquimbo), central (regions of Valparaíso, Libertador Ber-nardo O’Higgins, Maule and Metropolitan), and southern (regions of Bío Bío, La Araucanía, Los Lagos, Los Ríos, Aisén, Magallanes and Chilean Antarctica). This grouping takes the geographical distribution of Chile into account, in addition to what has been done in previous studies11,12. The variable age was used categorically in 5 groups (under 16; 17 to 24; 25 to 40; 41 to 59; and over 60). The variable type of accident was used cat-egorically, classifying it according to the ICD-10, codes V01-V99. The classification was as follows: 1) V01-V09 “Pedestrian injured in transport accident”; 2) V10-V19 “Pedal cyclist injured in transport accident”; 3) V20-V39 “Motorcycle rider injured in transport accident” and “Occu-pant of three-wheeled motor vehicle injured in transport accident”; V40-V49 “Car occupant in-jured in transport accident”; V50-V59 “Occupant of pick-up truck or van injured in transport ac-cident”; V60-V69 “Occupant of heavy transport vehicle injured in transport accident”; V70-V79 “Bus occupant injured in transport accident”; V80-V88 “Other land transport accidents spec-ified”; V89 “Other land transport accidents un-specified”; V90-V99 “Water transport accidents”, “Air and space transport accidents” and “Other and unspecified transport accidents”3.
Data analysis: Exploratory analyses were per-formed using the raw data. Descriptive statistics were applied, calculating percentages, measures of central tendency, and variability. The crude transport accident mortality rates (TAMR) per region were calculated per 100,000 inhabitants and this information was used to create the ta-bles and graphs. The weighted calculation of rates was applied, so the percentage of total rep-resentation of inhabitants in the country accord-ing to the number of inhabitants in each region was included1; these data were obtained from the Chilean National Statistics Institute (INE)13,14.
Then, an analysis was made of the annual percentage change (APC) of the rates, using a linear regression model with the respective 95% confidence intervals (CI) and p value15. Next, the logarithm of the rates standardized per year and region was fitted by applying a linear regression model, which enabled estimation of the average annual change in the percentage rate, the CI and p values. Finally, relative risks (RR) were deter-mined by geographic distribution, gender, age group, and type of accident, calculating their re-spective APC and 95% CI. The regression model
was developed to identify the relation between the year and the rates in the different groups, thereby identifying whether the annual variation has significant variations and predicting the in-crease in the rates in the coming years11,12,15.
To complement these analyses, the gross mor-tality rates for transport accidents per 100,000 ve-hicles was calculated, also calculating the APC15. The analyses were performed using the STA-TA v. 9.0 statistics software.
Ethics: This study did not require the appli-cation of ethical safeguards, as official Chilean government statistics were used for the analyses.
Results
In Chile between 2000 and 2012 there were 25,889 deaths by transport accidents, of which 20,748 (80.1%) were men. The TAMR in this period was 12.2 (Table 1). The years with the highest TAMR were 2008, 2006 and 2009 (14.3; 13.0 and 12.6, respectively). The years with the lowest TAMR were 2002 and 2001 (10.7 and 10.9, respectively) (Table 2).
By region, the highest rates 2000-2012 were observed in Libertador Bernardo O’Higgins, Maule and Arica and Parinacota (21.3; 19.1 and 17.1, respectively). In 2008, this difference changed, there being no trend in the regions with higher or low rates (Table 1).
Analyzing by geographic zone in the study, it was observed that the zone with the highest TAMR was the north (13.4) and the one with the lowest TAMR was the center (11.4). This trend has appeared in recent years, since from 2000 to 2003 and 2005 it was the central zone that led the rates, and in 2004, 2006 and 2007 it was the southern zone with the highest TAMR (Table 1) (Figure 1).
Contrasting TAMR by gender verified that the TAMR were always higher in men than wom-en. Both men and women presented their high-est TAMR in 2008 (22.7 and 6.0, respectively). In 2001, the men presented the lowest TAMR (17.3); a situation that occurred in women in 2003 (3.8) (Table 2) (Figure 2).
In relation to the TAMR in the different age groups, from 2000 to 2012 the highest mortality rate was verified in the 25 to 40 age group (20.3); the lowest rate was in the group under 16 (6.0). These differences remained constant every year with the exception of 2004, when the group over 61 years of age had the lowest rate (Table 1).
O
tz
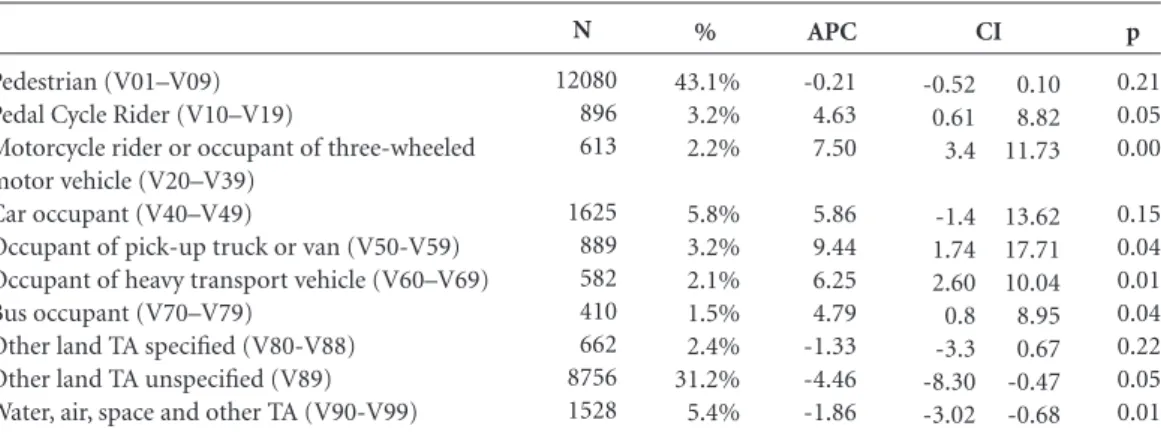
by “pedestrian injured in transport accidents” (43.1%), and 8,756 deaths by “other
unspeci-fied land transport accidents” (31.2%). The oth-er causes are detailed in Table 3. Ungrouped by gender and age group, the same trends repeat. A year-on-year analysis of the different causes of death revealed that these two types remained constant as the most frequent every year.
By contrast, 2006, 2007, 2008 and 2011 had slight variations in the causes of mortality, where “car occupant” and “occupant of a pick-up truck or van” presented the following mortality per-centages by year (11.9%, 12.2%, 15.1%, 18.4%, respectively) and (7.7%, 5.6%, 10.5%, 10.0%, respectively). “Other unspecified land transport accidents” (V89) decreased (18.9%, 20.8%, 8.8%, 7.2%, respectively) (Table 3).
In terms of the trend of types of deaths by transport accidents year-on-year from 2000 to 2011, the most stable is “pedestrian” because it has the lowest variation, with a tendency to de-crease (APC = 0.2%, CI = -0.2 to 0.5, p = 0.21). On the other hand, “occupant of pick-up truck or van” presents the greatest year-on-year increase (APC = 9.4%, CI = 1.7 to 17.7, p < 0.05) (Table 3).
The trend of mortality by transport accidents between 2000 and 2012 had an APC of 0.5% (CI = 0.0 to 0.9, p = 0.07), what means that despite observing an increase of 0.5% every year, this in-crease was not statistically significant (Table 1). To be able to complement this, the mortality rate per 100,000 vehicles was calculated from 2000 to 2012, and this was 10.2. In addition, it was ob-served that the year with the highest rate was 2001 (17.3) and the year with the lowest rate was 2012 (6.0). In addition, the APC of -3.6 (CI = -4.5 to -2.7, p < 0.00) indicates a significant year-on-year reduction in mortality rates due to vehicles.
An analysis of the trend between regions from 2000 to 2012 revealed that Antofagasta had the greatest APC (3.4% [CI = 0.4 to 4.8, p < 0.01]), which indicates that the APC increased significantly every year. The Metropolitan region is the only one with a significant negative APC, -0.6% (CI = -0.9 to -0.2, p < 0.05), which means the TAMR tended to decrease annually (Table 1).
The APC was greater in the northern zone (2.4% [CI = 1.5 to 3.3, p < 0.01]), and lower in the central zone, with a 1.1% variation (CI = -0.2 to -0.8, p = 0.6) (Table 2).
In the 2000-2012 period the women present-ed a greater APC of 0.8% (CI = 0.8 to 1.6, p = 0.05) (Table 2), which indicates a slight but sta-tistically significant increase.
Analyzing this variable by age group, the greatest observed decline of crude mortality rate was observed in the 15 to 24 age group (APC = -
p 0.07 0.13 0.05 0.00 0.61 0.01 0.04 0.08 0.00 0.17 0.00 0.44 0.01 0.16 0.06 0.02 0.09 0.11 0.01 0.50 0.30 0.98 0.10 0.17 0.13 0.23 General rate Men Women Northern Zone Central Zone Southern Zone Arica and Parinacota Tarapacá Antofagasta Atacama Coquimbo Valparaíso Metropolitan L. B. O’Higgins Maule Bío Bío La Araucanía Los Ríos Los Lagos Aisén Magallanes and Ch. Ant. 0 to 16 17 to 24 25 to 40 41 to 59 61 or older
Rate 12.2 19.7 04.8 13.4 11.4 12.7 17.1 15.3 12.4 12.5 12.8 10.7 9.5 21.3 19.1 12.3 14.6 12.2 12.5 10.3 10.8 6.0 14.2 20.3 17.1 7.7 APC 0.45 0.36 0.82 2.36 -0.16 1.05 1.37 1.36 3.41 1.13 3.08 -0.52 -0.56 -0.62 1.52 1.32 0.81 0.96 3.08 1.38 1.22 -0.01 -0.49 -0.37 -0.35 0.47
Table 1. Transport accident mortality rate per 100,000 population with their respective 95% CI.
0.02 -0.07 0.08 1.45 -0.76 0.35 0.21 0.00 0.35 -0.37 1.67 -1.77 -0.94 -1.42 0.13 0.42 -0.04 -0.12 1.01 -2.46 -0.96 -0.78 -1.02 -0.86 -0.76 -0.24 0.89 0.80 1.56 3.28 0.44 1.76 2.54 2.73 4.82 2.64 4.50 0.75 -0.19 0.19 2.94 2.22 1.67 2.06 5.19 5.38 3.44 0.77 0.04 0.13 0.07 1.19 CI Women 4.58 4.62 3.92 3.78 4.27 4.71 5.76 4.36 5.99 4.92 5.04 5.15 4.95 Year 2000 2001 2002 2003 2004 2005 2006 2007 2008 2009 2010 2011 2012 n 1767 1700 1676 1791 1998 2005 2130 2041 2381 2123 2103 2131 2043 Rate 11.48 10.92 10.70 11.31 12.49 12.40 13.04 12.37 14.27 12.58 12.32 12.35 11.71
Table 2. Transport accident mortality rate per 100,000 population, by year and gender.
aúd
e C
ole
tiv
a,
21(12):3711-3718,
2016
0.5% [CI = -1.0 to 0.5, p = 0.10]), which denotes a decrease in its rates over time (Table 1).
The greater risk of mortality by transport accidents in men over women was verified for 2000-2012 (RR of 4.1); this difference decreased over the years, with an APC of the RR being -0.5% (CI = -1.1 to 0.2, p = 0.2) (Table 4).
A greater risk of mortality by transport acci-dents was observed in the northern zone
com-pared to the central zone (RR of 1.2 (CI = 0.9 to 1.3)), with a significant APC of 2.5% (CI = 1.4 to 3.6, p < 0.01). When contrasting the regions with the highest and lowest TAMR (O’Higgins/ Metropolitan), we found a RR of 2.2 (CI = 2.1 to 2.4), with an APC of -0.1 (CI = -0.9 to 0.8, p = 0.9) (Table 4).
The greater risk of mortality by transport accidents was confirmed as “pedestrians”
com-p
0.21 0.05 0.00 0.15 0.04 0.01 0.04 0.22 0.05 0.01 Pedestrian (V01–V09)
Pedal Cycle Rider (V10–V19)
Motorcycle rider or occupant of three-wheeled motor vehicle (V20–V39)
Car occupant (V40–V49)
Occupant of pick-up truck or van (V50-V59) Occupant of heavy transport vehicle (V60–V69) Bus occupant (V70–V79)
Other land TA specified (V80-V88) Other land TA unspecified (V89) Water, air, space and other TA (V90-V99)
N
12080 896 613 1625 889 582 410 662 8756 1528
%
43.1% 3.2% 2.2% 5.8% 3.2% 2.1% 1.5% 2.4% 31.2% 5.4%
Table 3. Types of transport accident with their respective percentages and annual percentage change with 95% CI.
-0.52 0.61 3.4 -1.4 1.74 2.60 0.8 -3.3 -8.30 -3.02
0.10 8.82 11.73 13.62 17.71 10.04 8.95 0.67 -0.47 -0.68
CI APC
-0.21 4.63 7.50 5.86 9.44 6.25 4.79 -1.33 -4.46 -1.86
p
0.22 0.00 0.90 0.04 0.43 Men/women
Northern/Central O’Higgins/Metropolitan Pedestrian/Bus occupant 25 to 40 / 0 to 16 years
RR
4.12 1.17 2.24 29.46 3.37
Table 4. Relative risk with their 95% CI and annual percentage change of relative risks with their 95% CI.
-1.13 1.41 -0.86 -8.82 -1.20
0.24 3.64 0.76 -0.87 0.49
CI APC
-0.45 2.52 -0.05 -4.92 -0.36 3.90
0.91 2.06 25.99 3.14
4.51 1.28 2.43 64.36 3.65
CI
Figure 1. Transport accident mortality rate per 100,000 population by zone. 2000
7,00 9,00 11,00 13,00 15,00 17,00 19,00
2001 2002 2003 2004 2005 2006 2007 2008 2009 2010 2011 2012
O
tz
pared to “bus occupant”, (RR of 45.2 (CI = 26.0 to 64.4)), with an APC of -4.9 (CI = -8.8 to -0.9, p < 0.05) in the 2000-2012 period (Table 4).
A greater risk of mortality by transport acci-dents was verified in the 25-40 age group over the 0-16 group (RR of 3.4 (CI = 3.1 to 3.7)), with an APC of -0.4 (CI = -1.2 to 0.5, p = 0.4) in the study period (Table 4).
Discussion
Considering the main results of our study, we found similarities with the research conducted in Chile and the Americas on mortality by exter-nal causes, where the rates are higher in men, the south of the country and in the 25-40 age group, as well as in the trends of year-on-year increases in the rates11,12.
Perhaps there can never be enough research into transport accidents to be able to create awareness of the gravity of the increased mor-tality by transport accidents in Chile every year, since although the APC is never actually signifi-cant, it is always very close.
It must also be stressed that we only found negative and significant APCs in the Metropoli-tan region, which is clearly where most Chileans live, but in several regions of the northern and southern zones the APCs are positive and signif-icant, which indicates that we are not approach-ing the problem of transport accidents adequate-ly and in a decentralized manner. To better un-derstand this, we must explain that in Chile the population in 2014 was estimated at 17.8 million, with 40.6% of the inhabitants being in the Met-ropolitan region, and from 11.8 to 0.6% living in the other 14 regions14.
None of this is surprising given that more than half of the countries of the Americas lack national policies that support investment in pub-lic transport and promote non-motorized trans-port, such as bicycles2. Therefore, it is essential to make road safety a public health priority; from this follows the need to ensure the human and fi-nancial resources to implement intersectoral ac-tions on this issue, e.g. the proposal produced in 2011 by the PAHO as a response to the problem of the road safety4.
The protective and risk factors associated with road safety are many, with the most com-mon in Chile being: the reduction of speed and alcohol intake, helmet, safety belt use and a safe-ty seat for minors2. This situation is well known, but not usually or permanently adopted by the
populace. This fact (known by sector authorities) demands the need for public service campaigns, which undoubtedly would impact favorably on reducing TAMR as well as the number of those seriously injured and disabled. Since there is evi-dence to account for the positive impact of these measures on TAMR9, a line of research could be developed in Chile. Implementation of these measures should be undertaken with caution; first, studies to support the promotion of one measure over another must be a priority. It is also recommended that the research already conduct-ed on this subject be critically reviewconduct-ed.
In Chile there is a governing entity for road safety, the National Transit Safety Commission, which has been implementing for some time a large number of the safety measures established by international bodies (speed limits, driving with no alcohol intake, helmet use, safety belt use even in public transport vehicles, obligatory use of safety seats for children, etc.)2. The important modifications to the traffic law include Decree 22 of 200616 and Emilia’s law of 2014, which se-verely punishes causing serious or critical injury or death while driving under the influence of al-cohol17. However, this study does not show a re-duction in TAMR in the years following the first reform. Another study shows a 7% reduction in pedestrian fatalities8.
Unfortunately, the relation between imple-mentation of measures to improve road safety and the increase of vehicles on the roads seems out of proportion. The number of vehicles in Chile is currently estimated at more than 4 mil-lion, and it is projected that for 2025, it will range between 6.5 and 6.8 million light and medium vehicles, and the country will have 19.4 million people18.
To respond to these demands, the country needs an investment in urban transport esti-mated at US$ 58.115 million to allow people to continue having access to infrastructure services in line with a country with a per capita income approaching US$20,000 million19. Therefore, the problems related to transport will increase in sev-eral ways more than just the mortality rates.
aúd
e C
ole
tiv
a,
21(12):3711-3718,
2016
by transport accidents for statistical purposes (while some countries define transport-related death as that which happens at any time after the event, others limit it to only those people who die at the site of the accident)2.
Also in Chile in relation to the types of trans-port accidents, we observed that 33.3% of the accidents were classified as unspecified, which makes it more difficult to be able to include this situation accurately.
Another interesting topic associated with the quality of the records are the differences and similarities between the three sources of data (PAHO, SML and CONASET) related to mortal-ity from transport accidents in Chile.
Whereas the proportion of pedestrians who die from transport accidents is considerably higher than other types of accidents, in the fu-ture analyses excluding this group could be per-formed, which may provide a clearer picture of what is occurring with the other types of death.
It would be interesting to investigate in the future how psycho-social factors are associated with TAMR, e.g. those related to quality of life, to thus be able to identify which population groups require more timely intervention and how psy-cho-social factors are related to TAMR. It would also be interesting to be able to enquire about the relation between the number of deaths due to transport accidents and the increase in vehicles, using advanced statistical models that make it possible to combine a variety of factors, for
ex-ample the analysis of inequalities using a linear regression analysis20.
It is also known that day-to-day efforts are being made to improve the records to then be able to contrast the situation in Chile with that of other countries. However, there continues to be differences among the entities that record the information, finding small differences in the number of deceased, which opens the door to in-vestigate the reason for these incongruities.
It should be noted that the authors decided to use the concept of “transport accidents” guided by the criteria of the ICD-10 and following the WHO guidelines, without denying that in other research on this issue the concept of “road crash-es” or traffic is used8-10,21.
Conclusion
This study is one of the few conducted in Chile to describe the trends in mortality from transport accidents. Finding an increase in the rates during the study period, being higher in men, the south of the country and in the 25 to 40 age group, it is worth noting that pedestrians are the most af-fected group. Nevertheless, changes in the trends of TAMR are predicted.
We must not forget that transport accidents are a cause of completely avoidable mortality, and it is therefore crucial to internalize this topic and implement the relevant measures to decrease mortality rates.
Collaborations
O
tz
Chile. Instituto Nacional de Estadisticas [INE]. Proye-cciones y Estimaciones de Población. 1990-2020 [on the Internet] 2008 [cited 2015 Jul 27]. Available from: http://www.ine.cl/canales/chile_estadistico/demogra- fia_y_vitales/proyecciones/Informes/MicrosoftWord-InforReg_T.pdf
Chile. Instituto Nacional de Estadisticas [INE]. Ac-tualización de Población 2002-2012 y Proyecciones 2013-2020 [on the Internet] 2014 [cited 2015 Jul 27]. Available from: http://www.ine.cl/canales/sala_prensa/ revistaseconomicas/presentaciones/pdf/proyecciones_ poblacion_2014.pdf
Sanhueza A, Otzen T, Manterola C, Araneda N. Statis-tical Approaches for Analyzing a Continuous Outcome in Experimental Studies. Int J Morphol 2014; 32(1):339-350.
Asociación Nacional Automotriz de Chile [ANAC]. Anuario Automotriz 2014/2015 [on the Internet] 2014 [cited 2015 Jul 25]. Available from: http://www.anac.cl/ noticias/articulo/anuario-automotriz-2014-2015 Gobierno de Chile. Decreto 22. In., vol. 249803. Diario Oficial: Govierno de Chile. [on the Internet] 2006 [cit-ed 2015 Jul 26]. Available from: http://www.conaset.cl/ wp-content/uploads/2014/01/dto_22_20_MAY_2006. pdf.
Gobierno de Chile. Ley Emilia. In., vol. 20770. Diario Oficial [on the Internet] 2014 [cited 2015 Jul 30]. Avail-able from: http://www.conaset.cl/ley-emilia.html Cámara Chilena de la Construcción [CChC]. Infrae-structura Crítica para el Desarrollo, Bases para un Chile integrado [on the Internet] 2014 [cited 2015 Jul 30]. Available from: http://www.cchc.cl/uploads/archi- vos/archivos/Infraestructura-Critica-para-el-Desarrol-lo_2014-2018.pdf
Keppel K, Pamuk E, Lynch J, Carter-Pokras O, Kim I, Mays V, Pearcy J, Schoenbach V, Weissman JS. Meth-odological issues in measuring health disparities. Vital Health Stat. Edited by Statistics NCfH, vol. 2; 2005: 22. Perel P, Ker K, Ivers R, Blackhall K. Road safety in low-and middle-income countries: a neglected research area. Injury Prevention 2007; 13(4):227-227.
Artigo apresentado em 07/12/2015 Aprovado em 19/07/2016
Versão final apresentada em 21/07/2016 13.
14.
15.
16.
17.
18.
19.
20.
21. References
World Health Organization (WHO). Completeness and coverage of death registration data. Health statis-tics and information systems [on the Internet] 2014 [cited 2015 Jul 26]. Available from: http://www.who. int/healthinfo/statistics/mortcoverage/en/
Pan-American Health Organitation (PAHO). Data on road safety in the Region of the Americas. [on the In-ternet] 2013 [cited 2015 Jul 27]. Available from: http:// www.who.int/violence_injury_prevention/road_safe-ty_status/2013/report/factsheet_paho_es.pdf World Health Organization (WHO). International Sta-tistical Classification of Diseases and Related Health Problems 10th Revision. In. Edited by WHO [on the In-ternet] 2015 [cited 2015 Jul 27]. Available from: http:// apps.who.int/classifications/icd10/browse/2016/en Chile. Instituto Nacional de Estadisticas [INE]. Cara-bineros, Informe Anual [on the Internet] 2013 [cited 2015 Jul 25]. Available from: http://www.ine.cl/canales/ menu/publicaciones/calendario_de_publicaciones/ pdf/informe_anual_carabineros_2013.pdf
Corporación Nacional de Seguridad y Tránsito [Cona-set]. Información Estadística de Accidentes de Tránsito en Comunas, Distritos, Circunscripciones y Regiones de Chile [on the Internet] 2013 [cited 2015 Jul 26]. Available from: http://www.conaset.cl/wp-content/up-loads /2014/10/Distritos_circunscripciones2013.pdf Corporación Nacional de Seguridad y Tránsito [Cona-set].Accidentes de Tránsito Asociados a la Presencia de Alcohol [on the Internet] 2013 [accessed 2015 Jul 29]. Available from: http://www.conaset.cl/wp-content/up-loads/2015/04/alcohol_2013.pdf
Pan-American Health Organitation (PAHO). Informe sobre el Estado de la Seguridad Vial en la Región de Las Américas [on the Internet] 2009 [accessed 2015 Jul 28]. Available from: http://www.who.int/violence_injury_ prevention/road_safety_status/2009/gsrrs_paho.pdf Nazif-Munoz JI, Quesnel-Vallee A, Van den Berg A. Ex-plaining Chile’s traffic fatality and injury reduction for 2000-2012. Traffic Inj Prev 2014; 15(Supl. 1):S56-S63. Phillips RO, Ulleberg P, Vaa T. Meta-analysis of the ef-fect of road safety campaigns on accidents. Accid Anal Prev 2011; 43(3):1204-1218.
Nazif-Munoz JI, Quesnel-Vallee A, Van den Berg A. Did Chile’s traffic law reform push police enforcement? Un-derstanding Chile’s traffic fatalities and injuries reduc-tion. Inj Prev 2015; 21(3):159-165.
Otzen T, Manterola C, Sanhueza A, Escamilla-Cejudo J. Mortalidad por suicidio en Chile: tendencias en los últimos años. Rev Med Chil 2014; 142(3):305-313. Otzen T, Sanhueza A, Manterola C, Melnik T. Homi-cide in Chile: Trends 2000 – 2012. BMC Psychiatry
2015; 15:312. 1.
2.
3.
4.
5.
6.
7.
8.
9.
10.
11.
aúd
e C
ole
tiv
a,
21(12):3711-3718,
2016
p. 3711
onde se lê:
Tamara Otzen 1 Antonio Sanhueza 2 Carlos Manterola 1 Monica Hetz 1 Tamara Melnik 3
leia-se:
Tamara Otzen 1 Antonio Sanhueza 2 Carlos Manterola 3 Monica Hetz 4 Tamara Melnik 5
onde se lê:
1 Ciencias Médicas, Universidad de La Frontera. Avda. Francisco Salazar 1011. Temuco IX Región Chile. [email protected]
2 Departamento de Matemática y Estadísticas, UFRO. Temuco Chile.
3 Programa de Pós-Graduação em Saúde Baseada em Evidências, Universidade Federal de São Paulo. São Paulo SP Brasil.
leia-se:
1 Facultad de Ciencias de la Salud, Universidad de Tarapacá. Calle 18 de Septiembre 2222. 1010069 Arica Tarapaca Chile.
2 Pan American Health Organization. Washington USA.
3 Universidad de La Frontera. Temuco Chile. 4 Universidad Católica de Temuco. Temuco Chile.