ABSTRACT
ORIGINAL AR
growth restriction
Neonatal and Intensive Clinical Pediatrics Division, Children’s Institute
Nursery Annex of the Maternity of the Clinics Hospital of the São Paulo
University Medical School, São Paulo, Brazil
INTRODUCTION
Epidemiological studies have docu-mented an inverse relationship between birth weight and blood pressure levels in childhood and adulthood.1 According to the
fetal origins hypothesis, birth weight (BW) is a marker for the quality of the intrau-terine environment, which is responsible for programming blood pressure and other cardiovascular risks factors.2
There is evidence to suggest that uterine conditions may affect kidney size, which is a potential surrogate measurement for the number of nephrons. Various experimental models for intrauterine growth retardation have demonstrated that reduced kidney weight persists throughout the animal’s life, despite compensatory hypertrophy.3-6 In humans,
low BW full-term infants have lower kidney weight and lower glomerular profi le density than do infants with greater BW.7
Although a moderate defi ciency in neph-rons alone might not be expected to result in hypertension, several clinical observations and experimental studies have provided strong support for the notion that defi cient numbers of nephrons predispose towards hypertension in later life. A direct relation-ship between total glomerular count and BW was demonstrated in autopsy kidneys;8 black
subjects had smaller kidneys, attained higher blood pressures in response to sodium load-ing, and displayed reduced capacity to excrete sodium load;9 modest reductions in nephron
count in rats, induced by gentamicin ad-ministration during gestation, were shown to be associated with glomerulosclerosis in maturity;10 maternal dietary protein
restric-tion of 6% was found to be associated with mean systolic blood pressure of 159 mmHg in offspring at nine weeks, compared with 137 mmHg at nine weeks in offspring of rats that were fed normal protein intake.11
OBJECTIVE
The present study was designed to investi-gate whether a signifi cant relationship between intrauterine growth restriction (IUGR) and blood pressure is identifi able in newborns. Particularly, the possibility of relationships between anthropometrical parameters, kidney size, plasma renin activity and systolic blood pressure was explored.
METHODS
A prospective study was conducted in the Nursery Annex of the Maternity Hospital, Neonatal and Intensive Clinical Pediatrics Division, Instituto da Criança, Hospital das Clínicas, Faculdade de Medicina da Universi-dade de São Paulo (HC-FMUSP), during the period from March 3, 2001, to May 5, 2003. The study was previously granted approval by the institution’s Ethics Committee for Research Project Analysis.
After obtaining written consent from the parents, newborns were selected at birth, in accordance with the inclusion criteria that they had to be healthy term newborns of gestational age ranging from≥ 37 weeks to < 42 weeks, without malformations and with an Apgar score at the fi fth minute > 6. Gestational age was determined from the mother’s last menstrual period, and was confi rmed by a fi rst-trimester scan. The exclusion criteria were: maternal use of an-tihypertensives, diuretics and corticosteroids during pregnancy, maternal addictions, ma-ternal chronic arterial hypertension, genetic abnormalities and congenital infections in the newborns, multiple gestation, and res-piratory, metabolic or infectious disorders in the newborns.
IUGR was defi ned as BW lower than the 10th percentile of the intra-uterine growth
curves for gestational age for this hospital population, in association with the criteria
CONTEXT AND OBJECTIVE: Low birth weight is associated with higher blood pressure in child-hood and adultchild-hood. The aim of this study was to investigate the infl uence of intrauterine growth restriction (IUGR) on newborn systolic blood pressure (SBP).
DESIGN AND SETTING: Prospective compara-tive study at Neonatal and Intensive in Clinical Pediatrics Division, Maternity Hospital in Hospital das Clínicas, Faculdade de Medicina da Univer-sidade de São Paulo.
METHODS: 35 newborns with IUGR and 35 without IUGR were compared. Healthy term new-borns without malformations, with Apgar score at fi fth minute > 6 were included. Birth weight, kidney weight/birth weight ratio, kidney weight (ultrasound scan), plasma renin activity (PRA) and SBP evolution were analyzed during the fi rst month of life (on 1st, 3rd, 7th and 30th days).
RESULTS: SBP evolution, kidney weight/birth weight ratio and PRA did not differ between the two groups. In newborns with IUGR, SBP presented positive correlations with birth weight (r = 0.387 p = 0.026) and BMI (r = 0.412 p = 0.017) on the 7th day of life. Positive
correla-tions with birth weight (r = 0.440 p = 0.01) and birth length (r = 0.386 p = 0.026) were also seen on the 30th day. There was an inverse correlation
on the 7th day between SBP and kidney weight/
of Kramer et al. for IUGR,12 in which the
ratio between the observed BW and the mean BW (weight of 50th percentile, WP50)
(BW/WP50) for gestational age was lower than 0.85.
The newborns were divided into two groups: Group I (with IUGR) and Group II (without IUGR). The subjects for Group II were selected among those born immediately following the identifi cation of each patient with IUGR.
Anthropometric variables at birth (weight, length and head circumference), indices (body mass index, ponderal index and arm circumference/head circumference ratio), gestational age confi rmation, plasma renin activity (PRA) evaluation from the umbilical cord, kidney weight (evaluated by ultrasound, on the third day of life) and systolic blood pressure on the fi rst and third days of life were obtained while the newborns were still in the maternity hospital.
At outpatient returns, anthropometric measurements and blood pressure were ob-tained on the 7th and 30th days, and a blood
sample for PRA assay was collected on the 30th day of life.
Blood was collected from the placental end of the umbilical vein following delivery of the baby and by venipuncture on the 30th day
of life. Four milliliters of the blood taken was added to a tube containing 0.5 ml of 0.3 mol disodium ethylene diamine tetraacetic acid (EDTA) and centrifuged at 4° C for 15 mi-nutes. The plasma supernatant was decanted, divided into two aliquots and stored at -20° C until it was assayed for PRA.
A widely accepted non-invasive oscil-lometric monitor (Dixtal®) was used for the
blood pressure measurements. These were performed on the right upper arm, which was stretched out parallel to the trunk, at heart level. The cuff was placed at the midpoint of the upper arm. The measurements were made while the newborn was in its own crib, in a wakeful state without crying, one hour after breast feeding, in the presence of the mother. The cuff sizes used followed the recommendations of the Second Task Force Report: the width of the infl atable part of the cuff bladder was 40% to 50% of the circum-ference of the arm.13 Three blood pressure
readings were recorded on each measurement date, with 10-minute intervals between them. The fi nal result taken was the mean of the values obtained.
Kidney weight was calculated using a portable gray-scale ultrasound equipment (Toshiba Sonolayer®, model SSH-140 A/G)
at newborn´s third day of life. This equip-ment is usually used at this nursery when any sonogram is required, for example: abdominal or transcranial sonogram. The examinations were performed by the same operator (a medical doctor working at the Radiology Institute), who was blinded to the infant’s status. The newborn was kept in ventral decubitus and the transducer was placed on the lumbar region to make the kidney measurements. The length, anteroposterior diameter and width of the kidney were measured for all the infants. The kidney volume was calculated using the following formula: kidney volume = 0.49 x length x width x anteroposterior diameter.14
The kidney weight was estimated from the volume found, using a conversion rate of 1 cm3 = 1 gram. The fi nal result taken was
the mean of the weights found for both kidneys. Kidneys present echogenicity that allows easy identifi cation of their limits via ultrasound. Thus, measurement of this organ is a procedure that only presents a small degree of subjectivity.
Plasma renin activity (PRA) was measured indirectly, by means of the radioimmu-noassay method, using the REN CT2® device
to quantify angiotensin I in human plasma. The examination consisted of quantifying the competence of the plasma for generating angiotensin I, under temperature and pH conditions relating to in vivo conditions. The results were expressed in nanograms of angiotensin I generated per milliliter per hour (ng/ml/h).
STATISTICAL ANALYSIS STATISTICAL ANALYSIS
The sample size calculation was based on an alpha of 5% and a test power of 80%. The standard deviation for mean arterial pressure was taken to be 20 mmHg, with the aim of detecting a difference in mean pressure of at least 25%. Thus, a sample size of 35 newborns for each group was obtained.
The population was described by means of central tendency measurements (means) and dispersions (standard deviations), and also percentages.
Student’s t test was used to compare pairs of means. Whenever the assumptions for this test were not satisfi ed, its non-parametric equivalent (the Mann-Whitney test) was brought in. To evaluate continuous variables, one-way analysis of variance (ANOVA test) was used. To analyze arterial pressures in relation to anthropometric variables and the plasma renin activity, Pearson’s correlation test was used. The statistical signifi -cance level was set at 0.05.
RESULTS
The characteristics of the newborns are presented in Table 1.
There were no differences in maternal characteristics between the two groups, with regard to age, number of pregnancies, race and delivery type. Diseases like gestational hypertension and asthma were more frequent in group I; however, specifi c medications for these diseases were not used.
Male gender predominated among the newborns without IUGR (group II) and the gestational age was also signifi cantly greater in group II. In accordance with the study design, newborns with IUGR presented birth weight, length, head circumference, BW/WP50 ratio, arm circumference/head circumference ratio (AC/HC), body mass index (BMI) and pon-deral index (PI) that were smaller than those of the newborns without IUGR.
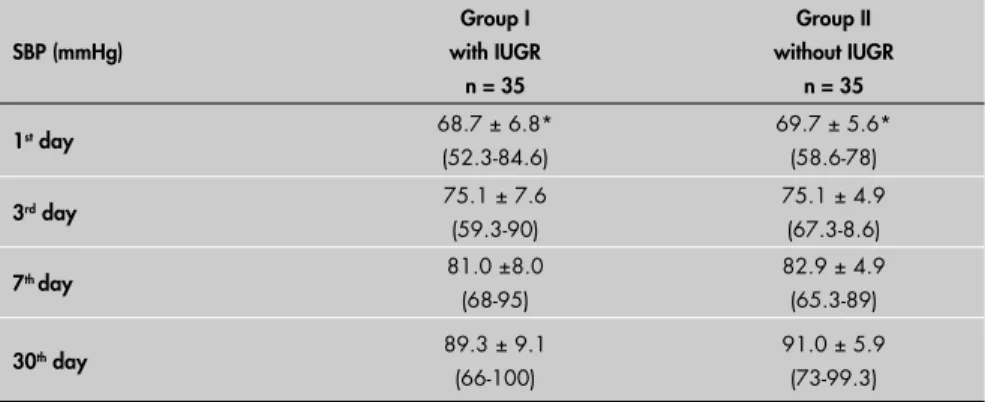
The arterial pressures increased during the fi rst month of life. Systolic arterial pressure increased in a statistically signifi cant man-ner from the fi rst to the third day, from the third to the seventh day and from the seventh to the thirtieth day of life in both groups (Table 2). The systolic blood pressures did not differ signifi cantly between the two groups at any time point. Moreover, there were no dif-ferences in mean and diastolic blood pressures between the groups.
The PRA levels did not differ between the newborns in the two groups (Table 3), at any of the times when measurements were made. However, there was a statistically signifi cant reduction on the 30th day of life in relation to the
birth levels observed in both groups. PRA assays were not performed on all blood samples because there was insuffi cient material in 28 samples.
The newborns with IUGR presented kidney weights that were statistically smaller than in newborns without IUGR. However, when kidney weight was analyzed in relation to birth weight, there was no longer any dif-ference (Table 3).
In newborns with IUGR, systolic blood pressure presented positive correlations with birth weight (r = 0.387 p = 0.026) and BMI (r = 0.412 p = 0.017) on the 7th day of life
(Figure 1). Positive correlations with birth weight (r = 0.440 p = 0.01) and birth length (r = 0.386 p = 0.026) were also seen on the 30th
day. There was an inverse correlation on the 7th day between systolic arterial pressure and the
DISCUSSION
Adverse intrauterine conditions may program physiology and metabolism for the whole lifetime. Studies have produced evi-dence that the quality of intrauterine growth, as expressed through weight and body propor-tions at birth, could predict disease patterns in adults. At present, an inverse association between arterial hypertension and birth weight is recognized. This effect is present in childhood, less evident in adolescence and extends throughout adult life,1 although the
importance of such an association has been questioned by some authors.15
The present study investigated the infl u-ence of IUGR on the evolution of systolic blood pressure levels over the fi rst month of life. The natural history of blood pressure in full-term infants was well documented by the present authors in a previous study, using the same methodology.16 Although blood pressure
increased signifi cantly from the fi rst to the 30th
day of life, it did not differ between the two groups. Therefore, newborns with or without IUGR presented similar blood pressure evo-lution during the neonatal period. Systolic blood pressure presented positive correlations with birth weight, length and BMI in the examinations performed on the 7th and 30th
days of life in newborns with IUGR. In these analyses, blood pressure seemed to relate more to the physiological aspects of fetal growth, as represented by somatic development. Thus, heavier newborns presented higher blood pressure levels.
Hence, the inverse relationship between blood pressure and birth weight that has been recognized in childhood and adulthood was not yet present at this time. Therefore, these results concord with other published data17-19 that found a direct relationship
between blood pressure and birth weight during the fi rst days of life. The present study has added to these, by showing that such a relationship may extend to the entire neonatal period, on the basis of the results from the 30th day of life. No correlation between blood
pressure and birth weight was observed in the group without IUGR.
The mechanisms that control arterial pressure are not totally understood. In this context, the angiotensin-renin system can be highlighted because of its known role in the physiology of cardiovascular homeostasis.20
The levels of angiotensin-renin are extremely variable in studies of arterial hypertension. However, even at low levels, angiotensin-renin activity is present and is proven by the blood pressure response to angiotensin-converting
Table 1.Characteristics of the newborns at birth
Characteristics of the newborns
Group I with IUGR
n = 35
Group II without IUGR
n = 35 Gender
Male 16 (45%) 22 (62.8%)*
Gestational age (weeks) 38.3 + 0.9 39.6 + 1.2*
Type of delivery Vaginal Cesarean
16 (45.6%) 19 (54.2%)
13 (37.1%) 22 (62.8%) Race
White Black Other
18 (51.4%) 3 (8.5%) 14 (40.1%)
18 (51.4%) 3 (8.5%) 14 (40.1%) Diseases
Gestational hypertension Asthma
Sickle cell disease Others
5 (14.2%)* 2 (5.7%) 2 (5.7%) 5 (14.2%)
2 (5.7%) 2 (5.7%)
0 3 (8.5%)
BW (grams) 2247 + 170.4 3338 + 210.1*
Length (cm) 44.8 + 1.25 49.1 + 1.40*
Head circumference (cm) 32.1 + 0.9 34.8 + 0.8*
BW/WP50 0.75 + 0.05 1.02 + 0.08*
AC/HC 0.26 + 0.01 0.29 + 0.01*
Ponderal index (grams/cm3) 2.4 + 0.1 2.7 + 0.2*
BMI (kg/m2) 11.7 + 0.7 13.8 + 0.7*
*p < 0.05
IUGR = intrauterine growth restriction; BW = birth weight; WP50 = weight of 50th percentile; AC = arm circumference; HC = head circumference; BMI = body mass index.
Table 2. Systolic blood pressure evolution in the study groups of newborns
SBP (mmHg)
Group I with IUGR
n = 35
Group II without IUGR
n = 35
1st day 68.7 ± 6.8*
(52.3-84.6)
69.7 ± 5.6* (58.6-78)
3rd day 75.1 ± 7.6
(59.3-90)
75.1 ± 4.9 (67.3-8.6)
7th day 81.0 ±8.0
(68-95)
82.9 ± 4.9 (65.3-89)
30th day 89.3 ± 9.1
(66-100)
91.0 ± 5.9 (73-99.3)
SBP = systolic blood pressure; IUGR = intrauterine growth restriction.
Mean ± standard deviation (minimum-maximum); *p < 0.05 SBP 1st versus 3rd versus 7th versus 30th day in each group.
Table 3.Kidney weight and plasma renin activity in newborns
Renal variable Group I
with IUGR
Group II without IUGR
Kidney weight (grams) 5.9 ±1.6 *
n = 35
9.6 ± 2.1 n = 35
(KW/BW) X 103 2.6 ± 0.7 2.8 ± 0.6
PRA – birth (ng/ml/h) 10.5 ± 6.7†
n = 27
8.3 ± 5.2† n = 27
PRA – 30th day (ng/ml/h) 5.0 ± 3.7
n = 33
4.2 ± 2.8 n = 25
IUGR = intrauterine growth restriction; PRA = plasma renin activity.
*p < 0.001 kidney weight (newborns with IUGR versus newborns without IUGR); †p < 0.05 PRA (birth versus 30th day), in each
Birth weight
9 10 11 12 13
Systolic
blood
pressure
(mmHg)
65 70 75 80 85 90 95
100
BW versus SBP = Birth weight versus Systolic blood pressure IUGR = Intra-uterine growth restriction
Regression Confidence Interval r = 0.387 p = 0.026
Figure 1. Correlation between birth weight and systolic blood pressure on the 7th day
of life (newborn with IUGR).
Kidney weight/birth weight versus 10
0,0010 0,0015 0,0020 0,0025 0,0030 0,0035 0,0040 0,0045
Systolic
b
lood
pressure
(mmHg)
65 70 75 80 85 90 95 100
Kidney weight/birth weight versus103
versus Systolic blood pressure IUGR = Intra-uterine growth restriction
Regression Confidence Interval p = 0.014 r = -0.420
3
Figure 2. Correlation between kidney weight/birthweight versus 103 and systolic blood
pressure correlation on 7th day of life (newborn with IUGR).
enzyme inhibitors.21 In this light, more recent
investigations have explored the possible role of angiotensin receptors (AT1 and AT2) in the origin and maintenance of arterial hy-pertension.22
No differences between PRA levels were observed in either group in this study. Langlay-Evans et al.23 also did not fi nd any differences
in PRA levels in hypertensive animals that had been subjected to protein restriction during the initial and intermediate gestational phases. However, PRA levels were higher when undernutrition was implemented at the end of pregnancy.
In the present study, PRA presented similar evolution in the two groups during the fi rst month, with signifi cant reduction in its levels from birth to the 30th day of life. This result had
already been described in the literature.24-26
Blood pressure levels did not correlate with PRA levels (at birth and on the 30th day),
in either group. These results concord with other authors’ results,27,28 in which no such
correlation was also found.
On the other hand, the absence of correla-tion certainly does not rule out a role for the renin-angiotensin system in maintaining the blood pressure. It is likely that the relatively narrow arterial pressure limits that were ob-served acted in such a way that no correlation could have been demonstrated.
At first glance, the results presented demonstrate that the effect of IUGR on the evolution of systolic arterial pressure and PRA is not manifested during the neonatal period. On the other hand, experimental evidence has demonstrated that hypertensive animals present angiotensin II and PRA levels that differ little from control groups. Thus, it has been shown that future investigations on the physiology of angiotensin-converting enzymes and the expression of the AT1 and AT2 recep-tors would be a promising fi eld in seeking to clarify these relationships.29
More and more evidence is emerging high-lighting the important role of fetal program-ming in the development of adult hypertension. Animal studies and indirect evidence from human studies give support for the notion that low birth weight is associated with congenital defi cits in the numbers of nephrons.30-32 The
total number of nephrons is a biological vari-able that is defi ned before birth, and no new nephrons are formed after birth.29 Brenner et
al.33 gathered impressive evidence in favor of
correla-1. Huxley RR, Shiell AW, Law CM. The role of size at birth and postnatal catch-up growth in determining systolic blood pressure: a systematic review of the literature. J Hypertens. 2000;18(7):815-31.
2. Barker DJP. Mothers, babies and disease in later life. London: BMJ Publishing Group; 1994.
3. Merlet-Benichou C, Gilbert T, Muffat-Joly M, Lelievre-Pegorier M, Leroy B. Intrauterine growth retardation leads to a permanent nephron defi cit in the rat. Pediatr Nephrol. 1994;8(2):175-80.
4. Gilbert T, Lelievre-Pegorier M, Merlet-Benichou C. Long-term effects of mild oligonephronia induced in utero by gentamicin in the rat. Pediatr Res. 1991;30(5):450-6.
5. Hall SM, Zeman FJ. Kidney function of the progeny of rats fed a low protein diet. J Nutr. 1968;95(1):49-54.
6. Zeman FJ. Effects of maternal protein restriction on the kidney of the newborn young of rats. J Nutr. 1968;94(2):111-6. 7. Hinchliffe SA, Lynch MR, Sargent PH, Howard CV, Van
Velzen D. The effect of intrauterine growth retardation on the development of renal nephrons. Br J Obstet Gynaecol. 1992;99(4):296-301.
8. Hughson M, Farris AB 3rd, Douglas-Denton R, Hoy WE, Bertram
JF. Glomerular number and size in autopsy kidneys: the relation-ship to birth weight. Kidney Int. 2003;63(6):2113-22. 9. Luft FC, Rankin LI, Bloch R, et al. Cardiovascular and humoral
responses to extremes of sodium intake in normal black and white men. Circulation. 1979;60(3):697-706.
10. Gilbert T, Levievre-Pegorier M, Merlet-Benichou C. Long-term effects of mild oligonephronia induced in utero by gentamicin in the rat. Pediatr Res. 1991;30(5):450-6.
11. Langley SC, Jackson AA. Increased systolic blood pressure in adult rats induced by fetal exposure to maternal low protein diets. Clin Sci (Lond). 1994;86(2):217-22; discussion 121. 12. Kramer MS, Oliver M, McLean FH, Willis DM, Usher RH.
Im-pact of intrauterine growth retardation and body proportionality
on fetal and neonatal outcome.Pediatrics. 1990;86(5):707-13.
13. Report of the Second Task Force on Blood Pressure Control in Children--1987. Task Force on Blood Pressure Control in Children. National Heart, Lung, and Blood Institute, Bethesda, Maryland. Pediatrics. 1987;79(1):1-25.
14. Hricak H, Lieto RP. Sonographic determination of renal volume. Radiology. 1983;148(1):311-2.
15. Huxley R, Neil A, Collins R. Unravelling the fetal origins hypoth-esis: is there really an inverse association between birthweight and subsequent blood pressure? Lancet. 2002;360(9334):659-65.
16. Matsuoka OT, Pinheiro AC, Pascuas DZ, Leone CR. Evolução dos níveis de pressão arterial sistêmica no período neonatal em recém-nascidos de termo adequados para a idade gestacional. [Evolution of systemic arterial blood pressure during neonatal period in term newborns adequate for gestational age]. J Pediatr (Rio J). 1996;72(3):155-8.
17. Alves JG, Vilarim JN, Figueiroa JN. Fetal infl uences on neonatal blood pressure. J Perinatol. 1999;19(8 Pt 1):593-5. 18. Lee YH, Rosner B, Gould JB, Lowe EW, Kass EH. Familial
aggregation of blood pressures of newborn infants and their mother. Pediatrics. 1976;58(5):722-9.
19. Kitterman JA, Phibbs RH, Tooley WH. Aortic blood pressure in normal newborn infants during the fi rst 12 hours of life. Pediatrics. 1969;44(6):959-68.
20. Guyton AC. Dominant Role of the kidneys in long-term regula-tion of arterial pressure and in hypertension: the integrated system for pressure control. In: Guyton AC, Hall JE, editors. Textbook of medical physiology. Philadelphia: Sanders; 1996. p. 221-36. 21. Langley-Evans SC, Jackson AA. Captopril normalises systolic
blood pressure in rats with hypertension induced by fetal ex-posure to maternal low protein diets. Comp Biochem Physiol A Physiol. 1995;110(3):223-8.
22. Pladys P, Lahaie I, Cambonie G, et al. Role of brain and peripheral angiotensin II in hypertension and altered arterial barorefl ex programmed during fetal life in rat. Pediatr Res. 2004;55(6):1042-9.
23. Langley-Evans SC, Philips GJ, Benediktsson R, et al. Protein intake in pregnancy, placental glucocorticoid metabolism and the programming of hypertension in the rat. Placenta. 1996;17(2-3):169-72.
24. Ljungvist A, Wagermark J. Renal juxtaglomerular granulation in the human foetus and infant. Acta Pathol Microbiol Scand. 1966;67(2):257-66.
25. Kotchen TA, Strickland AL, Rice TW, Walters DR. A study of the renin-angiotensin system in newborn infants. J Pediatr. 1972;80(6):938-46.
26. Richer C, Hornych H, Amiel-Tison C, Relier JP, Giudicelli JF. Plasma renin activity and its postnatal development in preterm infants. Preliminary report. Biol Neonate. 1977;31(5-6):301-4. 27. Van Acker KJ, Scharpe SL, Deprettere AJ, Neels HM. Renin-angiotensin-aldosterone system in the healthy infant and child. Kidney Int. 1979;16(2):196-203.
28. Dillon MJ, Gillin ME, Ryness JM, de Swiet M. Plasma renin activity and aldosterone concentration in the human newborn. Arch Dis Child. 1976;51(7):537-40.
29. Mackenzie HS, Brenner BM. Fewer nephrons at birth: a missing link in the etiology of essential hypertension? Am J Kidney Dis. 1995;26(1):91-8.
30. Zandi-Nejad K, Luyckx VA, Brenner BM. Adult hypertension and kidney disease: the role of fetal programming. Hypertension. 2006;47(3):502-8.
31. Luyckx VA, Brenner BM. Low birth weight, nephron number, and kidney disease. Kidney Int Suppl. 2005;(97):S68-77. 32. Hoy WE, Hughson MD, Bertram JF, Douglas-Denton R,
Amann K. Nephron number, hypertension, renal disease, and renal failure. J Am Soc Nephrol. 2005;16(9):2557-64. 33. Brenner BM, Garcia DL, Anderson S. Glomeruli and blood
pressure. Less of one, more the other? Am J Hypertens. 1988;1 (4 Pt 1):335-47.
34. Goldstein RS, Hook JB, Bond JT. The effects of maternal protein deprivation on renal development and function in neonatal rats. J Nutr. 1979;109(6):949-57.
35. Gilbert T, Lelievre-Pegorier M, Malienou R, Meulemans A, Merlet-Benichou C. Effects of prenatal and postnatal exposure to gentamicin on renal differentiation in the rat. Toxicology. 1987;43(3):301-13. 36. Merlet-Bénichou C, Gilbert T, Muffat-Joly M, Lelièvre-Pégorier
M, Leroy B. Intrauterine growth retardation leads to a permanent
nephron defi cit in the rat. PediatrNephrol. 1994;8(2):175-80.
37. Spencer J, Wang Z, Hoy W. Low birth weight and reduced renal volume in Aboriginal children. Am J Kidney Dis. 2001;37(5):915-20.
38. Hinchliffe SA, Lynch MR, Sargent PH, Howard CV, Van Velzen D. The effect of intrauterine growth retardation on the development of renal nephrons. Br J Obstet Gynaecol. 1992;99(4):296-301.
39. Sato A, Yamaguchi Y, Liou SM, Sato M, Suzuki M. Growth of the fetal kidney assessed by real-time ultrasound. Gynecol Obstet Invest. 1985;20(1):1-5.
40. Lane PH, Belsha CW, Plummer J, Steinhardt GF, Lynch RE, Wood EG. Relationship of renal size, body size, and blood pressure in children. Pediatr Nephrol. 1998;12(1):35-9.
Acknowledgments: We would like to thank Dr. Berenice B.
Mendonça, head of the Hormone Laboratory of the Central Laboratories of Hospital das Clínicas, Faculdade de Medicina da Universidade de São Paulo, for the PRA measurements.
Sources of funding: None
Confl ict of interest: None
Date of fi rst submission: December 23, 2005
Last received: March 5, 2007
Accepted: March 6, 2007
REFERENCES
tion between the fetal growth pattern and the consequent number of nephrons.33
Various models for IUGR have demon-strated decreased nephron counts in rats.5,6,34,35 In
these animal studies, reductions in kidney weight and volume persist throughout life.36 Seemingly,
human pathological studies have found that asymmetric IUGR can exert a profound effect on kidney development. First, low birth weight full-term infants have lower kidney weight and lower glomerular profi le density than do infants with greater birth weight.37 Second, the expected
signifi cant compensatory increase in nephron count is absent postnatally.38
Kidney size has been evaluated by ul-trasound scan within the setting of growth restriction in human fetuses and children by
several authors.39,40 Limitations caused by the
use of ultrasound to assess kidney mass would be avoided by using other, more accurate methods such as magnetic resonance imaging, although this would be impractical.
Systolic blood pressure presented an inverse correlation with the kidney weight/birth weight ratio on the seventh day of life, among newborns with IUGR in the present study. This result may demonstrate that the effect of nutritional restriction on blood pressure during the neo-natal period is manifested through kidney size. However, this association was not strong and did not persist to the 30th day of life. No correlation
between systolic blood pressure and the kidney weight/birth weight ratio was observed in the newborn group without IUGR.
CONCLUSIONS
AUTHOR INFORMATION
Oscar Tadashi Matsuoka, MD. Attending physician, Nursery
An-nex of the Maternity Hospital, Instituto da Criança, Hospital das Clínicas, Faculdade de Medicina da Universidade de São Paulo (HCFMUSP), São Paulo, Brazil.
Simone Shibao, MD. Attending physician, Radiology Institute,
Hospital das Clínicas, Faculdade de Medicina da Universi-dade de São Paulo (HCFMUSP), São Paulo, Brazil.
Cléa Rodrigues Leone, MD, PhD. Associate professor,
Department of Pediatrics; Head of the Nursery Annex of the Maternity Hospital, Instituto da Criança, Hospital das Clínicas, Faculdade de Medicina da Universidade de São Paulo (HCFMUSP), São Paulo, Brazil.
Address for correspondence: Oscar Tadashi Matsuoka
Rua Ministro Godoy, 553 — Apto. 124 — Perdizes São Paulo (SP) — Brasil — CEP 05015-000 Tel. (+55 11) 3862-1492
E-mail: [email protected]
Copyright © 2007, Associação Paulista de Medicina
RESUMO Pressão arterial e tamanho renal em recém-nascidos no termo com restrição de crescimento intra-uterino CONTEXTO E OBJETIVO: O baixo peso ao nascimento está associado à pressão arterial mais elevada na criança e no adulto. O objetivo foi avaliar a infl uência do retardo do crescimento intra-uterino (RCIU) na pressão arterial sistólica de recém-nascidos (PAS).
TIPO DE ESTUDO E LOCAL: Estudo prospectivo, realizado no berçário anexo à maternidade, Instituto da Criança, Hospital das Clínicas da Universidade de São Paulo.
MÉTODOS: 35 recém-nascidos (RN) com RCIU e 35 RN sem RCIU foram avaliados em um estudo prospectivo. Os critérios de inclusão foram: recém-nascidos no termo, saudáveis, sem malformações e índice de Apgar de quinto minuto > 6. Parâmetros antropométricos (peso ao nascimento, relação compri-mento renal/peso ao nascicompri-mento), dimensões renais (pela ultra-sonografi a), dosagem da atividade da renina plasmática (ARP) e a evolução da PAS foram analisadas durante o primeiro mês de vida (no 1o,
3o, 7o e 30o dias de vida).
RESULTADOS: A evolução da PAS, relação peso renal/peso ao nascimento e ARP não apresentaram diferença entre os dois grupos. Em recém-nascidos com CIUR, a correlação entre PAS e PN (r = 0,387 p = 0,026) e IMC (r = 0,412 p = 0,017) foi positiva no 7o dia de vida. No 30o dia de vida, a correlação
com PN (r = 0,440 p = 0,01) e comprimento ao nascimento (r = 0,386 p = 0,026) também foi positiva. Houve correlação negativa entre a PAS do 7o dia e a relação peso do rim/peso ao nascimento (r = - 0,420
p = 0,014), porém, esta correlação não persistiu ao longo do primeiro mês de vida.
CONCLUSÕES: RCIU parece não infl uenciar a PAS, a atividade de renina plasmática ou o peso renal em recém-nascidos no termo durante o primeiro mês de vida.