www.jped.com.br
ORIGINAL
ARTICLE
Fecal
calprotectin
levels
in
preterm
infants
with
and
without
feeding
intolerance
夽
Rehab
Moussa
a,
Abdelmoneim
Khashana
a,b,∗,
Noha
Kamel
c,
Sonia
Elsharqawy
Elsharqawy
aaSuezCanalUniversity,FacultyofMedicine,DepartmentofPediatrics,Ismailia,Egypt
bUniversityofOulu,MedicalResearchCenter(MRC),ResearchUnitofPediatrics,PediatricNeurology,PediatricSurgery,
ChildPsychiatry,Dermatology,ClinicalGenetics,ObstetricsandGynecology,Otorhinolaryngology,Ophtalmology(PEDEGO), Oulu,Finland
cSuezCanalUniversity,FacultyofMedicine,DepartmentofClinicalPathology,Ismailia,Egypt
Received12September2015;accepted25November2015 Availableonline16June2016
KEYWORDS
Fecalcalprotectin; Feedingintolerance; Preterminfants
Abstract
Objectives: Toassesstheleveloffecalcalprotectininpretermneonateswithfeeding
intoler-ance,aswellastoevaluateitasamarkeroffeedingintoleranceandtodetermineacut-off leveloffecalcalprotectininfeedingintolerance.
Methods: Analytical,multicenter,case---controlstudy,whichwascarriedoutinneonatal
inten-sive careunits inEgypt, ina period fromAugust 1, 2014 toMarch 1, 2015on 52 preterm neonates.Neonateswereclassifiedintotwogroups;astudygroupincluding26neonateswho metinclusioncriteriaandacontrolgroupincluding26neonatesforcomparison.
Results: Fecalcalprotectinlevelsrangedfrom3.9g/gto971.8g/g,andtherewasa
signif-icantincreaseinfecalcalprotectin inthestudygroupwhen comparedtothecontrolgroup (334.3±236.6g/gvs.42.0±38.2g/g,respectively)withmoderateinversesignificant cor-relation between fecal calprotectin and birth weight. Furthermore, there was moderate, significantcorrelationbetweenfecalcalprotectinanddurationofbreastfeedingrange.Onthe otherhand,therewasnocorrelationbetweenfecalcalprotectinandpost-natalage,gestational age,orvolumeoffeeding.Acut-offatthe67.0g/glevel,with100.0%sensitivityand76.9% specificity,wasconsidered.
Conclusion: Fecalcalprotectinlevelincreasedsignificantlyinneonateswithfeeding
intoler-ance;itcanbeusedtodetectearlycaseswithnecrotizingenterocolitisinneonates,butthis subjectstillneedsmoreinvestigationsonmorepatients.
©2016SociedadeBrasileiradePediatria.PublishedbyElsevierEditoraLtda.Thisisanopen accessarticleundertheCCBY-NC-NDlicense(http://creativecommons.org/licenses/by-nc-nd/ 4.0/).
夽
Pleasecitethisarticleas:MoussaR,KhashanaA,KamelN,ElsharqawySE.Fecalcalprotectinlevelsinpreterminfantswithandwithout feedingintolerance.JPediatr(RioJ).2016;92:486---92.
∗Correspondingauthor.
E-mail:[email protected](A.Khashana).
http://dx.doi.org/10.1016/j.jped.2015.11.007
PALAVRAS-CHAVE
Calprotectinafecal; Intolerância alimentar;
Neonatosprematuros
Níveisdecalprotectinafecalemneonatosprematuroscomesemintolerância
alimentar
Resumo
Objetivos: Avaliaronível de calprotectinafecal em neonatos prematuros comintolerância
alimentar, alémdeavaliá-locomo umindicador deintolerância alimentaredeterminarum níveldecortedacalprotectinafecalnaintolerânciaalimentar.
Métodos: Estudocaso-controleanalítico,realizadoemummulticentrodeunidadesdeterapia
intensivaneonataisnoEgito,noperíodode1◦deagostode2014a1◦ demarc¸ode2015,com 52neonatosprematuros.Osneonatosforamclassificadosemdoisgrupos;umgrupodeestudo incluindo26neonatosqueatenderamaoscritériosdeinclusãoeumgrupodecontroleincluindo 26neonatosparacomparac¸ão.
Resultados: Osníveis decalprotectina fecalvariaram de3,9g/ga971,8g/g ehouveum
aumentosignificativodacalprotectinafecalnogrupodeestudoquandocomparadoaogrupo de controle (334,3±236,6g/g em comparac¸ão a 42,0±38,2g/g, respectivamente) com correlac¸ãoinversa,moderadasignificativaentreacalprotectinafecaleopesoaonascer. Adi-cionalmente,houvecorrelac¸ãomoderadasignificativaentreacalprotectinafecaleadurac¸ão dointervalodeamamentac¸ão.Poroutrolado,nãohouvecorrelac¸ãoentreacalprotectinafecal eaidadepós-natal, aidade gestacionalouovolumedeamamentac¸ão.Foi consideradoum cortenosníveisde67,0g/g;comsensibilidadede100,0%eespecificidadede76,9%.
Conclusão: O nível de calprotectina fecal aumentou significativamente em neonatos com
intolerância alimentar e podemos utilizá-lo para detectar casos precoces comenterocolite necrosanteemneonatos,porémaindasãonecessáriasmaisinvestigac¸õesemmaispacientes.’ ©2016SociedadeBrasileiradePediatria.PublicadoporElsevierEditoraLtda.Este ´eumartigo OpenAccesssobumalicenc¸aCCBY-NC-ND(http://creativecommons.org/licenses/by-nc-nd/4. 0/).
Introduction
Feedingofpretermneonatesisoneofthemainchallenges facedbyneonatalpractitioners,especiallythoseinthelow birthweightgroups.1 Pretermneonateshave greater mor-talityandmorbiditywithlong-termdisorders.2
Feeding intolerance is knownas a difficulty in feeding milk, causing a change in the usual enteral feeding due to the appearance of one or more of the following gas-trointestinalclinicalsymptoms:gastricresiduals,vomiting, abdominaldistention, distended bowelloops, and change incharacterofstool.Apnea,bradycardia,andtemperature instabilityarealsoincludedassymptomsoffeeding intoler-ance,butonlyforthereasonofnursingjudgment,inorder togiveguidanceondetectionofprogressiontomoreserious complicationssuchasnecrotizingenterocolitis(NEC).3
Many risk factors may aggravate feeding intolerance, includingpoorcoordinationofsuckingandswallowing,weak loweresophagealsphincter,smallstomachcapacity,delayed stomachemptyingtime,andintestinalhypomotility4;onthe otherhand,humanmilkisthebestforneonatesand forti-fiersderivedfromhumanmilkactasagoodsubstratumfor preterminfantfeeding.5
Abnormalbacterialcolonizationmaybeafactorin feed-ing intolerancein neonates, mainlydue todysfunctionof theintestinalbarrier,theimmuneresponses,andfunctions oftheintestine.Abnormalintestinalcolonization,poor bal-ancebetweenmicrobiota,immuneresponse,andtolerance mechanismsmayresultinfeedingintoleranceinpostnatal lifeandalsoingastrointestinaldiseaseinchildhood.6
In1970,Fagerholetal.searchedforamarkerof leuko-cyteturnover, and in 1980 theypublished their discovery of a protein in the cytoplasm of neutrophils, which they termedleukocyte-derivedL1protein,orcalprotectin.7 Cal-protectinis a member of the S100family of calciumand zincbindingproteins;itistheheterodimerofS100A8/A9. Itisfound inneutrophils,monocytes,andsome squamous epithelium cells. The complex accounts for up to 60% of thesolubleproteincontentoftheneutrophilcytoplasm.It isreleasedbyactivationof leucocytesasconsequencesof inflammatorydiseases.8S100A8isalsocalledcalgranulinA andmyeloid-relatedprotein8(MRP8),andS100A9iscalled calgranulinB(MRP14).Theyboth arelinkedtotheinnate immunesystem.9
Calprotectinhas bacteriostaticand fungistaticactions, asitcanisolatemanganeseandzincintheircells10;italso hasseveralbiologicalpropertiesincludingantimicrobicand imunomodulatoryactivity,anditisreleasedduringcell acti-vation(activerelease)orcelldeath(passiverelease).11 It hasbeen suggestedasausefulindicatortodeterminethe severityofinflammationintheintestine.12Themost signifi-cantfactorsthataffect fecalcalprotectin (FCP)excretion include ante- and perinatal antibiotic treatment, volume ofenteralfeeding,theoccurrence ofunplanned interrup-tionsofenteralfeeding,andthegastrointestinalbacterial colonization.13
The present study aimed toassess the level of FCPin preterm neonates withfeeding intolerance, aswell as to confirmitasamarkeroffeedingintoleranceandto deter-mineacut-offlevelofFCPthatisspecificandsensitiveto feedingintolerance.
Methods
Studydesign
Analyticalcase---controlstudy
Thestudypopulationwasclassifiedintotwogroups:Group1 (casegroup)includedpreterminfantsthatfulfilledinclusion criteriaandshowedanysignoffeedingintolerance.Group 2(control group)included postnatal age-,gestation-,and sex-matchedcontrolpretermbabieswhodidnotshowsigns offeedingintolerance.
Inclusioncriteria:Preterminfantsofbothgendersfrom birthuntilthe28thdayoflifeandwith28tolessthan37 weeksofgestation,admittedtotheneonatalintensivecare unit(NICU),whoshowedanyofthesignsoffeeding intoler-anceleadingtointerruptionofthecurrentfeedingregime, suchas:increasedgastric residuals(>50%)of theprevious feeding,emesis,abdominaldistention(increasein abdomi-nalgirthby2cmormorebetweenfeedings),bloodystool, diarrhea,andvisiblebowelloops.3
Exclusion criteria: Neonates suffering from intestinal congenitalanomaliesorneonateswithsepsis.3
Sample size:Thefollowing equationusedtodetermine therequiredsamplesize:
N=2(Z␣+Z)2×P−Q−/(P1−P2)2
where:N=number; Z␣=thevalueof standardnormal dis-tributionfortypeIerrorprobabilityforonesidedtestand equal1.96for95%significance;Z=thevalue ofstandard normaldistributionforthedesiredstatisticalpowerof90% andequal1.28for90%power;P−=(P1+P2)/2;Q−=1−P−; P1=56%, is the estimated proportionof an attribute that is present in the population1; P2=prevalence of neonates expectedtohavelowFCPlevelequals5%.
Accordingtothecalculation thesample sizetotaled52 neonates:26neonatesfromeachgroupwhowereadmitted totheNICUintheperiodbetweenthe1stofAugust,2014 untilthe1stofMarch,2015.
Allthestudiedneonatesweresubjectedtohistory tak-ing,fullclinicalexamination,andinvestigations:C-reactive protein,completehemogram,andFCP.
FCPwasmeasuredinstoolusingtheRidascreen quantita-tiveenzymelinkedimmunoassay(BiopharmAG,Darmstadt, Germany)
Statisticalanalysis
Thecollected datawereorganized,tabulated, and statis-ticallyanalyzedusingSPSSversion16(SPSS,Inc.,Chicago, USA),running onan IBM(InternationalBusiness Machines, New York, USA) compatible computer. Qualitative data (categorical) were represented as relative frequency and percentdistribution,andfor comparisonbetween groups,
chi-squared(X)wasusedasatestofcomparison. Quantita-tivedatawererepresentedasmeanandstandarddeviation (SD).Forcomparisonbetweengroups, Student’st-testfor independent samples was used for normally distributed data;theMann---Whitney(U)testwasusedfornon-normally distributeddata.Forcorrelation,thePearson’scorrelation coefficient(r)wasused;correlationwasproportionalifthe sign was positive; inverse if the sign was negative; mild if <0.3; moderate if 0.3---0.7; and powerful if >0.7; com-plete correlation if r=1.0;and nocorrelation whatsoever ifr=0.0.Forinterpretationofresults,p-values<0.05were consideredsignificant.
Ethicalconsideration
Ethicalapprovalofthestudywasobtainedfromtheresearch ethics committee of the faculty of medicine of the Suez CanalUniversityinandawritteninformedparentalconsent alsowasobtained.
Results
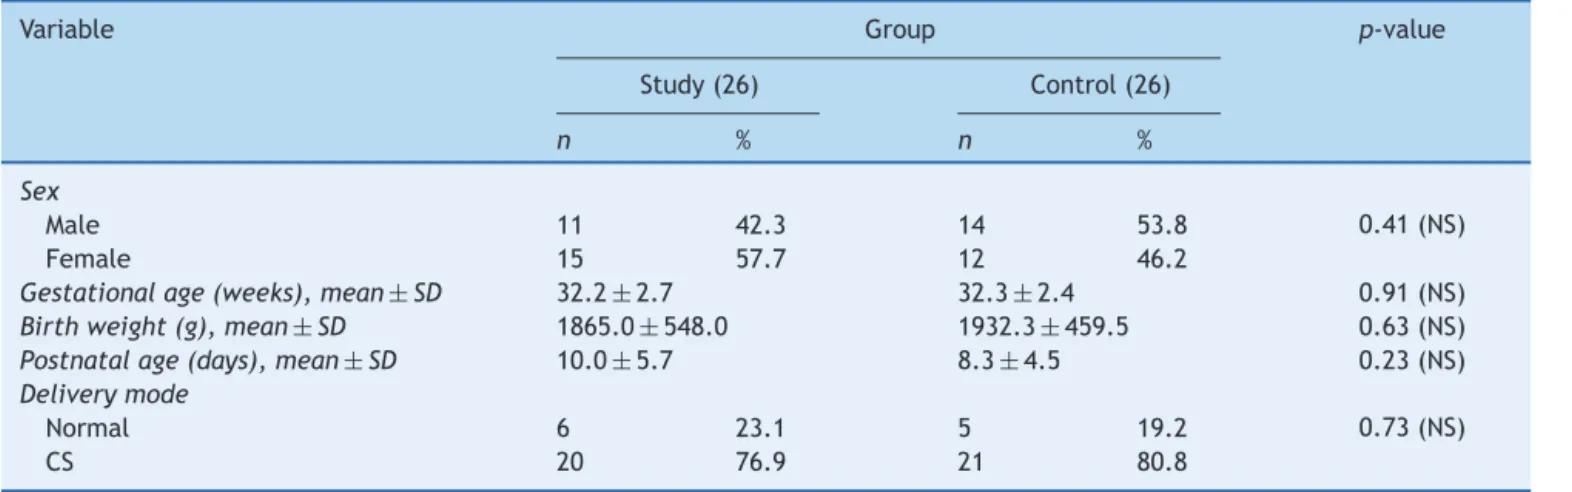
Regardingdemographiccharacteristics(Table1)
It was found that there was no significant difference betweenthestudygroupandcontrolsregardingsex distri-bution.Theneonatesincludedrangedfrom28to36weeks gestationandtherewasnosignificantdifferencebetween bothgroups withregardstogestationalage(32.2±2.7vs.
32.3±2.4weeks,respectively). Theirbirth weightranged from 900g to 2750g and there was no significant differ-enceof birth weightbetween both groups. Regarding the modeofdelivery; 11cases(21.2%)weredeliveredby nor-malvaginaldeliveryand41cases(78.8%)weredeliveredby cesarean delivery; therewasno significant differencefor normalvaginaldeliveryinthisstudywhencomparedtothe controlgroup.Post-natalagerangedfrom3rdto25thdays, withanon-significantincreaseofpost-nataldaysinthestudy groupwhencomparedtothecontrolgroup.
The main illness in the study and control groups was respiratorydistressin37cases(71.2%);respiratorydistress syndrome(RDS)intencases(19.2%);transienttachypneaof newborn inthreecases (5.8%);RDSplus hypoxic ischemic encephalopathy in one case (1.9%); and persistent pul-monaryhypertensionofnewborn(PPHN)inonecase(1.9%); therewerenosignificantdifferencesbetweengroups.
As to type of feeding; it wasexclusive artificial feed-ing in 41 cases (78.8%); exclusive breast feeding in one case (1.9%) and mixed (artificial with breast feeding) in ten cases (19.2%),with nosignificant difference between groups.Feedinginthestudygroup(volume/3h)rangedfrom 1mLto30mLwithameanof18.4±7.8mL;andtherewas anon-significantdecreaseoffeedingvolumeinbothgroups (Table2).
Table1 Demographiccharacteristicsinstudyandcontrolgroups.
Variable Group p-value
Study(26) Control(26)
n % n %
Sex
Male 11 42.3 14 53.8 0.41(NS)
Female 15 57.7 12 46.2
Gestationalage(weeks),mean±SD 32.2±2.7 32.3±2.4 0.91(NS)
Birthweight(g),mean±SD 1865.0±548.0 1932.3±459.5 0.63(NS)
Postnatalage(days),mean±SD 10.0±5.7 8.3±4.5 0.23(NS)
Deliverymode
Normal 6 23.1 5 19.2 0.73(NS)
CS 20 76.9 21 80.8
CS,cesareansection;NS,non-specific.
Table2 Typeoffeedinginstudyandcontrolgroups.
Variable Group p-value
Study Control
n % n %
Feeding
Artificial 20 76.9 21 80.8 0.49(NS)
Breastfeeding 1 3.8 0 0.0
Artificial+BF 5 19.2 5 19.2
Volumeoffeeding,mean±SD 17.0±8.5 19.7±7.0 0.23(NS)
BF,breastfeeding;NS,non-specific.
inonecase(3.8%).Altogetherfivecases(9.6%)withStage IAreportedtohaveNECinthestudygroup.
FCPlevelsrangedfrom3.9g/gto971.8g/g,witha
sig-nificantincreaseofFCPinthestudygroupwhencomparedto thecontrolgroup(334.3±236.6g/gvs.42.0±38.2g/g,
respectively),andwithmoderateinversesignificant corre-lationbetween FCPand birth weight.Furthermore,there wasmoderate,significantcorrelationbetweenFCPandstop feedingduration.Conversely,therewasno-significant cor-relationbetweenFCPandpost-natalage,GA,orvolumeof feeding(Table3).
Analysis of ROCcurve showedthat the areaunder the curvewas0.97(thisreflectedhighersensitivity);forthebest cut-off,valueswiththebestsensitivitywerechosen;atthe levelof67.0g/g,thesensitivitywas100.0%andspecificity was76.9%(Table4).
Discussion
Feedingintoleranceisverycommonamongpreterminfants onenteralfeeds,andmayeitherbeabenignsignofreduced GImotilityor maybean initialmanifestationof necrotiz-ingenterocolitis(NEC).It isone ofmost commonreasons todelayadvancementofenteralfeedsorforsuspensionof feedsinpreterminfants.19FCPhasbeensuggestedtobea usefulmarkerofgastrointestinalinflammationinneonates, and has also been raised in cases of inflammatory bowel disease.20
The present patients’ gestational age ranged from 28 to36 weeks, with mean of 32.3±2.6 weeks, mean birth weightof1898.7±501.9g,andmeanpostnatalageattime ofdiagnosisof10.0±5.7days.Itwasfoundthat11ofthe studygroupweremalesand15werefemales.Inthestudy
Table3 Fecalcalprotectininstudyandcontrolgroups.
Group Median Mean SD Minimum Maximum U p-value
Study 273.85 334.33 236.61 67.30 971.80 20.0 <0.001a
Control 23.95 42.03 38.23 3.90 126.10
a RegardingFCPlevels,becausethedatawerenon-normallydistributed,themedianwastheappropriatemeasureandMann---Whitney
Table4 SensitivityofFCPindiagnosisoffeedingintolerance.
Positiveifgreaterthanorequalto Sensitivity Specificity 1−Specificity
59.70 1.000 0.731 0.269
67.05 1.000 0.769 0.231
72.15 0.962 0.769 0.231
79.65 0.962 0.808 0.192
Areaunderthecurve 0.97
95%CI 0.00---1.00
FCP,fecalcalprotectin.
byZoppellietal.,21 theyfoundthatthe meangestational age (GA)was28.5 weeks and birth weightwas1057g.In the study by Albanna et al.,16 they found a mean GA of 32weeks,ameanbirthweightof1500g,andameanage atdiagnosis of 9 days;ninewereboys andsix weregirls. Cui andLi14 hada mean GA of 30 weeks,withmean age atdiagnosis of12 days.Inthestudy byCarroll,22 samples wereobtained(oneat birthandtheother onthe3rdday afterbirth)from38preterminfants withGAranging from 29to33 weeks.Aydemiretal.17 foundmeanbirth weight of950g,andameanageof14daysatdiagnosis.
Altogether,41neonateswereexclusivelyfedartificially, tenhadmixedfeeding,andonlyonecase wasexclusively breastfed,unlikethestudybyYoon,15 inwhichnoinfants wereexclusivelybreastfed.
The present study found no significant correlation between FCPlevel and volumeof enteral feeding, which agreeswithCampeottoetal.23anddiffersfromthestudyby Yangetal.,24inwhichFCPlevelsdecreasedwithincreasing enteralfeedingvolumeduringthefirstmonthofpostnatal life,andfromJosefesson etal.25 andRougéetal.,13 who foundthatFCPincreasedwithincreasingfeedingvolume.
Previousstudieshaveresearchedtheeffectofthetype offeedingonthelevelofFCP:Campeottoetal.23andYang etal.24 foundthatthereisnodifferenceintheFCPlevels ofinfantsfedmaternalbreastmilkvs.hydrolyzedformula. Yoon et al.15 found that there was no effect of type or methodoffeedingonFCP,whileLietal.26 foundthatFCP levelwashigherin breastfedinfants than informulafed infants.Inthepresentstudyitwasnotpossibletoexamine therelationshipbetweenexclusivelybreastfedand exclu-sivelyformulafedinfants,astherewasonlyoneexclusively breastfedinfant.
Thisstudyfoundnoeffectofgenderorgestationalageon levelofFCP,whichisinagreementwithCampeotoetal.,23 andalsomatcheswithYangetal.24 andKapeletal.,18 but isin disagreementwithRougé etal.,13 whofound aweak negativelinear relationship between FCPand gestational age.Yoonetal.15 foundaclearpositivelinearrelationship betweentwothevariables(gestationalageandlevelofFCP) innewbornsbornat<26weeksGAandadistinctivenegative linearrelationshipbetweentheminnewbornsbornafteror atweek26to<30weeks.
TherewasasignificantinversecorrelationbetweenFCP levelandbirthweight,inagreementwithLaforgiaetal.27 andindisagreementwithCampeottoetal.,23whofoundno significantrelationbetweenbirthweightandFCP.
In the present study there was a significant posi-tivecorrelationbetweenprematureruptureofmembranes
(PROM) andlevel of FCP. This was in agreementwith Cui andLi.14
Itwasfoundthatpostnatalagehasnosignificant correla-tionwithFCPlevel;thiswasinagreementwithCampeotto et al.23 and in disagreement withJosefesson et al.25 and Rougé et al.,13 whoobserved a positive relationship, and Yang et al.,24 who found a negative relationship, as FCP levelstendedtodecreasewithincreasingage.
Therewasnocorrelationbetweenmodeofdeliveryand FCPlevel.ThiswasinagreementwithLaforgiaetal.27 and Rougéetal.,13andindisagreementwithJosefessonetal.,25 who observedpositive relationship withcaesarian section (CS)delivery,andCuiandLi,14whoobservednegative rela-tionshipwithCSdelivery.
Inthepresentstudygroup,fourpreterminfantsdied dur-ing the time of study.Twenty-six preterm were found to have signsoffeedingintolerance;fiveofthem (9.6%)had suspectedNEC(bell’sstageIA);allofthemhaverecovered completelyexceptforonecase whodiedduringthestudy. In the study by Zoppelli et al.,21 9.2% of patients devel-opedNECstageII,ofwhomfivehadfulminantNEC.Aydemir etal.17observedthreepatientswithmildNEC(Bell’sstage IB),fourwithdefiniteNEC(Bell’sstageIIB),andthreewith clinicalsignsconsistentwithadvancedNEC(Bell’sstageIIIA orIIIB).
The FCPlevel inthe present study rangedfrom 3.9to 971.8mg/kg,withameanof188.2±223.5.FCPwas signif-icantlydifferentbetweengroups,withhigherFCPlevelsin thecase group,whichwasin agreementwithCuietal.,14 whostatedthattherewasincreasedFCPlevelinthegroup withfeedingintolerance;this wasalsoinagreementwith Rougé etal.,13 whostated thatFCP increasedin preterm with poor tolerance to enteralfeeding. Also, this finding matched withYangetal.,24 whofound thatthe FCPlevel in preterminfants rose aroundthetimeof initialsigns of GI illness and decreased asthese signs were treated and resolved,andthatFCPwasgreater amongthosewithNEC symptoms.
valueof 363g/gwithasensitivity0.65andspecificityof 0.82wasset forthe developmentof mild digestive symp-toms,andacut-offof636g/gwithasensitivity0.72and specificity 0.95for the developmentof severe symptoms. Shenoyetal.28 showedthattherewasasignificant associ-ationbetweenhigh FCPandNEC.FCPhada cut-offvalue ≥280g/g,andasensitivityof93.3%andspecificityof39%. The present studydemonstrated that therewasa cor-relationbetweenhigherFCPlevelsandNECoccurrencein thecasegroup;thisisinagreementwithAlbannaetal.,16 whofound significantlyhigherFCPlevelsinneonates who developedNEC,withmaximumlevelinneonateswithBell’s stageIIIb(307.6±4.1),which wasalsoinagreementwith Aydemir et al.,17 who found that raised FCP can predict theoccurrenceofNEC,asmeanFCPconcentrationsinNEC cases (185mg/dL) were significantly higher than controls (104mg/dL). Also,theyfound thattherewasasignificant positive correlation between NEC severity and FCPlevel. Yoonetal.15 alsofoundthatFCPconcentrationwashigher innewbornswithNECthancontrols.ElFragyetal.29showed that FCP can be usedas a non-invasive marker for early predictionofNECinneonates.
InastudybyThuijlsetal.thatinvolved35neonates sus-pectedofNEC,14ofthemdevelopedNEC.MedianofFCP levelstogetherwithurinaryintestinalfattyacidbinding pro-teinandclaudin-3weresignificantlyhigherinneonateswith NECthaninneonates withother diagnoses,withacut-off levelofFCP(286.2g/gfeces).30Carrolletal.showedthat FCPwasmarkedlyelevated---withameanconcentrationof 288.4mg/L---inpatientswithNEC,comparedto98.0mg/Lin controls.22FCPwasincreasedto>2000
g/ginthreecasesof NECandinonecaseofcoveredperforationwithmicroscopic bowelinflammation.25
Allofthe52studiedneonateswereundertreatmentwith antibiotics, sowe were notable toidentify theeffectof postnatalantibioticsonFCPlevel.Fecalsampleswerenot alwayseasilyobtainableininfantswhohadfeeding intoler-ance,astheyhaddelayedgastricemptying,andalsoduring stopfeedingdurationitwasdifficulttotakeastoolsample. Itwasconcludedthatpretermwithfeedingintolerance hadstatisticallysignificantelevatedlevelsofFCPcompared topreterminfantswithoutfeedingintolerance.
Conflicts
of
interest
Theauthorsdeclarenoconflictsofinterest.
References
1.IgnacioL, Alfaleh K. Feeding intolerance inpreterm infants fedwithpowderedorliquidformula:arandomizedcontrolled, double-blindpilotstudy.JClinNeonatol.2013;2:11---3. 2.MachadoJúniorLC,PassiniJúniorR,RodriguesMachadoRosa
I.Late prematurity: a systematic review. J Pediatr (Rio J). 2014;90:221---31.
3.MooreTA,WilsonME.Feedingintolerance:aconceptanalysis. AdvNeonatalCare.2011;11:149---54.
4.Mansi Y, Abdelaziz N, Ezzeldin Z, Ibrahim R. Randomized controlledtrialofahighdoseoforalerythromycinforthe treat-mentoffeeding intoleranceinpreterm infants.Neonatology. 2011;100:290---4.
5.ThomazDM,SerafinPO,PalharesDB, TavaresLV,GranceTR. Serumphenylalanineinpretermnewbornsfeddifferentdiets ofhumanmilk.JPediatr(RioJ).2014;90:518---22.
6.IndrioF,RiezzoG,CavalloL,DiMauroA,FrancavillaR. Phys-iological basis of food intolerance in VLBW. J Matern Fetal NeonatalMed.2011;24:64---6.
7.Fagerhol MK,DaleI,Andersson T. Aradioimmunoassay for a granulocyteproteinasamarkerinstudiesontheturnoverof suchcells.BullEurPhysiopatholRespir.1980;16:273---82. 8.Marshall WJ, Lapsley M, Day A, Ayling RM, editors.Clinical
biochemistry:metabolicandclinicalaspects.3rded.London: ElsevierHealthSciences;2014.
9.Foell D, Wittkowski H, Roth J. Monitoring disease activity by stool analyses: from occult blood to molecular mark-ers of intestinal inflammation and damage. Gut. 2009;58: 859---68.
10.BrophyMB,NolanEM.Manganeseandmicrobialpathogenesis: sequestrationbytheMammalianimmunesystemandutilization bymicroorganisms.ACSChemBiol.2015;10:641---51.
11.LambCA,MansfieldJC.Measurementoffaecalcalprotectinand lactoferrinininflammatoryboweldisease.Frontline Gastroen-terol.2011;2:13---8.
12.BurriE,BeglingerC.Faecalcalprotectin---ausefultoolinthe managementofinflammatoryboweldisease.SwissMedWkly. 2012;142:w13557.
13.RougéC,ButelMJ,PiloquetH,FerrarisL,LegrandA,Vodovar M,etal.Fecalcalprotectinexcretioninpreterminfantsduring theneonatalperiod.PLoSONE.2010;5:e11083.
14.CuiX,LiJ.Fecalcalprotectinlevelsinpreterminfantsduring theearly neonatalperiod.Zhongguo DangDai ErKe ZaZhi. 2012;14:165---8.
15.YoonJM,ParkJY,KoKO,LimJW,CheonEJ,KimHJ.Fecal cal-protectinconcentrationinneonatalnecrotizingenterocolitis. KoreanJPediatr.2014;57:351---6.
16.AlbannaEA,AhmedHS,AwadHA.Stoolcalprotectinin necro-tizingenterocolitis.JClinNeonatol.2014;3:16---9.
17.AydemirG,CekmezF,TanjuIA,CanpolatFE,GencFA,Yildirim S,etal.Increased fecalcalprotectininpreterminfantswith necrotizingenterocolitis.ClinLab.2012;58:841---4.
18.KapelN,CampeottoF,KalachN,BaldassareM,ButelMJ,Dupont C.Faecalcalprotectinintermandpretermneonates.JPediatr GastroenterolNutr.2010;51:542---7.
19.RamaniM,AmbalavananN.Feedingpracticesandnecrotizing enterocolitis.ClinPerinatol.2013;40:1---10.
20.Ashorn S, Honkanen T, Kolho KL, Ashorn M, Välineva T, Wei B, et al. Fecal calprotectin levels and serologicalresponses to microbial antigens among children and adolescents with inflammatory bowel disease. Inflamm Bowel Dis. 2009;15: 199---205.
21.ZoppelliL,GüttelC,BittrichHJ,AndréeC,WirthS,JenkeA. Fecalcalprotectinconcentrationsinprematureinfantshavea lowerlimitandshowpostnatalandgestationalagedependence. Neonatology.2012;102:68---74.
22.CarrollD,CorfieldA,SpicerR,CairnsP.Faecalcalprotectin con-centrationsanddiagnosisofnecrotisingenterocolitis.Lancet. 2003;361:310---1.
23.CampeottoF,KalachN,LapillonneA,ButelMJ,DupontC,Kapel N.Timecourseoffaecalcalprotectininpretermnewborns dur-ingthefirstmonthoflife.ActaPaediatr.2007;96:1531---3. 24.YangQ,SmithPB,GoldbergRN,CottenCM.Dynamicchangeof
fecalcalprotectininverylowbirthweightinfantsduringthe firstmonthoflife.Neonatology.2008;94:267---71.
25.Josefsson S, Bunn SK, Domellöf M. Fecal calprotectin in very low birth weight infants. J Pediatr Gastroenterol Nutr. 2007;44:407---13.
27.LaforgiaN,BaldassarreME,PontrelliG,IndrioF,AltomareMA,Di BitontoG,etal.Calprotectinlevelsinmeconium.ActaPaediatr. 2003;92:463---6.
28.ShenoyMT, ShenoyKT, RosethA,Geir L, KeshavamurthySR. Diagnosticutility offecalcalprotectinas abiomarkerofgut inflammationinneonatestopredictnecrotizingenterocolitis: aprospectivestudy.IndianJChildHealth.2014;1:99---104.
29.ElFragyM,HassanAM.Theeffects ofprobiotics supplemen-tation on fecalcalprotectin as anearly marker of neonatal enteropathy.JAmSci.2014;10:209---13.