Two-dimensional analysis of gait asymmetry in spastic
hemiplegia
Análise bidimensional da assimetria da marcha na hemiplegia espástica
Marise Bueno Zonta1, Amancio Ramalho Júnior2, Regina Maria Ribeiro Camargo3, Fabiano Hessel Dias4, Lúcia
Helena Coutinho dos Santos5
ABSTRACT
Objective: Simple measures of gait for routine clinical use could be useful when the complex gait analysis systems are not available. The aim of this study was to quantify asymmetry in children with spastic hemiplegia using a two-dimensional gait analysis by videography and to relate the asymmetry to motor function. Methods: Twenty-four children with spastic hemiplegia (19 males, 5 females; mean age 49 months [SD 5 months], range from 39 to 60 months) were assessed with a two-dimensional gait analysis by videography and the analyzed parameters were compared with normal values and with clinical and functional data. Results: There were significant differences in swing time (p = 0.002), stance time (p = 0.01) and stance/swing time ratio (p < 0.001). The comparison with the normal values described by Sutherland also demonstrated gait asymmetry. There was no direct relationship between the motor function and asymmetry but a score analysis for specific Gross Motor Function Measure items could quantify it in terms of age of gait acquisition. Children with more adequate muscle tone presented longer stance time in the involved limb than those with more spasticity (p = 0.03). Conclusions: These results suggest that the best performance is associated with the smallest asymmetry in this sample. Although two-dimensional gait analysis does not provide as much data as three dimensional gait analyses, we believe it can contribute significantly to the gait assessment of children with cerebral palsy.
Keywords: Gait; Cerebral palsy; Hemiplegia; Child
RESUMO
Objetivo: Medidas simples para mensuração da marcha na rotina clínica podem ser úteis quando os sistemas complexos para a análise da marcha não estão disponíveis. O objetivo deste estudo
foi quantificar a assimetria na marcha de crianças com hemiplegia espástica por meio de uma análise bidimensional por videografia e relacionar a assimetria à função motora. Métodos: Vinte e quatro crianças com paralisia cerebral do tipo hemiplégica espástica (19 do sexo masculino, 5 feminino; média de idade de 49 meses [± 5 meses], variando de 39 a 60 m) foram avaliadas por meio da análise bidimensional por videografia, e os parâmetros analisados foram comparados a valores normais e com dados clínicos e funcionais. Resultados: Foram observadas diferenças estatisticamente significantes entre as médias do tempo de balanço (p = 0,002), tempo de apoio (p = 0,01) e da relação apoio/balanço (p < 0,001). A comparação aos valores normais de Sutherland também demonstrou a assimetria na marcha. Não foi observada relação direta entre a função motora avaliada pela escala GMFM e a assimetria. Já a análise do escore para itens específicos dessa escala pôde relacionar a assimetria à idade de aquisição da marcha independente. Crianças com tônus muscular mais adequado apresentaram maior tempo de apoio no lado envolvido do que aqueles com maior espasticidade (p = 0,03). Conclusões: Esses resultados sugerem que a melhor performance está associada à menor assimetria nesta amostra. Mesmo que a análise bidimensional não ofereça todos os dados cinemáticos de um laboratório de marcha, acreditamos que pode contribuir para a avaliação de crianças com paralisia cerebral.
Descritores: Marcha; Paralisia cerebral; Hemiplegia; Criança
INTRODUCTION
Motion is essential to humans. Upright posture associated with correct motion is a requirement for numerous activities in everyday life. During gait, the sequential lower limb support displaces the individual
Study linked to the Postgraduate Program of Child and Adolescent Health of the Department of Pediatrics of Universidade Federal do Paraná – UFPR, Curitiba (PR), Brazil. 1 PhD at Universidade Federal do Paraná – UFPR, Curitiba (PR), Brazil.
2 PhD; Lecturer at Universidade Federal de São Paulo – UNIFESP, São Paulo (SP), Brazil; Orthopedic Surgeon of Hospital Israelita Albert Einstein – HIAE; São Paulo (SP), Brazil
3 PhD student of the Postgraduate Program of Child and Adolescent Health of the Department of Pediatrics of Universidade Federal do Paraná – UFPR; Lecturer at Universidade Tuiuti do Paraná – UTP,
Curitiba (PR), Brazil.
4 Bachelor’s degree in Computer Science and Physical Educator of Universidade Tuiuti do Paraná – UTP, Curitiba (PR), Brazil. 5 PhD; Adjunct Professor of Department of Pediatrics of Universidade Federal do Paraná – UFPR, Curitiba (PR), Brazil.
from one point to another with great versatility and low
energy consumption(1). Mastering this ability requires
a combination of instinct and learning. Humans learn how to integrate variables into their neuromuscular system, allowing locomotion to occur in a reasonably
easy and efficient manner(2). The gait cycle has two
phases: stance and swing. The duration is defined in percentage, in which 100% represents the total cycle time. Stance phase occurs when the foot contacts the ground and accounts for 60% of the total cycle. In swing phase – 40% of the cycle – the foot “leaves” the ground
and moves forwards(3). In normal gait these phases are
symmetric in duration (if you count double support)
and repeat in each successive cycle(2).
Disturbances in the brain, spinal cord, nerves, muscles and skeleton may hinder overall motor function
and gait(1). In children with spastic hemiplegia due to
cerebral palsy (CP), a non uniform distribution of lower limb weight bearing, balance and proprioception deficits are observed in gait. This results in asymmetry, which is the most prominent characteristic of the gait in hemiplegic children. The body weight is supported mostly by the non-involved lower extremity. The weight
transfer to the involved side is brief and incomplete(4,5).
Considering that the ability to walk is primarily determined by actions involving weight transfer to the support limb, important alterations in the gait dynamics
of hemiplegic patients are identified(3). The percentage
of stance time in the gait cycle of the involved lower limb may be reduced, as well as the total cycle time. Comparisons between sides in stance and swing, stance/ swing time ratios and the duration of single limb stance and double support provide evidence of symmetry,
stability and progression possibilities(3). Gait can be
assessed by observation exclusively or by tridimensional
computer analysis in specialized laboratories(6-8), which is
the standard use for gait research. In CP gait is assessed
using electronic walkways(9,10) and two-dimensional
analysis(11). For this study, a two-dimensional kinematic
analysis was used. Sagittal displacement was measured aiming to supplement the traditional subjective visual
evaluation with quantitative information(1). Technology
has improved videography. The ability to digitize analog images allows for the quantification of linear parameters, such as cycle time, cadence, velocity and
duration of stance and swing phases(12).
The following hypotheses were considered in this article: (1) it is possible to quantify spatiotemporal gait asymmetry of children with spastic hemiplegia using two-dimensional analysis, and (2) gait asymmetry is related to Gross Motor Function Measure (GMFM) scores and age for independent gait acquisition.
METHODS
The study was approved by the Human Research Ethics Committee of the Universidade Federal do Paraná (UFPR), Curitiba, Paraná, Brazil, and informed consent to participate was obtained from parents.
Participants
Twenty-four children with spastic hemiplegic CP, with a maximum age range of 60 months, were invited to participate in the study (Table 1). They were recruited from the population of children treated at the Pediatric Spasticity Ambulatory unit of the UFPR. The children had to be co-operative and capable of walking independently according to Gross Motor Function
Classification System (GMFCS)(13) levels I and II.
Procedures
The images were recorded with a video camera model SVHS (Sony TRV-140), positioned on a tripod (Velbon VT-30), orthogonally oriented towards the gait progression line in controlled illumination conditions. The tripod height was 0.80 m and the focal distance was
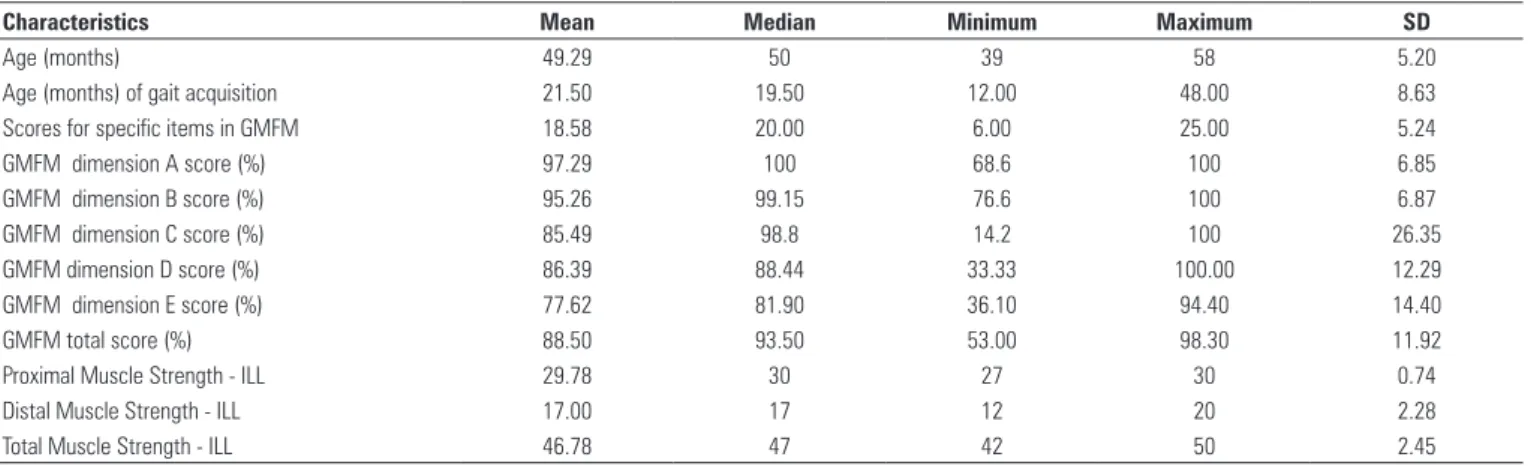
Table 1. Clinical and functional data related to gait time/distance parameters
Characteristics Mean Median Minimum Maximum SD
Age (months) 49.29 50 39 58 5.20
Age (months) of gait acquisition 21.50 19.50 12.00 48.00 8.63
Scores for specific items in GMFM 18.58 20.00 6.00 25.00 5.24
GMFM dimension A score (%) 97.29 100 68.6 100 6.85
GMFM dimension B score (%) 95.26 99.15 76.6 100 6.87
GMFM dimension C score (%) 85.49 98.8 14.2 100 26.35
GMFM dimension D score (%) 86.39 88.44 33.33 100.00 12.29
GMFM dimension E score (%) 77.62 81.90 36.10 94.40 14.40
GMFM total score (%) 88.50 93.50 53.00 98.30 11.92
Proximal Muscle Strength - ILL 29.78 30 27 30 0.74
Distal Muscle Strength - ILL 17.00 17 12 20 2.28
Total Muscle Strength - ILL 46.78 47 42 50 2.45
2.40 m, measured from the center of a visual walkway to the camera. The walkway extension in the field of view of the camera was 2.10 m with markers placed every 10 cm. Images were recorded on VHS video tapes and digitized using a Pixel-A for Sony (version 1.5) video card.
Windows Movie Maker® (WMM) software was used for
gait phase selection. WMM automatically provides time in seconds and allows for the measurement of each phase of the gait cycle. The amount of time for one cycle is the
basis for gait cadence calculation in steps per minute(1).
The 29.97 fps WMM also allows for slow motion or frame by frame movement analysis. Each frame can be copied
and pasted to other analysis software. Corel Draw®13
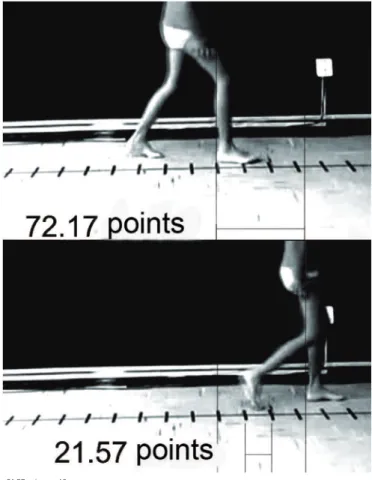
(Corel Corporation, Canada) was the conversion tool for displacement measurements during the gait cycle. The walkway markings were the reference points that allowed for correction and calculation of step and stride lengths (Figure 1).
Velocity was calculated by the following formula:
Velocity
(cm/s) =
stride length (cm) x cadence (steps/min) 120
Figure 1. Measuring the distances in the walkway with the Corel Draw® (Corel Corporation, Canada) software
21.57 points = 10 cm 72.17 points = X cm
The following parameters were measured: gait cycle time (s), cadence (steps/min), velocity (cm/s), stride and step lengths, stance and swing duration, single limb stance duration, first double support (FDS) and second double support (SDS), of the noninvolved and the involved side. These values were then compared to normal values described by
Sutherland et al.(14).
The asymmetry rate was obtained using the parameters from the involved side of each child,
according to the following formula(15):
Asymmetry rate =
first double support duration ±
first single limb stance duration second double support duration
+ swing duration
The course of one cycle was chosen as representative and taken into account for the gait description. Gait variables assessed by two-dimensional analysis were related to the following clinical and functional data: child’s age, age for independent gait acquisition as reported by parents, muscle tone and lower limb strength. Muscle tone was assessed by the Ashworth
scale(16) and, as suggested by Brown et al.(17), the surae
triceps (gastrocnemius and soleus) was assigned a minimum score of 1 and a maximum score of 5. The muscle strength on the involved lower limb was measured according to criteria adopted by the Medical
Research Council Memorandum(18) and ranged from
0 (no contraction) to 5 (normal strength). Ten muscle groups were assessed and divided into proximal and distal; hip and knee flexors and extensors and hip adductors and abductors were categorized as proximal, the foot and toes flexors were categorized as distal. Hence a score of 50 was possible to obtain by this method, in which 20 was related to distal strength and 30 to proximal strength.
The functional data listed in this study were
assessed using the GMFM(19), which was developed and
validated for children with CP and comprises 88 items assessing the function related to five domains: (A) lying and rolling, (B) sitting, (C) crawling and kneeling, (D)
standing, (E) walking, running and jumping(20). For this
study, in addition to the scores per domain and total, the score obtained for the selection of the GMFM items 57, 58, 75, 76, 78, 79, 80, 81, 82 and 83, related to the capacity of balance and weight transfer between sides at the standing posture, was also used, with a maximum of 30 points.
The hemiplegic gait patterns were described using
Statistics
Results were expressed as means, standard deviations, medians, minimum and maximum values or frequencies and percentages. For the association between quantitative variables, the Spearman’s correlation coefficient was estimated. To compare the quantitative variables in two independent subgroups, either Student’s
t-test or Mann-Whitney’s non-parametric test were used
whenever appropriate. Fisher’s exact test was used for comparisons between dichotomic nominal variables and
Student’s t-test for dependent samples or Wilcoxon’s
non-parametric test was used for comparisons between involved and noninvolved sides regarding quantitative variables. The p value < 0.05 was considered statistically
significant. Statistica/w v.5.1® software was used.
RESULTS
The mean age was 49 months (SD 5 months), range from 39 to 60 months. Five children were female, 11 presented with the right side involvement and 22 (92%) were GMFCS level 1.
Gait spatiotemporal parameters assessed in this study are described in table 2. Clinical and functional data related to these parameters are described in table 1.
No patient had hypotonia or rigidity. The cases were subdivided in Group A (n = 14) (patients classified as 1 and 2 on Ashworth scale), and Group B (n = 8) (patients classified as 3 and 4 on Ashworth scale). The average stance time of the involved side in Group A was significantly higher than in Group B (p = 0.04).
Sixteen cases were Type I and eight cases were Type II,
according to the WGH classification(21).Children classified
as Type I displayed significantly lower muscle tone in the surae triceps than children classified as Type II (p = 0.03).
Comparison of spatiotemporal parameters data with
normal values(14) can be seen in table 3. The relations of
interest to the study of hemiplegic gait asymmetry were selected and the significant or near-significant results are described in table 4.
Table 2. Parameters obtained and analyzed through two-dimensional analysis (n = 24)
Analyzed parameters Mean SD
Cadence (steps/min) 133.92 27.44
Velocity (cm/s) 71.75 25.75
Total gait cycle time (s) 0.94 0.20
Stride length (cm) 63.37 15.79
Step length (cm) – NIS 31.96 9.00
Time percentage: swing – NIS 29.29 4.87
Time percentage: stance – NIS 70.58 4.76
Stance/swing relation – NIS 2.52 0.70
Time percentage: single limb stance – NIS 32.67 5.31
Time percentage: first double support – NIS 20.92 5.66
Time percentage: second double support – NIS 17.17 4.69
Step length (cm) – IS 31.41 8.80
Time percentage: swing – IS 32.63 5.39
Time percentage: stance – IS 67.75 5.24
Stance/swing relation – IS 2.17 0.59
Time percentage: single limb stance – IS 28.79 4.85
Time percentage: first double support – IS 17.17 4.69
Time percentage: second double support – IS 21.58 6.32
Asymmetry rate – NIS 0.87 0.11
SD: standard deviation; NIS: non-involved side; IS: involved side. Note: percentages were calculated relative to gait cycle time duration.
Table 3. Comparison with Sutherland normal values
Analyzed parameters Values (%)
Below Normal Above
Cadence (steps/min) 50 41.67 8.33
Velocity (cm/s) 62.50 29.17 8.33
Total gait cycle time (s) 0.00 33.33 66.67
Stride length (cm) 62.50 29.17 8.33
Step length (cm) – NIS 58.33 29.17 4.17
% of Swing time – NIS 83.33 16.67 0.00
% of Stance time – NIS 0.00 29.17 70.83
% of Single Limb Stance time – NIS 62.50 20.83 16.67
% of FDS time – NIS 4.17 12.50 83.33
% of SDS time – NIS 16.67 20.83 62.50
Step length (cm) – IS 66.67 25.00 8.33
% of Swing time – IS 54.17 37.50 8.33
% of Stance time – IS 4.17 58.33 37.50
% of Single Limb Stance time – IS 95.83 0.00 4.17
% of FDS time – IS 29.17 8.33 62.50
% of SDS time – IS 0.00 16.67 83.33
NIS: non-involved side; IS: Involved side; FDS: first double support; SDS: second double support.
Table 4. Correlations from the two-dimensional analysis
Evaluated relation Correlation (R) p value
Cadence Velocity 0.709 0.000
Cadence Swing NIS 0.463 0.023
Cadence Stance NIS -0.469 0.021
Velocity Step NIS 0.794 0.000
Velocity Swing NIS 0.755 0.000
Velocity Stance NIS -0.771 0.000
Velocity Stance IS -0.400 0.053 *
Velocity SLS NIS 0.410 0.047
Velocity SLS IS 0.609 0.002
Velocity Step IS 0.716 0.000
Swing NIS Swing IS 0.487 0.016
Swing NIS Stance IS -0.483 0.017
Swing IS Stance NIS 0.472 0.020
Swing IS Stance IS -0.997 0.000
Stance NIS Stance IS 0.474 0.019
SLS NIS SLS IS 0.394 0.057 *
FDS NIS FDS IS 0.475 0.019
SDS NIS SDS IS 0.422 0.040
Step IS SLS NIS 0.557 0.005
Step IS Swing IS 0.497 0.013
Step IS Stance IS -0.519 0.009
Step IS SLS IS 0.464 0.022
Step IS FDS IS -0.406 0.049
Step IS SDS IS -0.470 0.020
Limp Rate Step NIS 0.433 0.035
The relationship between the mean time of stance (p = 0.012) and swing (p = 0.002) phases between sides was statistically significant. There was no difference in step length (p = 0.747) between the involved and noninvolved sides.
The FDS and SDS percentages in the gait cycle with lower limb’s muscle strength were also compared. On the involved side, FDS was higher the lower the distal strength (p = 0.07) and total strength (p = 0.05). On the noninvolved side, SDS was higher the lower the distal strength (p = 0.06) and total strength (p = 0.05).
Cadence and cycle time (TCT) were related to the GMFM. The lower the cadence, the higher the score observed in this scale for sections B (p = 0.06), C (p = 0.01) and E (p = 0.04), which also was related to the GMFM total (p = 0.05). The higher the TCT, the higher the score for sections C (p = 0.01), E (p = 0.03) and GMFM total (p = 0.04).
The data indicated that the higher the age of gait acquisition, the shorter the time spent in the single support on the involved side (p = 0.05). In addition, swing time was shorter in children with an older age at gait acquisition (r = -0.46, p = 0.02).
The lower the age of independent gait acquisition, the higher the scores on the weight transfer and balance items (p = 0.04), for section E (p = 0.04) and GMFM total (p = 0.03). No relationship between GMFM and the asymmetry rate and percentages of stance and swing time was observed.
DISCUSSION
The assessment of gait presented in this study was carried out using a two-dimensional analysis by
videography. Crowther et al.(22) used a two-dimensional
analysis to examine the spatiotemporal parameters and gait kinematics of individuals with peripheral arterial disease. They correlated the results with walking performance, exercise capacity, and physical activitiy
level. Vogt et al.(23) validated the use of two-dimensional
pelvis and thorax translation data for the assessment of gait disturbances and concluded that asymmetric limping, similar to gait disorders of individuals with hip pathologies, could be detected and described using this
kind of analyses. Toro et al.(11), in 2007, also described
a two-dimensional analysis of gait using videography in CP and included the development and validation of clinical assessment tools.
Stance and swing phases duration can be altered depending on the degree of dysfunction and whether
the patient has mono or bilateral involvement(3).
This study analyzed the gait of hemiplegic children presenting asymmetry between the involved and noninvolved lower limb in stance and swing phases of
gait. Our data suggest that stance phase lasts significantly longer on the noninvolved lower limb.
No significant relation was observed between the step length on the two sides, but a difference was observed in the stance and swing time, suggesting increased difficulty in weight transfer.
It was observed that the time percentages of FDS and SDS are asymmetric and was our impression that perfect contra-lateral compensation maintains cycle sequence relatively undisturbed. A more prolonged FDS of the noninvolved side is a necessity, due to the difficulty to lift the foot in initial swing on the involved side. Double support periods seem to be longer in duration than expected for the age of the participants in this study, which may be the result of weight transfer issues and limb instability during single limb stance.
The relationship between the time of double support and the lower muscle strength can also be used to understand this process. It may be that the weakness of the involved lower limb, even when analyzed in a group whose majority is with slight involvement, results in inability to generate enough vertical moments to withstand weight through that single limb in stance.
Riad et al.(24) investigated hip and ankle power
generation in children with spastic hemiplegic CP and no previous surgery. They found a major power generation shift from the ankle to the hips on the involved and the noninvolved side and interpreted it as a way of compensating for decreased ankle power generation on the hemiplegic side.
In this two-dimensional analysis, the asymmetry could be observed and statistically demonstrated with larger evidence in the temporal parameters than in the spatial ones. Futures studies are necessary to verify if the same would be observed with other groups of hemiplegic children.
The asymmetry could also be analyzed by the
comparison with Sutherland’s normal values(14). The
increase in time for double support was bilaterally observed in the majority of children. This comparison also showed decrease in time for single support in the majority of children, especially on the involved side. Swing phase is decreased, particularly on the noninvolved side. Cadence, velocity, stride and step length were below the expected values. The most remarkable deviation was related to the increase in overall time for the gait cycle.
In normal children, gait velocity increases with
height, while cadence decreases(3). In this study, we noted
velocity increasing due to faster cadence, which may be a
compensatory mechanism for their lack of stability(25).
Data demonstrated a correlation between younger age of gait acquisition and longer swing time, suggesting a relationship with longer duration of single support on the involved side unlike the previous studies of Inman et
al.(2). These data infer that the therapeutic interventions
addressed for motor abilities before gait acquisition could directly influence the quality of the gait.
Total gait cycle time was increased in this study, although single support was decreased in children with higher tone, perhaps suggesting that the single support is a more sensitive indicator of instability.
Score analysis for specific items of the GMFM quantify asymmetry when related to independent gait acquisition age. The lower age of independent gait acquisition was related to better balance and abilities for activities requiring weight transfer, suggesting that the best performance is related to the lowest asymmetry. The relation between gait cadence and the score for sections that do not assess gait capacity in the GMFM point to the relevance of postural control in static and dynamic orthostatism.
The GMFM does not seem to allow for asymmetry analysis, since it is directed to measuring the capacity to perform rather than quality of the required movement.
In a study carried out by Drouin et al.(26), significant
relationships were observed between spatiotemporal parameters of gait, specially velocity, and motor function assessed by the GMFM. The population studied by those authors, unlike this study, also included ambulators using assistive devices. These authors observed that the correlation between gait velocity and section E was higher in children walking more slowly and with support than those walking independently with velocities higher than 45cm/s, concluding that the GMFM is less sensitive when the child walks at a velocity closer to normal. This may explain the lack of correlation between velocity and the motor function in this group, in addition to the population homogeneity. Several functional activities related to gait can be scored using the GMFM, while both quantitative and qualitative measurements are possible using two-dimensional analysis. This indicates that the selection of a gait assessment tool depends on the aspect to be assessed and that GMFM and two-dimensional analysis may be complementary.
Higher muscle tone in triceps surae in Type II
hemiplegia(21) was expected; however, there was no
relationship with gait performance. Children with muscle tone closer to normal patterns presented longer stance time in the involved limb than those with more spasticity, probably due to the better stability in stance.
The group of subjects in this study was quite homogeneous with 67% classified as Type I, according
to the WGH classification(21). This may explain the fact
that the asymmetry rate was very close to normal and that the difference of step lengths on the two sides was not significant. Even close to normal values of asymmetry rate related to cadence suggested immaturity of gait in this sample.
CONCLUSIONS
Although two-dimensional gait analysis does not provide as much data as three dimensional gait analyses, we believe it can contribute significantly to the gait assessment of children with CP. Simplicity and low cost are significant advantages. Simple measures of gait for routine clinical use in a variety of settings could be useful when the complex gait analysis systems are not available. In this study, two-dimensional gait analysis was useful to quantify spatiotemporal parameters and identify some relevant issues, even considering the very mild gait disturbances and the young age of this sample. Future studies, with representative samples correlating these results with more established methods, are important.
ACKNOWLEDGEMENT
We wish to thank Paulo R. Selber, PhD, who provided his time and expertise to review this study.
REFERENCES
1. Ramalho-Junior, A. Marcha normal e patológica. In: Hebert S, Xavier R, Pardini Junior AG, Barros Filho TE, editors. Ortopedia e traumatologia: princípios e prática. Porto Alegre: Artmed; 2003. p. 35-55.
2. Inman VT, Ralston HJ, Todd F. Human locomotion. In: Rose J, Gamble JG, editors. Human walking. Baltimore: Williams & Wilkins; 1994. p. 3-22.
3. Adams JM, Perry J. Gait analysis: clinical application. In: Rose J, Gamble JG, editors. Human walking. Baltimore: Williams & Wilkins; 1994. p.139-63.
4. Bobath K, Bobath B. Desenvolvimento motor nos diferentes tipos de paralisia Cerebral. São Paulo: Manole; 1989.
5. Styer-Acevedo J. Fisioterapia para crianças com paralisia cerebral. In: Tecklin JS, editor. Fisioterapia pediátrica. 3a ed. Porto Alegre: Artmed; 2002. p.
98-140.
6. Bell KJ, Ounpuu S, DeLuca PA, Romness MJ. Natural progression of gait in children with cerebral palsy. J Pediatr Orthop. 2002;22(5):677-82.
7. Dursun E, Dursun N, Alican D. Ankle-foot orthoses: effect on gait in children with cerebral palsy. Disabil Rehabil. 2002;24(7):345-7.
8. O’Byrne JM, Jenkinson A, O’Brien TM. Quantitative analysis and classification of gait patterns in cerebral palsy using a three-dimensional motion analyzer. J
Child Neurol. 1998;13(3):101-8.
9. Sorsdahl AB, Moe-Nilssen R, Strand LI. Observer reliability of the Gross Motor Performance Measure and the Quality of Upper Extremity Skills Test, based on video recordings. Dev Med Child Neurol. 2008;50(2):146-51.
11. Toro B, Nester CJ, Farren PC. The development and validity of the Salford Gait Tool: an observation-based clinical gait assessment tool. Arch Phys Med Rehabil. 2007;88(3):321-7.
12. Rowe PJ. Sistemas de mensuração. In: Durward BR, Baer GD, Rowe PJ. Movimento funcional humano. São Paulo: Manole; 2001. p. 35-5.
13. Palisano R, Rosenbaum P, Walters S, Russell D, Wood E, Galuppi P. Development and reliability of a system to classify gross motor function in children with cerebral palsy. Dev Med Child Neurol. 1997;39(4):214-23.
14. Sutherland DH, Olshen RA, Biden E, Wyatt MP. The development of mature walking. Oxford: Mac Keith Press; 1988.
15. Campos da Paz A, Ramalho A Jr, Momura A, Braga LW, Almeida M. Gait analysis in clubfeet: an experimental study. In: Simons GW. The clubfoot: the present and a view of the future. New York: Springer Verlag; 1994. p. 81-7. 16. Ashworth B. Preliminary trial of carisoprodol in multiple sclerosis. Practitioner.
1964;192:540-2.
17. Brown JK, van Rensburg F, Walsh G, Lakie M, Wright GW. A neurological study of hand function of hemiplegic children. Dev Med Child Neurol. 1987;29(3):287-304.
18. Medical Research Council of the United Kingdom. Aids to examination of the peripheral nervous system. Palo Alto (CA): Pedragon House; 1978. [Memorandum, 45]
19. Russell DJ, Rosenbaum PL, Cadman DT, Gowland C, Hardy S, Jarvis S. The gross motor function measure: a means to evaluate the effects of physical therapy. Dev Med Child Neurol. 1989;31(3):341-52.
20. Bjornson KF, Graubert CS, Buford VL, McLaughlin J. Validity of the gross motor function measure. Pediatr Phys Ther. 1998;10(2):43-7.
21. Winters TF Jr, Gage JR, Hicks R. Gait patterns in spastic hemiplegia in children and young adults. J Bone Joint Surg Am. 1987;69(3):437-41.
22. Crowther RG, Spinks WL, Leicht AS, Quigley F, Golledge J. Relationship between temporal-spatial gait parameters, gait kinematics, walking performance, exercise capacity, and physical activity level in peripheral arterial disease. J Vas Surg. 2007;45(6):1172-8.
23. Vogt L, Brettmann K, Pfeifer K, Banzer W. Gait disorders – assessment and rehabilitation supported by movement analysis. Z Orthop Ihre Grenzgeb. 2002;140(5):561-7.
24. Riad J, Haglund-Akerlind Y, Miller F. Power generation in children with spastic hemiplegic cerebral palsy. Gait Posture. 2008;27(4):641-7.
25. Bril B, Breniere Y. Postural requirements and progression velocity in young walkers. J Mot Behav. 1992;24(1):105-16.