Rodrigo Andrés Giacaman Paulina Miranda Reyes Valeria Bravo León
CariologyUnit, Department of Oral Rehabilitation, University of Talca, Talca, Chile.
Corresponding author: Rodrigo Andrés Giacaman E-mail: [email protected]
Caries risk assessment in chilean
adolescents and adults and its
association with caries experience
Abstract: Cariogram is a computer program that uses an algorithm to assess caries risk. Although the use of Cariogram has recently increased, little information is available regarding its effectiveness in adults. This study aimed to determine whether caries risk from Cariogram relates to caries experience in adults. One hundred and eighty Cariogram iles were completed from patients aged ten to ifty-six years (mean: 23.28 years). Seven factors from the software were included from patient records to complete the Cariogram: caries experience, diet (content and frequency), stimulated salivary low, hygiene index, related diseases and luoride us-age. The percentages of “chances of avoiding new lesions” (caries risk) were obtained from Cariogram, and the subjects were classiied into ive risk groups. Results were compared for each variable with ANOVA, and a correlation between caries and Cariogram variables was calculated by Pearson’s correlation coeficient. A multivariate regression model was also used. Only three patients were classiied as low risk, and none were classiied as very low risk. Thus, only the four upper quintiles were con-sidered for the analysis, and the lower quintile was not concon-sidered in the study. Neither DMFT nor the number of lesions were signiicantly differ-ent among the Cariogram’s risk categories (p > 0.05). Only diet contdiffer-ent was signiicantly correlated with caries experience (p = 0.006). Caries le-sions failed to correlate with any Cariogram variable (p > 0.05). Age, not sex or caries risk scores, showed a strong and positive association with DMFT (p < 0.01). Caries risk from Cariogram appears to be unrelated with caries experience or caries lesions in a high-caries adult population.
Descriptors: Dental Caries; Dental Caries Susceptibility; Adult; Chile.
Introduction
Caries continues to affect nearly every adult and most of the children in the world.1 Although caries incidence has been greatly reduced in some
countries,2 other populations continue to be extensively affected.
An association between per capita income and caries experience has recently been demonstrated.3 In most developing countries, dental care
does not reach all of the population due to high costs. Because caries distribution in the population is remarkably uneven,4 an accurate
assess-ment of caries risk would allow better use of limited resources.
Risk assessment has moved from the mere addition of individual risk factors5 to an approach in which risk factors are weighted based on the
Declaration of Interests: The authors certify that they have no commercial or associative interest that represents a conflict of interest in connection with the manuscript.
Submitted: Jun 25, 2012
putative role they play in the etiology of the disease.6
Along the same line of thought, a caries risk soft-ware, Cariogram, has been developed and validat-ed.7 The weight of the component factors included
in the program is derived from expert consensus. Cariogram has shown promising results in pre-dicting caries in children.8,9 Indeed, Cariogram was
more accurate in predicting caries than any single factor in a study conducted on 446 10- to 11-year-old children over a period of 2 years.10 In adults,
however, only few studies have been published.11
Cariogram has been successfully used to predict caries in older adults12 in a 5-year prospective study.
Based on the scarce information available on the performance of Cariogram in adults and its per-formance in countries with different ethnic back-grounds and socioeconomic statuses, the aim of this study was to determine whether values obtained from the Cariogram relate with the actual caries ex-perience in a high-caries adult Chilean population. The hypothesis in this study was that higher caries risk, as assessed by Cariogram, corresponds with a higher caries experience of an adult population.
Methodology
Clinical records from the Dental Clinics of the University of Talca were used in this cross-sectional study. The sample size for the study was determined considering a power of 80% and a type I error of 5%.
This study was carried out with the clinical re-cords of subjects regularly attending the University’s Dental Clinics. All subjects signed an informed con-sent to allow the researchers to use their data.
Calculations were based on reported data on dental caries history (DMFT) of young adults in this age group in Chile. A mean DFMT difference of 3 points (± 5) was considered suficient to detect differences between categories. Hence, a sample of 44 individuals was necessary. Given the fact that we divided the sample into ive hypothetically dis-similar categories, we decided to oversample by us-ing all of the records from the patients attendus-ing the fourth-year clinic. Therefore, one hundred and eighty dental records of patients aged 10 to 56 years were included, with a mean age of 23.28 years.
The sample consisted of seventy-one male and one hundred and nine female patients, as described in Table 1. As part of the clinical exam, a Cariogram (Malmö University, Malmö, Sweden) was created for each patient in the undergraduate dental clin-ics. Clinical records from the fourth-year clinic were used in this investigation. All available clinical re-cords were considered, but only rere-cords from those patients irst examined from March to September 2010 were included. The clinic serves individuals 10 years of age and older. Because treatment complex-ity was relatively low for the students of the fourth year, most of the patients were young but commonly with high caries experience. To avoid a bias from interpretation of the data from the student’s den-tal records, a new Cariogram was created by three trained investigators who did not conduct the exam-inations. Seven component factors of the Cariogram were included to complete the required information in the program, as described in Table 2. To avoid bias, clinical judgment, which is based on the opin-ion of the clinician, was set to 1 for all the patients.
Caries experience was obtained from the DMFT of the patients, visually assessed using WHO crite-ria13 and supplemented with bitewing radiographs.
Cariogram scoring for the DMFT was based on whether the subject had a DMFT below, within or above the age group range (Table 3). Related dis-eases were obtained from the questionnaire in the patient’s record. Dietary information was collected from a weekly dietary questionnaire completed by each patient. Patients completed a weekly question-naire that documented all of the foods consumed for a week. Plaque quantity was assessed by the O’Leary Hygiene Index14 and scored as shown in
Table 2. After assessing all of the information of the seven factors considered in this study, the data were entered into the Cariogram software. Once
in-Table 1 - Patient distribution by age and gender.
Gender n Age
mean SD
Male 71 23.48 8.91
Female 109 23.17 8.53
category. To explore potential associations between Cariogram values (actual chance to avoid new cavi-ties) and caries with the seven individual variables, Pearson correlation coeficients were calculated. A multivariate regression model was performed using DMFT as the dependent variable and caries risk score, age and sex and their interaction as indepen-dent variables. All analyses were performed using SPSS for Windows v.15 (IBM Inc. Chicago, USA), and p-values lower than 0.05 were considered sig-niicant.
Results
Values obtained from the Cariogram were di-vided into quintiles7 and patients were classiied as
having very low, low, moderate, high and very high risk of caries, depending on their percentage of risk. Thus, the highest quintile of “actual chance to avoid new cavities” obtained from the Cariogram was con-sidered as “very low” caries risk. The patients had a mean age of 23 years (Table 1). While no subject formation is entered into the program, a pie chart
is automatically generated that shows a green area of the chart indicating the “actual chance to avoid new cavities”, which is expressed as a percentage of the pie chart. Thus, the subjects were classiied into 5 caries risk groups according to the percentage shown by the Cariogram:7
• very low risk: 81–100%;
• low risk: 61–80%;
• moderate risk: 41–60%;
• high risk: 21–40%; and
• very high risk: 0–20%.
Statistical analysis
To determine whether the patient distribution within each factor of the Cariogram was statisti-cally different, a chi-square test was conducted for each variable. The results were analyzed by ANO-VA, followed by Tukey’s test to determine whether caries experience (DMFT) or caries lesions were sig-niicantly different from the Cariogram in each risk
Sector Variable Instrument used Score Circumstances Caries
experience DMFT of the population by age
0: No caries experience
1: Lower than the age group range 2: Within the age group range 3: Higher than the age group range Circumstances Related
diseases Health questionnaire (Clinical record)
0: No caries-related disease 1: Related disease - Mild degree 2: Related disease - Severe degree Diet Diet content Weekly diet diary 0: Very low amount of sugar
1: Low amount 2: Moderate amount 3: High amount
Diet Diet
frequency Weekly diet diary 0: 0 to 3 daily intakes1: 4 to 5 daily intakes 2: 6 to 7 daily intakes 3: More than 7 daily intakes Bacteria Plaque
quantity Silness-Löe plaque index 0: More than 95% plaque-free1: 80%–95% 2: 50%–80%
3: Less than 50% Susceptibility Fluoride
program Oral health questionnaire (Clinical record)
0: Complete fluoride program
1: Irregular but complete fluoride program 2: Only dentifrices
3: No fluoride supplements Susceptibility Salivary
secretion Stimulated saliva test 0: > 1.1 mL/min1: 0.9 – 1.1 mL/min 2: 0.5 – 0.9 mL/min 3: < 0.5 mL/min Table 2 - Input variables and
was classiied as “very low risk” and only 3 patients as “low risk”, 39, 107 and 31 people were classiied as “moderate”, “high” and “very high” risk, respec-tively. Caries experience (DMFT) of the group was very high, with a mean DMFT of 11.23 ± 5.23 and an average of 7.27 ± 4.21 lesions per person.
With exceptions made for sex (p > 0.05), the distribution of the patients within each Cariogram
variable was signiicantly different (p < 0.01) for all seven factors considered (Table 3). To examine whether the risk categories obtained from the Car-iogram portrayed caries experience of the group (Figure 1) or number of caries (Figure 2) in the pa-tients, risk categories were compared. No differ-ences were found for either DMFT or the number of caries among the risk categories (p > 0.05). To assess whether individual variables correlated with the DMFT index or the number of carious lesions, Pearson’s correlations was conducted. There was a signiicant positive correlation between age and DMFT (Pearson’s correlation = 0.447; p < 0.01). No correlation of the DMFT with the overall car-ies risk (Pearson’s correlation = 0.07; p > 0.353) was found. The multivariate regression model showed that only age was associated with DMFT. When age interacts with the caries risk score from the Cario-gram, the association with DMFT was maintained. Risk score alone, however, was not associated with DMFT. Among all the Cariogram variables, the only variable that correlated with higher caries ex-perience (DMFT) was diet content (p = 0.006). No correlation was found between diet content and the number of caries (p > 0.05), nonetheless. The other Cariogram variables failed to correlate with either DMFT or the number of lesions (p > 0.05).
Discussion
Caries experience continues to be considered a reliable caries predictor in children15 and adults.16
Unlike caries experience, Cariogram might repre-sent a helpful tool to assess risk before caries is present. In children, the program has shown good predictive values.6-8,17 Little information exists
re-garding the performance of Cariogram in adult individuals and high-caries populations. We there-fore attempted to determine whether Cariogram risk levels were consistent with caries experience in a population of high-caries adult individuals from Chile. Our results showed that Cariogram risk categories by quintiles, as previously proposed,7
do not represent the population studied here. No individual was categorized in the very low caries risk category from the Cariogram data (Figure 1). Furthermore, when DMFT or caries lesions were
Table 3 - Patient distribution by Cariogram scoring.
Variable Scoring n % p
Gender M 71 39.4 > 0.05
F 109 60.6
Related diseases
0: No 175 97.2 < 0.001
1: Mild 3 1.7
2: Severe 2 1.1
DMFT
0: No caries
experience 3 1.67 < 0.001 1: Lower than the
age group range 32 17.78 2: Within the age
group range 118 65.56 3: Higher than the
age group range 27 15.00
Diet content
0: Very low 6 3.3 < 0.001
1: Low 29 16.1
2: Moderate 85 47.2
3: High 60 33.3
Diet frequency
0: 0 to 3 41 22.8 < 0.001
1: 4 to 5 112 62.2
2: 6 to 7 26 14.4
3: More than 7 1 0.6
Hygiene Index
0: 95% – 100% 0 0 < 0.001
1: 80% – 95% 4 2.2
2: 50% – 80% 8 4.4
3: < 50% 168 93.3
Fluoride program
0: Complete 0 0 < 0.001
1: Complete irregular 20 11.1 2: Only toothpaste 160 88.9
3: No fluoride 0 0
Stimulated saliva
0: > 1.1 mL/min 116 64.4 < 0.001 1: 0.9 – 1.1 mL/min 32 17.8
compared between the remaining four risk quin-tiles, no differences were found between any pair of categories (Figures 1 and 2). Despite some stud-ies reporting a high predictive value for Cariogram risk levels,18,19 others have shown only moderate
values in children.20 We did not ind a correlation
between caries experience and any single risk fac-tor proposed by Cariogram, except diet content. It may be that a high-caries population, as exam-ined here, surpasses the ability of the Cariogram to properly illustrate the association between car-ies risk and carcar-ies experience or carcar-ies activity. In addition, this homogeneous caries risk population impairs more deinitive conclusion on the results obtained. A population with more diverse caries distribution may be examined in further studies.
For the purposes of illing the Cariogram, su-crose intake of the patients was assessed based on
a weekly diet questionnaire and risk estimated ac-cording to the sucrose content of the diet (Table 2). Patients with higher sucrose content in their diet showed higher caries experience but not a higher number of carious lesions. It may be that the as-sociation between sucrose consumption and car-ies occurs primarily at an early age. The latter may explain why only DMFT, which indicates cumula-tive caries experience, is associated with sucrose consumption but not current carious lesions. Su-crose has been typically syndicated as an etiologi-cal factor for caries.21 The issue, however, remains
controversial and recent evidence has shown an as-sociation only between certain sucrose-containing foods, such as soft drinks, and caries experience.22
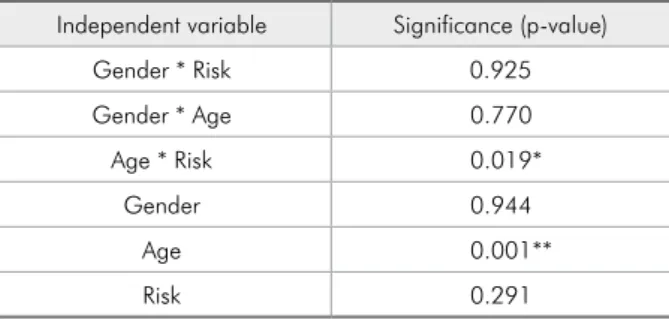
Results from the multivariate model showed a strong association between age and DMFT. Al-though this association persisted when age
inter-Figure 1 - DMFT by risk category. Patients were grouped into 5 caries risk categories derived from the “actual chance of avoiding new cavities” (%) in the Cariogram, as described in Materials and Methods. Risk categories were compared by ANOVA, followed by Tukey’s test to detect differences in DMFT. Each bar represents the mean DMFT. Error bars show the standard deviation of the mean.
acted with Cariogram score (risk), it was weaker than age and DMFT alone (Table 4). An explana-tion for the latter may be that the Cariogram risk score already contains the variable DMFT (Table 3), which in turn is strongly correlated with age (Table 4).
Interestingly, patient distribution in each indi-vidual component variable of the Cariogram was asymmetric (Table 3). For example, while 93.3% of the individuals fell into category “3”, 0%, 4%, and 8% were categorized as “0”, “1” and “2”, re-spectively, suggesting that a Cariogram-proposed categorization of each variable is incapable of sep-arating this type of high-caries population.
Although the Cariogram software includes de-ined parameters to use in illing the instrument, many studies have modiied the variables10, 17 or
re-duced the factors considered.19 Indeed, not
consid-ering S. mutans and the salivary factors reduced the predictive capability of the Cariogram in chil-dren. In our study, several factors were adapted based on our own previous research in adults. For example, we decided not to include S. mutans
counts. Although an association between high lev-els of S. mutans and caries has been extensively reported,23 we have also reported that S. mutans
net counts from saliva samples are not associated with caries experience in adults from a similar high-caries population.24 Because the population
of the microbiological study came from the same social environment as the population of this study,
S. mutans was not considered in completing the Cariogram. We also decided not to incorporate buffer capacity. This factor was not included due to dificulties in performing the exam. Other fac-tors were also modiied based on the protocols currently used in the clinics of the University of Talca (Table 2).
The contribution of biological factors to caries risk has been questioned because of new evidence on the role played by sociobehavioral factors.25
Recently, an association between high caries risk and socially deprived children has been reported.26
Behavioral and other non-clinical risk factors may
allow risk assessment without the need for a clini-cal exam performed by a dentist. Based on this compelling evidence, non-biological factors should be also included, along with new tools, to assess risk.
In general, caries risk factors are primarily based on expert opinions and consensus.27 Thus,
the contribution of each factor to the overall car-ies risk may not represent the actual weight of the variable. In this study, the weights attributed to the risk factors considered in the Cariogram do not appear to explain caries experience or caries activity in Chilean adults. Further tools to assess risk appear necessary but should include other non-biological factors. Individual factors to be in-cluded in the algorithm should be based on stud-ies conducted on the population for whom the tool has been designed.
Conclusion
Caries risk assessment using Cariogram ap-pears to be unrelated with caries experience or the number of caries lesions in this high-caries adult population.
Acknowledgements
The authors sincerely thank Mrs. Nathaly Fuentes for collecting the information and illing the Cariograms from the clinical records. This research has been funded by Grants I001068 of the University of Talca and Fondecyt #11100005 to Rodrigo A. Giacaman. The authors declare no conlict of interest.
Table 4 - Multivariate regression model.
Independent variable Significance (p-value)
Gender * Risk 0.925
Gender * Age 0.770
Age * Risk 0.019*
Gender 0.944
Age 0.001**
Risk 0.291
References
1. Petersen PE, Bourgeois D, Ogawa H, Estupinan-Day S, Ndiaye C. The global burden of oral diseases and risks to oral health. Bull World Health Organ. 2005 Sep;83(9):661-9.
2. Hugoson A, Koch G, Helkimo AN, Lundin SA. Caries prevalence and distribution in individuals aged 3-20 years in Jonkoping, Sweden, over a 30-year period (1973-2003). Int J Paediatr Dent. 2008 Jan;18(1):18-26.
3. Bernabe E, Hobdell MH. Is income inequality related to child-hood dental caries in rich countries?. J Am Dent Assoc. 2010 Feb;141(2):143-9. PMID: 20123871.
4. Beltran-Aguilar ED, Barker LK, Canto MT, Dye BA, Gooch BF, Griffin SO, et al. Surveillance for dental caries, dental sealants, tooth retention, edentulism, and enamel fluorosis– United States, 1988-1994 and 1999-2002. MMWR Surveill Summ. 2005 Aug 26;54(3):1-43.
5. American Dental Association. Caries diagnosis and risk as-sessment. A review of preventive strategies and management. J Am Dent Assoc 1995;126 Suppl:1S-24S.
6. Petersson GH. Assessing caries risk using the Cariogram model. Swed Dent J Suppl. 2003;(158):1-65.
7. Bratthall D, Hansel Petersson G. Cariogram–a multifactorial risk assessment model for a multifactorial disease. Community Dent Oral Epidemiol. 2005 Aug;33(4):256-64.
8. Holgerson PL, Twetman S, Stecksen-Blicks C. Validation of an age-modified caries risk assessment program (Cariogram) in preschool children. Acta Odontol Scand. 2009;67(2):106-12. 9. Campus G, Cagetti MG, Sale S, Carta G, Lingström P. Cario-gram validity in schoolchildren: a two-year follow-up study. Caries Res. 2012 Jan;46(1):16-22.
10. Hansel Petersson G, Twetman S, Bratthall D. Evaluation of a computer program for caries risk assessment in schoolchil-dren. Caries Res. 2002 Sep-Oct;36(5):327-40.
11. Ruiz Miravet A, Montiel Company JM, Almerich Silla JM. Evaluation of caries risk in a young adult population. Med Oral Patol Oral Cir Bucal. 2007 Sep;12(5):E412-8.
12. Hansel Petersson G, Fure S, Bratthall D. Evaluation of a com-puter-based caries risk assessment program in an elderly group of individuals. Acta Odontol Scand. 2003 Jun;61(3):164-71. 13. World Health Organization. Oral health surveys: basic
meth-ods. 4th ed. Geneva: World Health Organization; 1997. 14. O’Leary TJ, Drake RB, Naylor JE. The plaque control record.
J Periodontol. 1972 Jan;43(1):38.
15. Fontana M, Santiago E, Eckert GJ, Ferreira-Zandona AG. Risk factors of caries progression in a hispanic school-aged population. J Dent Res. 2011 Oct;90(10):1189-96. Epub 2011 Jul 15.
16. Twetman S, Fontana M. Patient caries risk assessment. Monogr Oral Sci. 2009;21:91-101.
17. Campus G, Cagetti MG, Sacco G, Benedetti G, Strohmenger L, Lingstrom P. Caries risk profiles in Sardinian schoolchil-dren using Cariogram. Acta Odontol Scand. 2009;67(3):146-52.
18. Petersson GH, Isberg PE, Twetman S. Caries risk profiles in schoolchildren over 2 years assessed by Cariogram. Int J Paediatr Dent. 2010 Sep 1;20(5):341-6.
19. Petersson GH, Isberg PE, Twetman S. Caries risk assessment in school children using a reduced Cariogram model without saliva tests. BMC Oral Health. 2010 Apr 19;10:5.
20. Utreja D, Simratvir M, Kaur A, Kwatra KS, Singh P, Dua V. An evaluation of the Cariogram as a predictor model. Int Dent J. 2010 Aug;60(4):282-4.
21. Zero DT. Sugars - the arch criminal? Caries Res. 2004 May-Jun;38(3):277-85.
22. Lim S, Sohn W, Burt BA, Sandretto AM, Kolker JL, Marshall TA, et al.. Cariogenicity of soft drinks, milk and fruit juice in low-income african-american children: a longitudinal study. J Am Dent Assoc. 2008 Jul;139(7):959-67.
23. Parisotto TM, Steiner-Oliveira C, Silva CM, Rodrigues LK, Nobre-dos-Santos M. Early childhood caries and mutans streptococci: a systematic review. Oral Health Prev Dent. 2010;8(1):59-70.
24. Giacaman RA, Araneda E, Padilla C. Association between biofilm-forming isolates of mutans streptococci and caries experience in adults. Arch Oral Biol. 2010 Aug;55(8):550-4. 25. Petersen PE. Sociobehavioural risk factors in dental caries -
international perspectives. Community Dent Oral Epidemiol. 2005 Aug;33(4):274-9.
26. Fontana M, Jackson R, Eckert G, Swigonski N, Chin J, Zan-dona AF, et al.. Identification of caries risk factors in toddlers. J Dent Res. 2011 Feb;90(2):209-14.