Chaiana Piovesan(a) Fausto Medeiros Mendes(b) José Leopoldo Ferreira Antunes(a) Thiago Machado Ardenghi(c)
(a) Department of Orthodontics and Pediatric Dentistry, School of Dentistry, University of São Paulo, São Paulo, SP, Brazil.
(b) Department of Epidemiology, School of Public Health, University of São Paulo, São Paulo, SP, Brazil.
(c) Department of Stomatology, Federal University of Santa Maria, Santa Maria, RS, Brazil.
Corresponding author: Chaiana Piovesan
Rua José Alves Cunha Lima, 159, apto. 7034, Butantã
São Paulo - SP - Brazil CEP: 05360-050 E-mail: [email protected]
Received for publication on Jul 23, 2010 Accepted for publication on Oct 23, 2010
Inequalities in the distribution of dental
caries among 12-year-old Brazilian
schoolchildren
Abstract: We assessed the inequality in the distribution of dental caries and the association between indicators of socioeconomic status and car-ies experience in a representative sample of schoolchildren. This study followed a cross-sectional design, with a sample of 792 schoolchildren aged 12 years, representative of this age group in Santa Maria, RS, Bra-zil. Guardians answered questions on socioeconomic status and a den-tal examination provided information on the denden-tal caries experience (DMF-T). Inequality in dental caries distribution was measured by the Gini coeficient and the Signiicant Caries Index (SiC). The assessment of association used Poisson regression models. Socioeconomic factors were associated with prevalence of dental caries for the whole sample and also for individuals with a high-caries level. Children from low-income house-holds had the highest prevalence of dental caries. The Gini coeficient was 0.7 and the SiC Index 2.5. The percentage of caries prevalence was 39.3% (95% CI: 35.8%–42.8%) and the mean for DMF-T was 0.9 (± SD 1.5). Inequalities in the distribution of dental caries were observed and socioeconomic factors were found to be strong predictors of the preva-lence of oral disease in children of this age group.
Descriptors: Public Health Dentistry; Epidemiology; Dental Caries; Socioeconomic Factors; Child.
Introduction
Socioeconomic gradients have been simultaneously associated with both caries experience and distribution among preschool and schoolchil-dren.1,2 Despite a global decline in dental caries experience in children, inequalities in oral health exist,3 leading to a high prevalence of disease in some minorities.4,5
An impressive body of scientiic evidence demonstrates the underly-ing inluence of psychosocial, economic, environmental, and political determinants on general health inequalities. However, it is now widely acknowledged that a more comprehensive and detailed understanding of oral health inequalities is needed to enable public health agencies to take effective action against this fundamental health problem.6 Therefore, it is important to know the pattern of dental caries distribution among differ-ent population groups.
caries in each population. The SiC index is the mean DMF/dmf for the one-third of the study group with the highest caries score.7 In a recent Brazilian study using the SiC index, a high polarization in the dis-tribution of dental caries in 12-year-old adolescents was observed.8 In that study, the DMF-T index was 2.45, with an SiC index of 5.08, and 30% of the adolescents were shown to be caries-free. It was ob-served that 70% of caries cases were concentrated among 34% of the adolescents.
Another important measurement of the inequal-ity in caries distribution is the Gini coeficient.9 This coeficient is a well-documented index of inequality used mainly to assess income distribution. Authors have recently advocated its use to measure dental caries experience.4,10 For instance, this indicator documents that the majority of caries experience is increasingly conined to a smaller percentage of the Brazilian population.10
In the Brazilian context, only a few studies have been carried out that clarify the factors associated with caries polarization.1,4,11 Moreover, few studies have documented the inequality in caries distribu-tion using both the SiC index and Gini coeficient in a representative sample of Brazilian children. Therefore, in this cross-sectional study we assessed the inequality in caries distribution and the associa-tion between socioeconomic indicators and caries experience in a representative sample of 12-year-old schoolchildren in Brazil.
Methods
Ethics
The study protocol was approved by the Com-mittee of Ethics in Research of the Federal Univer-sity of Santa Maria, RS, Brazil.
Sample
A survey was performed to assess the oral health status of 12-year-old schoolchildren in the city of Santa Maria, RS, Brazil. In 2008, the city popula-tion was 263,403 inhabitants, with 3,180 children aged 12 years old enrolled in public schools, which corresponds to nearly 85% of all 12-year-old school-children in the city. Multistage sampling considered all public schools in Santa Maria as primary survey
units; 20 out of 39 schools were randomly selected. A random sample of children (second survey units) was extracted from a list encompassing all students enrolled in the selected schools.
For the sample calculation to assess the preva-lence of dental caries, we adopted a standard error of 5%, a conidence interval level of 95%, and an expected prevalence of 50%. In addition, the design effect was estimated to be 1.4 and 10% was added for non-responses. The decision to use a prevalence of 50% was based on lack of information regarding the actual prevalence of the outcome in the city of Santa Maria. The minimum sample size to satisfy the study requirements was estimated at 530 chil-dren. The assessment of association between caries experience and socioeconomic covariates was esti-mated using the following parameters: 5% of stan-dard error, 80% of power, 95% of conidence inter-val, design effect of 1.4, 10% for non-response, ratio unexposed to exposed 2:1 (high/low income) and a prevalence ratio of at least 1.4 to be detected. The actual number of participants (792) was larger than the minimum required by these parameters (722).
Data Collection
Data collection included dental examinations of the children and questionnaires sent to parents. Six examiners and six interviewers participated in the study. They were previously trained and calibrated for data collection during 36 hours.
The dental examination used international crite-ria standardized by the World Health Organization for oral health surveys.12 Children were examined in a room with natural light, using CPI probes and plane dental mirrors. The clinical examination re-corded the prevalence of dental caries.
Data analysis
Data analysis used the STATA 9.0 software (Sta-ta Corporation, College S(Sta-tation, TX, USA). Three outcomes were used in this study: prevalence of dental caries (DMF-T > 0), mean caries experience (DMF-T), and prevalence of children taking part of the polarization group. The polarization group was determined considering a cut-off point of DMF-T of 2.00, which corresponded to the mean DMF-T of the one-third of the study group with the highest caries score. Poisson regression analyses taking into account the cluster sample were performed to as-sess the association between the predictor variables and the outcomes. In the analyses, we calculated the prevalence ratio (PR; 95%CI) to assess the predic-tors of caries prevalence and polarization group, and the rate ratio (RR; 95%CI) to assess the predic-tors of caries experience (DMF-T). Poisson regres-sion has been described as an appropriate analytical resource to assess factors associated with both count and binary outcomes.A backward stepwise proce-dure was used to include or exclude explanatory variables in the itting of models. Explanatory vari-ables presenting a P value ≤ 0.20 in the assessment of correlation with each outcome (unadjusted analy-ses) were included in the itting of models. Explana-tory variables were selected for the inal models only if they had a P value ≤ 0.05 after adjustment.
An online spreadsheet provided by the WHO Collaborating Centre in Malmö University, Swe-den,13 was used for the SiC calculation. The as-sessment of Gini coeficients was calculated using a spreadsheet provided and published in another
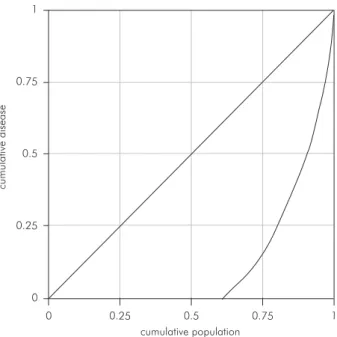
study.4 The Gini coeficient varies between 0, which relects the complete absence of inequality in the distribution of disease, and 1, with higher igures re-lecting higher levels of inequality. Graphically, the coeficient is represented by the area between the line of equality and the Lorenz curve.14 The closer the coeficient is to 1, the more unequal is the caries distribution.
Results
A total of 792 children, 44.3% boys and 55.7% girls, were recruited for the study. The response rate was 90% of all children invited. Non-participation was mainly due to children who were absent on the day of the examination, or who forgot to bring the consent form signed by their parents.
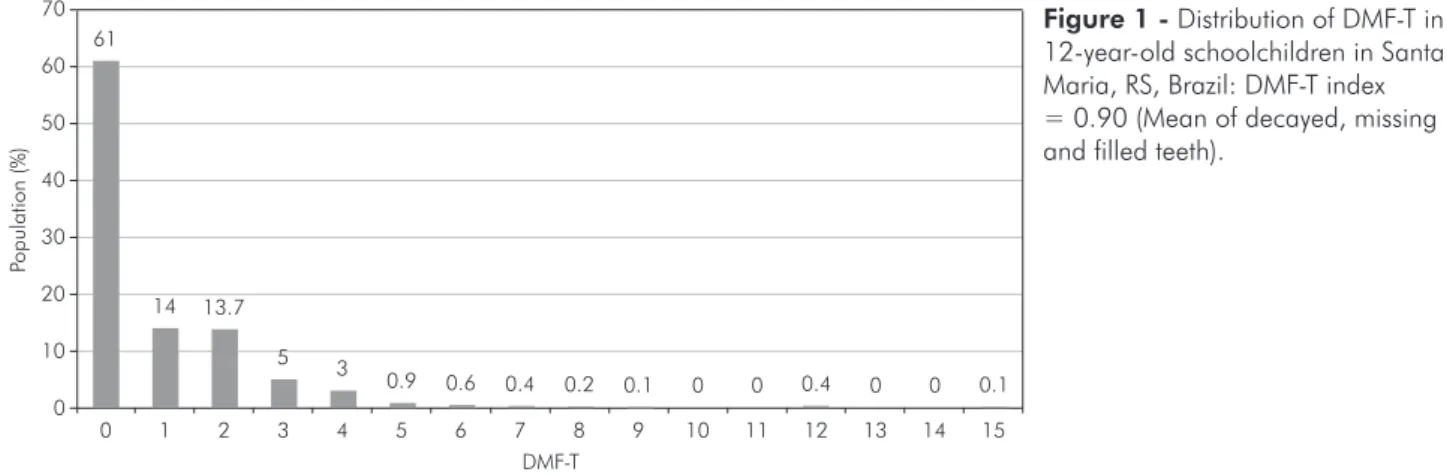
Figure 1 indicates the distribution of caries in the city of Santa Maria and shows the overall caries prevalence. The mean of decayed, missing, and illed teeth in the population was 0.9.
Figure 2 provides information on the measure-ment of inequality in the distribution of dental disease, by displaying the Lorenz curve for the ob-served sample and average DMF-T. A high inequal-ity in the distribution of dental caries was observed in this study. While the mean DMF-T was 0.9 (± SD 1.5), the SiC index was 2.5 (Figure 1), and the Gini coeficient was 0.7.
Prevalence of dental caries and dental caries ex-perience with associated factors are shown in table 1. The prevalence of dental caries was 39.27% (311 children of 792). After the adjustment for confound-ers, only household income remained associated
0 1 2 3 4 5 6 7 8 9 10
10 20 30 40 50
Po
pu
latio
n
(%)
DMF-T 60
70 61
14 13.7
5 3
0.9 0.6 0.4 0.2 0.1 0 0 0.4 0 0 0.1
11 12 13 14 15
0
with the outcome. Children from low-income house-holds had both higher prevalence of dental caries and higher mean DMF-T than other children.
Table 2 shows the association of possible predic-tors and the prevalence of severe dental caries (po-larization group – DMF-T > 2). Multivariate regres-sion models showed household income as a possible predictor for individuals with severe dental caries.
Discussion
This study found a high inequality in the distri-bution of dental caries. Moreover, socioeconomical-ly disadvantaged children had a higher prevalence of oral disease. In accordance with previous stud-ies, this study emphasizes that despite a decline in caries experience in most countries during the last decades, a high prevalence of disease is observed in some minorities.8,15 However, patterns of caries
dis-Table 1 - Prevalence of dental caries (DMF-T > 0) and dental caries experience (DMF-T) with associated factors.
Variables With dental caries (DMF-T > 0) DMF-T
N (%) PR (95%CI) PRadj (95%CI) Mean (± SD) RR (95%CI) RRadj (95%CI)
Gender 311 (39.27)
Male 128 (36.47) 1.00 0.77 (1.39) 1.00
Female 183 (41.50) 1.13 (0.95-1.35) 1.01 (1.75) 1.30 (1.02-1.67)**
Skin Colour 308 (39.34)*
White 230 (37.77) 1.00 0.84 (1.58) 1.00
Non-White 78 (44.83) 1.18 (0.97-1.44) 1.06 (1.60) 1.25 (0.95-1.63)
Income 263 (39.43)*
≥ 2 Brazilian min. wage 115 (33.72) 1.00 1.00 0.70 (1.33) 1.00 1.00
< 2 Brazilian min. wage 148 (45.40) 1.34 (1.11-1.62)** 1.27 (1.04 –1.55)** 1.14 (1.83) 1.63 (1.25-2.13)** 1.58 (1.21-2.06)**
Mother’s schooling 305 (39.92)*
≥ 8 years 110 (33.33) 1.00 1.00 0.78 (1.60) 1.00
< 8 years 195 (44.93) 1.34 (1.12-1.62)** 1.22 (0.99 -1.50) 1.01 (1.58) 1.29 (0.99-1.68)
Father’s schooling 292 (39.57)*
≥ 8 years 92 (33.70) 1.00 0.71 (1.39) 1.00 1.00
< 8 years 200 (43.01) 1.27 (1.04-1.55)** 1.04 (1.75) 1.44 (1.09-1.91)** 1.29 (0.96-1.72)
Mother’s occupation 305 (39.00)*
Employed 180 (36.22) 1.00 0.84 (1.62) 1.00
Unemployed 125 (43.86) 1.21 (1.01-1.44)** 0.99 (1.58) 1.17 (0.91-1.50)
Father’s occupation 294 (39.41)*
Employed 258 (39.63) 1.00 0.92 (1.59) 1.00
Unemployed 36 (37.89) 0.95 (0.72-1.25) 0.73 (1.20) 0.79 (0.56-1.13)
*values lower than 792 due to missing data (unanswered questions in the questionnaire). **p < 0.05. PR (95%CI) = Prevalence ratio – 95% Confidence interval; PRadj = Adjusted Prevalence Ratio; RR (95%CI) = Rate Ratio – 95% Confidence Interval; RRadj = Adjusted Rate Ratio – 95% Confidence Interval.
cu
mu
lativ
e
dis
e
as
e
cumulative population 0
0 0.25
0.25
0.5 0.5
0.75 0.75
1 1
tribution and polarization have not been thoroughly investigated in 12-year-old children, especially using both the SiC index and Gini coeficient and consid-ering their association with socioeconomic variables in a representative sample.
Notwithstanding the fact that the mean DMF-T of our study (Figure 1) was lower than that of Bra-zil (Mean DMF-T = 2.78),16 in general, we observed that deprivation gradients exist in caries experience and distribution. At lower levels of income, indi-viduals had poorer oral health. The health differ-ences across poverty-income groups were signiicant for all outcomes in the binary and adjusted analy-ses. Furthermore, an interesting discussion could be raised analyzing socioeconomic factors associated with children having no caries lesions. Further stud-ies should be conducted to focus these associations.
Our results demonstrate that both caries
experi-ence and prevalexperi-ence were associated with household income. The strength of this association was more prominent for the polarization group, which means that children from low socioeconomic background were more likely to form part of the polarization group. Different mechanisms to explain income ef-fects on health have been described.17,18 Individu-als at lower socioeconomic levels may be at higher risk of diseases, through stress-induced ill-behavior and physiological effects of chronic stress.19 Recent research suggests that health may also be affected by the distribution of income within society.20,21 Al-though we did not assess the potential multilevel ef-fect of income distribution and individual income, the relationship between income and health at the individual level is a suficient condition to produce health differences between populations.
Socioeconomic disparities in oral health
ob-Table 2 - Unadjusted and adjusted assessment of the association between the dependent variable “taking part of the polariza-tion group” and associated factors.
Variable Polarisation group (SiC Group)
SiC Group N (%) PR(95%CI) P PR adj.(95%CI) P
Gender 87 (11.27) ** **
Male 32 (9.12) 1.00
Female 55 (12.5) 1.36 (0.90-2.06) 0.13
Skin Colour 84 (10.73) ** **
White 60 (9.85) 1.00
Non-White 24 (13.80) 1.40 (0.89-2.17) 0.13
Income 79 (11.84)
≥ 2 Brazilian min. wage 26 (7.62) 1.00 1.00
< 2 Brazilian min. wage 53 (16.26) 2.13 (1.36-3.32) < 0.01 2.02 (1.29 – 2.18) < 0.01
Mother’s schooling 84 (11.00) **
≥ 8 years 29 (8.79) 1.00
< 8 years 55 (12.67) 1.44 (0.94-2.20) 0.09
Father’s schooling 83 (11.25)
≥ 8 years 22 (8.06) 1.00 1.00
< 8 years 61 (13.12) 1.62 (1.02-2.58) 0.04 1.36 (0.83 – 2.21) 0.83
Mother’s occupation 86 (11.00) ** **
Employed 52 (10.46) 1.00
Unemployed 34 (11.93) 1.14 (0.75-1.71) 0.52
Father’s occupation 82 (11.00)
Employed 75 (11.52) 1.00
served in this study corroborate results from one recent study with preschool children in the same city.22 Income inequality, relative poverty, and so-cial comparison have an impact on the individual’s psychological well-being.23,24,25 These factors can affect health through psychosocial/stress pathways, which exert a direct effect on health and an indirect effect through health-related behaviors.20 The same observations have been made for oral health.26 Risk behaviors lie in the causal pathway between socio-economic position and oral health and are more prevalent among socioeconomically disadvantaged groups.6 Therefore, a more comprehensive and de-tailed understanding of the underlying causes of oral health inequalities is needed to enable effective action to be taken in addressing this fundamental public health problem.6,27
In addition to documenting current levels of den-tal disease, this study also assessed the inequality of disease distribution among schoolchildren. We used the Gini coeficient9 and the SiC index7 to measure the disease distribution. The mean DMFT value alone does not represent the skewed distribution and may give the impression that the caries situa-tion is under control, while in reality several indi-viduals still have very high caries rates.7 A previous study demonstrated the utility of these indexes as in-terchangeable tools for measuring caries inequality
among Brazilians.4 In the present study, both indica-tors conirm the igures for high inequality in caries distribution, namely that the majority of caries oc-cur to a relatively small number of children. These inequalities in oral health found in our study have been described regarding social inequalities.23 These observations explain the demand of public health agencies that attention be paid to those segments of the population with higher levels of dental needs.
This study involved 792 schoolchildren in a rep-resentative sample of 12-year-old children enrolled in public schools in the city. The authorities of one particular school did not allow examiners to collect data from its students. However, nearly 85% of the children in this age group were enrolled in public schools. Moreover, our study observed that children from all social classes are enrolled in public schools in Santa Maria. Therefore, we cautiously consider generalizations of our results for all 12-year-old children living in the city.
Conclusion
Socioeconomic factors are strong predictors of inequality in caries distribution in Brazilian school-children. This is important from a public health per-spective mainly for the identiication of sections of the population that need to be more closely moni-tored for oral health.
References
1. Pereira SM, Tagliaferro EP, Ambrosano GM, Cortelazzi KL, Meneghim M de C, Pereira AC. Dental caries in 12-year-old schoolchildren and its relationship with socioeconomic and behavioural variables. Oral Health Prev Dent. 2007 Nov;5(4):299-306.
2. Traebert J, Guimaraes L do A, Durante EZ, Serratine AC. Low maternal schooling and severity of dental caries in Brazilian preschool children. Oral Health Prev Dent. 2009 Mar;7(1):39-45.
3. Sabbah W, Tsakos G, Chandola T, Sheiham A, Watt RG. Social gradients in oral and general health. J Dent Res. 2007 Oct;86(10):992-6.
4. Antunes JL, Narvai PC, Nugent ZJ. Measuring inequalities in the distribution of dental caries. Community Dent Oral Epidemiol. 2004 Feb;32(1):41-8.
5. Amaral MA, Nakama L, Conrado CA, Matsuo T. Dental car-ies in young male adults: prevalence, severity and associated factors. Braz Oral Res. 2005 Dec;19(4):249-55.
6. Sanders AE, Slade GD, Turrell G, John Spencer A, Marcenes W. The shape of the socioeconomic-oral health gradient: im-plications for theoretical explanations. Community Dent Oral Epidemiol. 2006 Aug;34(4):310-9.
7. Bratthall D. Introducing the Significant Caries Index together with a proposal for a new global oral health goal for 12-year-olds. Int Dent J. 2000 Dec;50(6):378-84.
8. Peres SH, de Carvalho FS, de Carvalho CP, Bastos JR, Lauris JR. [Polarization of dental caries in teen-agers in the southwest of the State of Sao Paulo, Brazil]. Cien Saude Colet. 2008;13 Suppl 22:2155-62. Portuguese.
10. Antunes JL, Jahn GM, de Camargo MA. Increasing inequali-ties in the distribution of dental caries in the Brazilian context in Finland. Community Dent Health. 2005 Jun;22(2):94-100. 11. Campus G, Solinas G, Maida C, Castiglia P. The ‘Significant
Caries Index’ (SiC): a critical approach. Oral Health Prev Dent. 2003 Sep;1(3):171-8.
12. World Health Organization. Oral health surveys: basic meth-ods, 4th ed. Geneva: World Health Organization; 1997.
13. World Health Organization. WHO oral health country/area profile program [homepage at internet]. Malmö University, Sweden: WHO; [cited 2010 Apr 6]. Available from: http:// www.whocollab.od.mah.se/sicdata.html.
14. Creedy J. The dynamics of inequality and poverty: comparing income distributions. Cheltenham (UK); Northampton (MA, USA): E.Elgar 1998.
15. Antunes JL, Frazao P, Narvai PC, Bispo CM, Pegoretti T. Spatial analysis to identify differentials in dental needs by area-based measures. Community Dent Oral Epidemiol. 2002 Apr;30(2):133-42.
16. Brasil. Ministério da Saúde. Secretaria de Atenção à Saúde. Departamento de Atenção Básica. Coordenação Nacional de Saúde Bucal. Projeto SB Brasil 2003—Condições de saúde bu-cal da população brasileira 2002–2003: resultados principais. Brasília: MS-CNSB; 2004.
17. Kawachi I, Kennedy BP. Income inequality and health: path-ways and mechanisms. Health Serv Res. 1999 Apr;34:215-27. 18. Lynch JW, Smith GD, Kaplan GA, House JS. Income inequal-ity and mortalinequal-ity: importance to health of individual income, psychosocial environment, or material conditions. BMJ. 2000 Apr 29;320(7243):1200-4.
19. Wilkinson RG. Socioeconomic determinants of health. Health inequalities: relative or absolute material standards? BMJ. 1997 Feb 22;314(7080):591-5.
20. Bernabe E, Sheiham A, Sabbah W. Income, income inequality, dental caries and dental care levels: an ecological study in rich countries. Caries Res. 2009;43(4):294-301.
21. Celeste RK, Nadanovsky P, Ponce de Leon A, Fritzell J. The individual and contextual pathways between oral health and income inequality in Brazilian adolescents and adults. Soc Sci Med. 2009 Nov;69(10):1468-75.
22. Piovesan C, Mendes FM, Ferreira FV, Guedes RS, Ardenghi TM. Socioeconomic inequalities in the distribution of dental caries in Brazilian preschool children. J Public Health Dent. 2010 Aug 23; [Epub ahead of print]. DOI: 10.1111/j.1752-7325.2010.00191.x
23. Pattussi MP, Marcenes W, Croucher R, Sheiham A. Social deprivation, income inequality, social cohesion and den-tal caries in Brazilian school children. Soc Sci Med. 2001 Oct;53(7):915-25.
24. Wilkinson RG, Pickett KE. The problems of relative depriva-tion: why some societies do better than other. Soc Sci Med. 2007 Nov;65(9):1965-78.
25. Wilkinson RG, Pickett KE. Income inequality and socio-economic gradients in mortality. Am J Public Health. 2008 Apr;98(4):699-704.
26. Downer MC, Drugan CS, Blinkhorn AS. Correlates of dental caries in 12-year-old children in Europe: a cross-sectional analysis. Community Dent Health. 2008 Jun;25(2):70-8. 27. Newton JT, Bower EJ. The social determinants of oral health: