UDC: 3.33 ISSN: 0013-3264
* Faculty of Economics, University of Belgrade, Serbia, E-mail: [email protected] ** Faculty of Economics, University of Belgrade, Serbia, E-mail: [email protected] JEL CLASSIFICATION: M31, L25
ABSTRACT: he aims of this study are to determine which variables are com-mon as brand management practices, how these variables afect a company’s busi-ness performance, and whether there are statistically signiicant diferences between companies in the sample in terms of indi-vidual elements of the Brand Management Practice (BMP) model. he research took place in Serbia, and comprised 118 manag-ers and specialists involved in marketing and brand management. Ater validating the proposed BMP model, we found a link between certain variables of the model and companies’ business performance. here are statistically signiicant diferences be-tween companies in terms of individual elements of brand management practice, and we identify three clusters: brand-guid-ed companies, emerging brand companies,
and brand-agnostic companies. hey difer from each other in terms of: brand-oriented approach, innovativeness, brand support activities, unique marketing ofers, mar-keting channel relationships, brand perfor-mance measurement, brand barriers, com-pany size, and speciic business area of a key-brand. hey also difer according to es-timated and actual business and inancial performance. he results are valuable for explaining the main drivers of good brand management practice and their efects on business performance in diferent industry sectors. he implications for managers of domestic companies are also discussed.
KEY WORDS: brand, brand barriers, brand management, business performance, inancial performance, Serbia
DOI:10.2298/EKA1608137V
Saša Veljković*
Djordje Kaličanin**
IMPROVING BUSINESS PERFORMANCE
1. INTRODUCTION
Business performance improvement is a very diicult task managers with iduciary obligation to maximize the wealth of their principles – equity owners - face on a daily basis. hat task is more complex than ever before because of the dynamic and mainly hostile environment. he value creation process implies mobilization of all tangible and intangible resources. One of the most important intangible resources relates to brands. Nowadays brands belong to a pool of resources that generate much of the company market value, but the inluence is not direct. It is lead by value creation for customers. Only customer-based brand equity can be ‘leveraged’ to raise the value of owners’ equity and inancial and business performance.
he aim of the paper is to investigate how and what kind of brand management practice afects business performance. We assume that business performance improvement can be seen as changes in market share and inancial results. Brand management practice is understood as a group of variables that are expressed and accepted through execution of the brand management process, consisting of the following phases: brand analysis and planning, implementation and brand measuring, and control. Diferent levels of sophistication in BMP allow us to divide companies into three clusters.
Although there has been similar research (Wong and Merrilees 2008; Kalicanin et al. 2015), this paper aims to widen the perspective of BMP, presenting a comprehensive brand management practice model that includes a broader view of company performance by surveying a wider base of managers and specialists connected with brand issues in the investigated companies. he paper irst presents the theoretical background and literature review, continues by describing the research methodology, and, inally, presents the results of the research with appropriate discussion. he last part of the paper is reserved for drawing conclusions, discussing the implications for domestic managers, and considering the research’s limitations and the direction of future research.
2. THEORETICAL BACKGROUND AND LITERATURE REVIEW
and inancial market. Hence, the importance of brands is multifaceted (Keller & Lehmann 2006).
Brands are considered an asset that generates revenue and increased value for a company (Narayan 2012). Srinivasan and Hanssens (2009) concluded that improvements in customer equity and brand equity are signiicantly related to irm value. A number of authors have investigated the relationship between brand management and a company’s inancial performance. In most studies this connection is proven. he inancial contribution of brands stems from two major groups of factors: factors associated with growth (attracting new consumers, barriers to competition, extension in the same or in new product categories, easier access to new markets) and factors that are associated with proitability (brand loyalty, premium prices, lower price elasticity, promotional eiciency, better negotiating position in marketing channels) (Veljkovic 2010, pp. 24-25). Some authors measure brand value in the traditional way: based on the monitoring of revenue premium, these authors conclude that the brand signiicantly contributes to irm performance (Ailawadi, Lehmann & Neslin 2003; Huang & Sarigollu 2014). Yeung and Ramasamy (2008) established the nexus between brand value and multiple proitability ratios and stock market performance measures.
Other authors also focus on the inancial contribution of brands and brand management. Strong brands can increase business value by accelerating and increasing the continuing value of cash low and reducing the cost of capital (Doyle 2000, pp. 229-232). his can be accomplished through: higher (premium) prices, higher volume growth, lower costs, and higher asset utilisation.
Conchar, Crask, & Zinkhan (2005) found that there was a connection between spending on advertising and promotion and the market value of an enterprise. In this way they demonstrated a link between the brand-building activities and inancial performance of a company. Verbeteeten and Vijn (2010) found association between some brand-equity measures and business-unit inancial performance.
Companies that make the brand central to their company’s strategy perform better inancially. Booz Allen Hamilton and Wolf Olin’s European survey of Marketing and Sales Oicers proved this claim. Research has shown that a brand-guided bank has a return on equity (ROE) of 19% as compared to the sector average of 8%, and that brand-guided companies in the industrial goods sector show an EBITDA margin of 17% compared to the average of 10% (Harter et al. 2005). Gromark and Melin (2011) showed in their study that 15% of the operating margin (EBITA) can be explained by the level of the brand orientation index. Research in Serbia has also shown linkages between brand orientation and inancial performance. he results indicate that brand orientation is signiicantly positively correlated with the EBITDA margin (Kalicanin et al. 2015).
Apart from the above criteria, company performance as a dependent variable of brand strength can be measured by sales, EBITDA, or market share (Herrmann, Henneberg, & Landwehr 2010). Munoz and Kumar (2004) classiied as inancial measures everything that shows the results of converting consumer behavior into a tangible economic value: market share, revenue, operating cash low, market capitalization, analyst ratings, and brand valuation. Some authors have distinguished between business-based measures of success (proitability, shareholders’ equity, market share) and consumer-based measures (brand association and perceived diferential advantage, added value). For the overall success of a company or brand, both criteria (business- and customer-related) are necessary and they are interrelated (de Chernatony et al. 1998). A more detailed analysis of customer-based brand equity is given at the end of this part of the paper.
Despite many conirmations of brand inluence on inancial performance, it should be emphasized that a brand’s impact is not the same everywhere. For instance, Knowles (2003) discovered that brands played a more important role in the success of food and beverage companies than they did in B-to-B technology companies. Mizik (2014) showed that the impact of brand asset on proitability difered in the restaurant sector, the high-tech sector, and the distribution/retail sector.
his evidence shows that, generally speaking, there is a link between strong brands and brand management practice and a company’s inancial performance.
value as a mediator between brand management and inancial performance, and this also needs to be investigated.
De Chernatony (2001) identiies ive key forces that afect the success of a brand: corporation (culture, internal communication, staf commitment, etc.), distributors (alignment of goals, balance of power), customers (and their decision-making process), competitors (strategic analysis of competing brands), and macro-environment (future political, economic, social, and technological change).
Lennartz and associates (2015) used multi-item scales to measure brand strength, brand associations, and performance perceptions of the four marketing-mix instruments (price, product, distribution, and communication). he research concluded that the brand associations (with two main factors: 1) sustainability & corporate governance, and 2) innovation & expertise) and the perceptions of product and distribution proved to be very relevant to the success of a B-to-B brand.
Gisip and Harun (2010) created a conceptual framework of antecedents and outcomes of brand management. hey started from the following brand management dimensions: brand-related organization and culture, brand knowledge and education, marketing capabilities, and innovation and brand orientation. he independent variables in the conceptual model were: top management emphasis on brand, corporate supportive resources, and market orientation. Brand management, as a mediating factor, connected independent variables and brand performance.
Wong and Merrilees (2007) conirmed that marketing strategy and innovation level inluence brand performance signiicantly. Empirical evidence was collected in Australia from a sample of 403 irms. hey also found that brand orientation moderates the path from marketing strategy to brand performance.
Another study found the existence of barriers to the successful implementation of brand strategy. hese barriers were related to functional silos. A typical example is the diferent focus of a sales director (monthly sales igures of Brand A) in relation to that of a marketing manager (broader brand equity measure) (Gyrd-Jones et al. 2013).
Burmann, Zeplin, and Riley (2009) highlighted brand commitment and brand citizenship behaviour as key determinants of the strength of a brand. According to these authors, brand commitment leads to brand citizenship behaviour, which leads to brand strength.
M’zungu, Merrilees, and Miller (2010) developed a three-stage model of brand management to build and protect brand equity. he phases of this model are: adopting a brand-oriented mindset, internal branding, and consistent brand delivery.
Some authors focus on brand accounting because much of the information required for brand management is quantitative. Brand valuation can be an essential element of brand management strategy, although this evaluation process includes a certain degree of subjectivity and estimation. Efective brand management requires monitoring of the operating proits of individual brands, and coordination among many areas in the organization (marketing, accounting, inance, sales, R&D). he accounting framework and common practice can be limiting factors in the evaluation of a brand and monitoring its performance, especially in developing countries (Otonkue et al. 2010).
For the purpose of the overall measuring of brand strength and its contribution to irm value, special attention is paid to the brand performance measurement system (Keller 2012, Rajagopal 2008). Brand performance measurement tools link brand management and the business performance of a irm. Brand performance measurement consists of brand metrics that allow measuring the efectiveness of brand-building activities in reference to brand investment and brand impact. A brand scorecard (a tool derived from the balanced scorecard) is proposed as a comprehensive way of looking at brand performance measures and their role in brand-led investment and marketing strategy (Rajagopal 2008).
psychology and information economics. Aacker started from the following four dimensions of CBBE: brand awareness, brand associations, perceived quality, and brand loyalty. De Chernatony and associates measured only three CBBE dimensions: brand loyalty, satisfaction, and reputation. Regardless of dimensions, the methods of measuring CBBE can be classiied as follows: direct methods (methods that seek to quantify brand equity directly) and indirect methods (methods that measure brand equity either through its demonstrable dimension or through price premium) (Christodoulides & de Chernatony 2010). As a result of analyzed responses received from practitioners and academics, Veloutsou, Christodoulides, and de Chernatony (2013) ofered the following classiication of measures of CBBE: consumers’ understanding of brand characteristics, consumers’ evaluation of the brand, consumers’ afective response towards the brand, and consumers’ behaviour towards the brand.
3. OVERVIEW OF RESEARCH METHODOLOGY
he main objectives of this paper are as follows:
• to determine which factors are an integral part of brand management practice; • to determine how these factors afect the market and inancial results of a
company;
• to determine whether there are statistically signiicant diferences between the brand-driven company and other companies in terms of individual elements of brand management practice;
• if we can identify clusters, to then analyse how they are diferent from each other in terms of company characteristics, the characteristics of the brand, the characteristics of the respondents, as well as how they difer according to estimated and actual business performance.
Based on the overall objective of the study, described above, we have deined our main research questions as follows:
• RQ1: Which variables best explain the company’s brand management practice? • RQ2: Which clusters in terms of brand management practice can be extracted?
strategic brand management “involves the design and implementation of marketing programs and activities to build, measure, and manage brand equity”.
According to Edwards and Bagozzi (2000), constructs are attempts to describe real phenomena and “exist apart from the awareness and interpretation of the researcher and the persons under study”. When creating a research model it is very important to identify and estimate models that specify relationships between constructs and measures. First of all, we should consider the following: a construct and a measure must be distinct; they must also co-vary; temporal precedence must be determined (how changes in the construct afect change in the measure in the temporal dimension); rival causal explanations should be eliminated (of the presumed causal relationship between a construct and a measure) (Edwards and Bagozzi 2000).
Based on these considerations, we developed the basis of the BMP model.
Common phases of the scale development process are: conceptualization, development of measures, model speciication, scale evaluation and reinement, validation, and norm development. One of the more important steps is generating items to represent the construct. hese items may come from: previous theoretical and empirical research on the focal construct, reviews of the literature, suggestions from brand management experts, interviews or focus group discussions, and an examination of other measures of the construct that already exist (MacKenzie et al. 2011).
A list of statements was designed to explore companies’ brand management practice. Respondents were asked to report their attitudes and opinions towards brand management practice and related topics. An advantage of the selected survey method was that managers were not able to skip questions. Attitudes and opinions were examined using a seven-point Likert scale. Most statements were deined taking into account previously conducted research in this area (Wong and Merrilees 2008; Wong and Merrilees 2007; Tuominen et al. 2009; Kalicanin et al. 2015). he questionnaire was then pre-tested, the main objective of which was to determine how the statements would be understood. he research was carried out ater adopting the suggestions of experts who participated in the pre-testing.
and early July 2014 and involved managers and brands that were doing business in the Republic of Serbia. A web-based questionnaire was used, as an eicient method of collecting data. According to a survey of the Statistical Oice of the Republic of Serbia, almost 100% of Serbian businesses had an internet connection in 2014 (Statistical Oice of the Republic of Serbia, 2014). E-mail and internet are routinely used for business and personal communication, so there were no restrictions regarding the selected research method.
he basis for the research was the partner databases from a not-for-proit, international organization that develops and maintains standards across multiple sectors in Serbia. Surveys were sent to the relevant persons in the companies. Missing contact data were taken from oicial company websites. We sent 768 requests for participation in the survey and received 130 responses. he response rate was about 17%. he questionnaire contained questions relating to the company name and the name of the brand, and it was made clear to managers that these data would not be publicized.
A speciic individual brand could have only one answer in the database, so multiple answers for the same brand were eliminated. Ater the elimination of multiple responses a total of 118 valid responses were included in further processing and analysis. Respondents were requested to indicate the extent to which they agreed or disagreed with the statement regarding practices of the company in which they were employed and to express their personal beliefs about the branding and brand management.
General socio-demographic characteristics of the respondents were collected at the end of the interview, referring to gender, age, education level, education proile, and respondents’ position in the company. Company size was observed according to Serbian Business Registers Agency classiication. he questions used to describe the company concerned share of exports in total sales, general activity, origin of company ownership, and length of business operations in Serbia. Finally, we asked questions regarding the business area of a key brand and origin of a key brand in order to be able to form a better description of speciic brands.
Data analysis was conducted using SPSS sotware version 20.
A total of 38 statements related to brand management practices, barriers to brand management implementation, and the efects of the brand on consumers and business results. Other statements related to issues that are not relevant to the present study (statements concerning the treatment and use of assets of the brand, praxis of category management, private labels, etc.).
he proposed research model is based on three components: the latent variables of brand management practice (BMP), barriers to their implementation, and business and inancial performance. A total of 27 individual statements were related to brand management practice, an additional 6 related to barriers to implementation, and 5 statements examined indicators of business success.
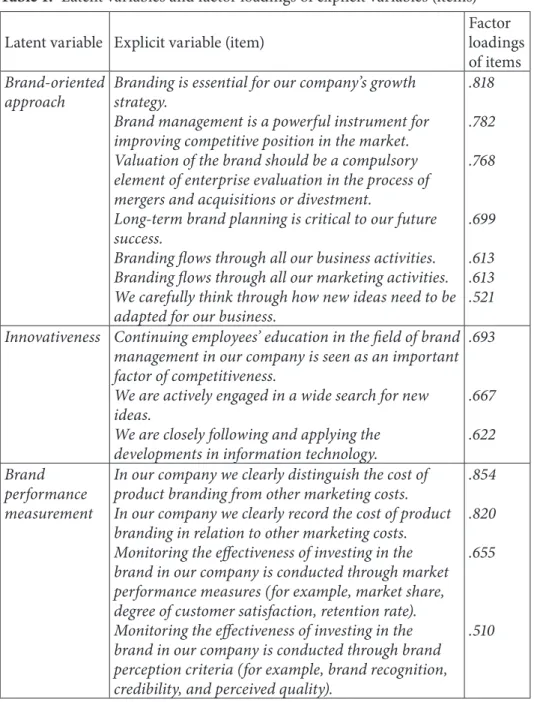
Factor analysis, using principal component method and varimax rotation, was conducted in order to obtain the latent variables of BMP. Hair et al. (2006) and Gupta & Adil (2014–2015) suggest that factors with Eigen values greater than 1.0 and factor loadings that are equal to or greater than 0.50 should be retained. Factor analysis singled out six factors (with Eigen values greater than 1.0) as an optimal sorting of the 27 presented statements. hose factors explained 63.085% of total variability in the original data set, which can be characterized as a signiicant level.
By taking the value of 0.50 as the lower limit of factor loadings, two statements were excluded from further analysis (Uses of inancial metrics as the basis for monitoring the efectiveness of brand investment and Brand reputation in marketing channels). he six featured factors and the statements comprising each of the factors with factor loadings are given in Table 1.
he irst factor represents personal and organisational commitment and orientation towards brand and brand management. A latent variable containing the same or similar assertions has been named ‘brand management commitment’ (Burmann et al. 2009), ‘brand orientation’ (Wong and Merrilees 2007; Wong and Merrilees 2008; Tuominen et al. 2009), or ‘brand approach’ (Gromark and Melin 2011). In this paper we use the term ‘brand-oriented approach’.
he third factor represents the Brand performance measurement system. It consists of brand metrics and enables linking brand management and business performance (Keller 2012, Rajagopal 2008).
he fourth factor points to the need to build good relations in marketing channels, as an essential element of the implementation phase. Several authors indicate that cooperation in marketing channels is a precondition for the successful implementation of brand management (Webster 2000; Gisip and Harun 2013; Martens and Hilbert 2011). Based on the above, a latent variable is named Marketing channel relationships.
Some authors emphasize the importance of the legal aspects of branding (Gromark and Mellin, 2011). he importance of monitoring the performance of the company has already been pointed out. he importance of innovation is also emphasized, especially technological innovation. It is necessary that an appropriate support system exists in the company in order to carry out all of these activities. he ith latent variable of the diverse support activities is named Brand support activities.
Table 1: Latent variables and factor loadings of explicit variables (items)
Latent variable Explicit variable (item)
Factor loadings of items Brand-oriented
approach
Branding is essential for our company’s growth strategy.
Brand management is a powerful instrument for improving competitive position in the market. Valuation of the brand should be a compulsory element of enterprise evaluation in the process of mergers and acquisitions or divestment.
Long-term brand planning is critical to our future success.
Branding lows through all our business activities. Branding lows through all our marketing activities. We carefully think through how new ideas need to be adapted for our business.
.818
.782
.768
.699
.613 .613 .521
Innovativeness Continuing employees’ education in the ield of brand management in our company is seen as an important factor of competitiveness.
We are actively engaged in a wide search for new ideas.
We are closely following and applying the developments in information technology.
.693
.667
.622
Brand performance measurement
In our company we clearly distinguish the cost of product branding from other marketing costs. In our company we clearly record the cost of product branding in relation to other marketing costs. Monitoring the efectiveness of investing in the brand in our company is conducted through market performance measures (for example, market share, degree of customer satisfaction, retention rate). Monitoring the efectiveness of investing in the brand in our company is conducted through brand perception criteria (for example, brand recognition, credibility, and perceived quality).
.854
.820
.655
Marketing channel relationships
here is a great low of information from retailers/ distributors to our company about the brand and the category in which we operate.
here is a great low of information from our
company to the retailers/distributors about the brand and the category in which we operate.
he perceived quality (assigned to the brand) increases customer loyalty, which in turn increases sales revenue.
.803
.701
.532
Brand support activities
Company performance is regularly monitored. We have a good system to identify, select, and implement technological innovations.
All key brands owned by the company have legal protection (they are registered with the Intellectual Property Oice).
.768 .585
.551
Unique marketing ofers
Brand value depends on the premium price that a product under the said brand can provide.
Compared with competitors, we have a high rate of product/service innovation.
Our advertising/promotions create the desired brand image in the market.
Our products/services are diferent from those of competitors.
In comparison to competitors, we are technologically advanced.
.690
.553
.553
.552
.528
Source: he authors’ calculation
importance in our company; Employees in our company do not understand the importance of branding strategies; We do not have graphic standards books for all the brands owned by the company; In general, brand management will lose its importance in business.
he assumption is that all the variables of the BMP model have an impact on business performance.
A large number of authors have pointed out the beneits of a strong brand and good implementation of brand management, and their inluence on inancial results. EBIT, EBITA, EBITDA, and EBITDA margin are used as criteria for inancial performance (Gromark and Melin 2011; Ailawadi et al. 2001; Verbeten and Vijn 2010; Harter et al. 2005; Kalicanin et al. 2015; Herrmann, Henneberg, & Landwehr 2010). In certain cases, authors have used respondents’ answers to survey statements as a measure of inancial results (Wong and Merrilees 2008).
Some authors have diferentiated between business- and customer-related measures of success (de Chernatony et al. 1998). Other authors mainly show the impact of brand management on brand performance or customer-based brand equity (CBBE) (Lee et al. 2008, Gisip and Harun 2010; Wong and Merrilees 2007; Christodoulides and de Chernatony 2010; Veloutsou et al. 2013). Wong and Merrilees (2008) found that brand performance mediates between brand orientation and inancial results. CBBE has been used in several studies as the manifestation of market brand position in the minds of inal consumers (Washburn & Plank 2002; de Chernatony et al. 2004; Pappu et al. 2005).
To investigate businesses’ inancial performance and their brand management practice we used EBITDA margin data from the business portal of CUBE Risk Management Solutions, a company that provides business information and credit risk services (http://cube.rs). In addition to the objective criteria of the EBITDA margin (calculated from oicial inancial statements), respondents evaluated their company’s business performance on the basis of changes in market share and inancial results in 2014 compared to 2013. Since these assessments of business performance were based on internal and/or unoicial reports, this variable is called Changes in business performance. Finally, as the moderating factor and the basis for achieving good business results in the future, we specially highlight Customer-based brand equity.
Table 2: Criteria for financial and business performance used in the present study Customer-based brand equity – CBBE
(based on the responses of managers on a seven-point Likert scale)
• Our irm has built a strong brand awareness in the target market.
• Our company has built a good brand reputation among consumers.
• Our irm has built a strong customer brand loyalty. Changes in business performance
(based on the responses of managers on a seven-point Likert scale)
• he market share of our company during the past 12 months has increased.
• he overall inancial results of our company during the past 12 months have improved.
Financial performance
(calculated from oicial inancial statements)
• EBITDA margin
Cronbach’s alpha coeicient method is the indicator most commonly used to measure internal consistency and therefore reliability of a questionnaire, and is a suitable method for Likert scale items. Some authors claim that the sample size should be more than 50 in reliability analysis applications, while others say that sample size is not important for Cronbach’s alpha (Ercan et al. 2007). In our study the values for Cronbach’s alpha were above the recommended limit of 0.7 for most of the variables. he coeicient values for the respective variables were as follows: Brand-oriented approach (0.86); Innovativeness (0.74); Brand performance measurement (0.82); Marketing channel relationships (0.72); Brand-support activities (0.58); Unique marketing ofers (0.67); Brand barriers (0.77); CBBE (0.90); Changes in business performance (0.74).
hese coeicient values are in line with recommendations in the literature (Peterson 1994), taking into account the two variables with a slightly lower level.
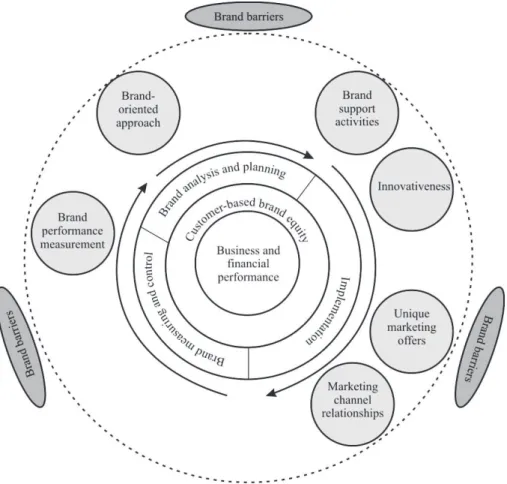
Figure 1: Proposed research model
Source: Authors’ model based on the literature review and previous research.
Aware of the fact that in addition to these variables there are other variables that can afect the good practice of brand management, we allowed for the possibility of extending the presented BMP model.
4. RESEARCH RESULTS AND DISCUSSIONS
Sample characteristics
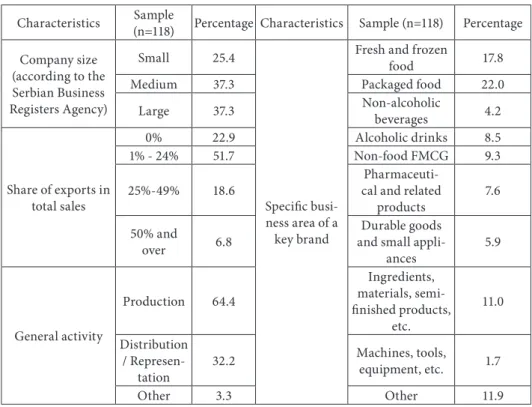
Republic of Serbia. he sample is not statistically representative, but the variety of brands, companies, and industries provides a good basis for drawing conclusions. Table 3 presents the complete sample characteristics. 25.4% of responses were from small businesses, 37.3% from medium-sized businesses, and 37.3% from large companies. Export companies accounted for 77% of the sample. Most brands belonged to the Fast-moving consumer goods (FMCG) sector (packaged and fresh food, non-alcoholic and alcoholic drinks). Manufacturing accounted for almost two-thirds of the sample. 63.6% of the companies were Serbian-owned or majority Serbian-owned. 56% of brands in the sample were of domestic origin. he company positions of the respondents were diverse, although most of them were involved in marketing activities (Marketing Director, Marketing Manager, Brand Manager, and Product Manager). 47.5% of the respondents were female, 82.1% were aged between 30 and 49, 21.1% had completed a Masters degree or PhD, and 72.0% had a BSc degree. Respondents’ qualiication proiles were predominantly in the area of economics and business studies (71.2%).
Table 3: Sample characteristics
Characteristics Sample
(n=118) Percentage Characteristics Sample (n=118) Percentage
Company size (according to the Serbian Business Registers Agency)
Small 25.4
Speciic busi-ness area of a
key brand
Fresh and frozen
food 17.8
Medium 37.3 Packaged food 22.0
Large 37.3 Non-alcoholic
beverages 4.2
Share of exports in total sales
0% 22.9 Alcoholic drinks 8.5
1% - 24% 51.7 Non-food FMCG 9.3
25%-49% 18.6
Pharmaceuti-cal and related
products
7.6
50% and
over 6.8
Durable goods and small
appli-ances 5.9 General activity Production 64.4 Ingredients, materials, semi-inished products, etc. 11.0 Distribution / Represen-tation
32.2 Machines, tools,
equipment, etc. 1.7
Characteristics Sample
(n=118) Percentage Characteristics Sample (n=118) Percentage
Origin of company ownership
Foreign 31.4
Origin of a key brand
Foreign 43.2
Mainly foreign (over 50%)
5.1 Domestic 56.8
Mainly domestic (over 50%) 6.8 Respondent’s position
Financial Director 4.2
Domestic 56.8 Commercial
Director 11.0
Years the company has been operating
in Serbia
Less than 10
years 22.0 Director General 10.2
10-20 years 33.1 Marketing
Direc-tor 19.5
20-29 years 12.7 Marketing
Man-ager 18.6
30-39 years 3.4 Brand Manager 11.9
40 years and
over 28.8 Product manager 3.4
Respondents’ age group
Less then 30
years 12.8 Category manager 4.2
30-39 years 46.2 Others 16.9
40-49 years 35.9
Respondent’s level of
educa-tion
Secondary school qualiications 1.7
50-59 years 3.4
Two-year post-secondary school
qualiications or BA
5.1
60 years and
over 1.7 Bachelor’s degree (BSc) 72.0 Respondent’s quali-ication proile Economics
and Business 71.2 Master, PhD 21.1
Technical - Engineer or similar 16.1 Respondent’s gender Male 52.5
Other 12.7 Female 47.5
Source: Authors’ calculation
Exploratory analysis
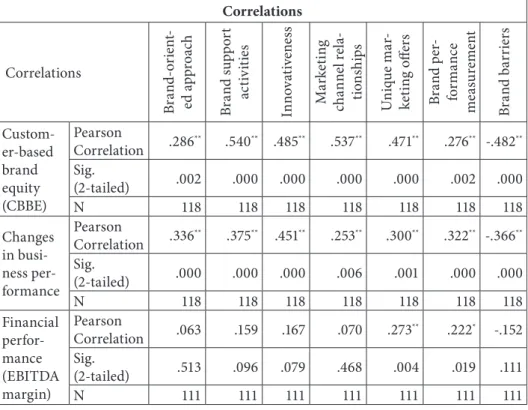
Our research was exploratory in nature. From the theoretical point of view, it aimed to elaborate the main factors inluencing brand management practice and the correlation of BMP with the business and inancial performance of companies operating in Serbia. Table 4 shows the correlation between selected performance measures (inancial performance, changes in business performance, and customer-based brand equity) and individual variables of the BMP model. Our BMP model was based on the following latent variables: Brand-oriented approach, Innovativeness; Brand performance measurement, Marketing channel relationships, Brand-support activities, and Unique marketing ofers. As an additional variable we also studied Brand barriers. Correlation is measured by Pearson’s coeicient.
Table 4: Correlation between selected performance measures and individual variables of the BMP model
Correlations Correlations B ra nd-o ri en t-ed ap p ro ac h Br an d s up p o rt ac ti v iti es In no vat iv ene ss M ar k et ing ch an n el r el a-ti on sh ip s Un iq u e m ar -k et ing o fe rs B ra nd p er -fo rm anc e me as u re me n t Br an d b ar rie rs Custom-er-based brand equity (CBBE) Pearson Correlation .286
** .540** .485** .537** .471** .276** -.482**
Sig.
(2-tailed) .002 .000 .000 .000 .000 .002 .000
N 118 118 118 118 118 118 118
Changes in busi-ness per-formance Pearson Correlation .336
** .375** .451** .253** .300** .322** -.366**
Sig.
(2-tailed) .000 .000 .000 .006 .001 .000 .000
N 118 118 118 118 118 118 118
Financial perfor-mance (EBITDA margin) Pearson
Correlation .063 .159 .167 .070 .273
** .222* -.152
Sig.
(2-tailed) .513 .096 .079 .468 .004 .019 .111
N 111 111 111 111 111 111 111
**. Correlation is signiicant at the 0.01 level (2-tailed). *. Correlation is signiicant at the 0.05 level (2-tailed).
Remark: In seven cases, data about EBITDA margin were not available.
he correlation was statistically signiicant at the 0.01 level in the following cases:
• Unique marketing ofers with all three performance measures, and
• Brand-oriented approach, Brand support activities, Innovativeness, Marketing channel relationships, Brand performance measurement, and Brand barriers with two performance measures (Changes in business performance and CBBE).
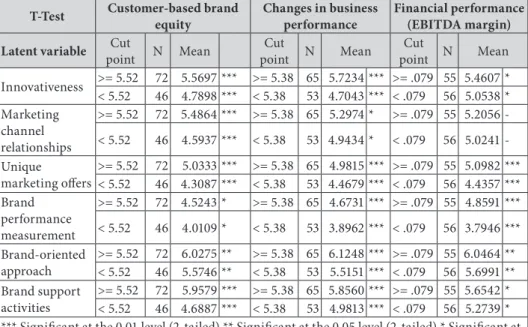
he possibility of using the latent variable of BMP models was initially tested by T-test statistics. For most of the latent variables the T-test showed statistically signiicant diferences at 0.01 levels. In all other cases but one, statistical signiicance was also established, but this time at the 0.05 or 0.1 level. Detailed results of the T-test statistics are given in Table 5.
Table 5: Determining the possibility of using the latent variable of BMP models by T-test statistics
T-Test Customer-based brand equity
Changes in business performance
Financial performance (EBITDA margin)
Latent variable Cut
point N Mean
Cut
point N Mean
Cut
point N Mean
Innovativeness >= 5.52 72 5.5697 *** >= 5.38 65 5.7234 *** >= .079 55 5.4607 * < 5.52 46 4.7898 *** < 5.38 53 4.7043 *** < .079 56 5.0538 * Marketing
channel relationships
>= 5.52 72 5.4864 *** >= 5.38 65 5.2974 * >= .079 55 5.2056
-< 5.52 46 4.5937 *** < 5.38 53 4.9434 * < .079 56 5.0241
-Unique marketing ofers
>= 5.52 72 5.0333 *** >= 5.38 65 4.9815 *** >= .079 55 5.0982 *** < 5.52 46 4.3087 *** < 5.38 53 4.4679 *** < .079 56 4.4357 *** Brand
performance measurement
>= 5.52 72 4.5243 * >= 5.38 65 4.6731 *** >= .079 55 4.8591 ***
< 5.52 46 4.0109 * < 5.38 53 3.8962 *** < .079 56 3.7946 ***
Brand-oriented approach
>= 5.52 72 6.0275 ** >= 5.38 65 6.1248 *** >= .079 55 6.0464 ** < 5.52 46 5.5746 ** < 5.38 53 5.5151 *** < .079 56 5.6991 ** Brand support
activities
>= 5.52 72 5.9579 *** >= 5.38 65 5.8560 *** >= .079 55 5.6542 * < 5.52 46 4.6887 *** < 5.38 53 4.9813 *** < .079 56 5.2739 * *** Signiicant at the 0.01 level (2-tailed) ** Signiicant at the 0.05 level (2-tailed) * Signiicant at the 0.1 level (2-tailed)
Remark: In seven cases, data about EBITDA margin were not available.
Source: Authors’ calculation
Regression analysis
A multiple regression analysis was performed to explore if the independent variables of the BMP model afected the dependant variable (CBBE). he objective was to determine whether Brand-oriented approach, Brand support activities, Innovativeness, Unique marketing ofers, Marketing channel relationships and Brand performance measurement could explain a signiicant part of the variability of CBBE as a dependant variable.
In the structural element of the model the regression parameters explaining CBBE indicated that 4 out of 6 independent variables had a signiicant inluence on the dependent variable (p<0.1). Multiple regression accounted for 45.3% of the variability as indexed by the R squared statistic and 43.4% indexed by the adjusted R squared statistic. he Model Summary is shown in Table 6.
Table 6: Relationship of latent variables to CBBE – Model Summary Model Summary
Model R R Square Adjusted R Square Std. Error of the Estimate
1 .540a .292 .286 1.08363
2 .631b .398 .387 1.00350
3 .661c .437 .422 .97480
4 .673d .453 .434 .96490
a. Predictors: (Constant), Brand support activities
b. Predictors: (Constant), Brand support activities, Marketing channel relationships c. Predictors: (Constant), Brand support activities, Marketing channel relationships,
Innovativeness
d. Predictors: (Constant), Brand support activities, Marketing channel relationships, Innovativeness, Unique marketing ofers
Source: he authors’ calculation
he regression equation for predicting the Customer-based brand equity is:
ŷ= 0.466 + 0.292x1 + 0.313x2 + 0.187x3 + 0.181x4 x1 – Brand support activities
x2 – Marketing channel relationships x3 – Innovativeness
he conducted multiple regression analysis conirmed that four independent variables afected CBBE as the dependent variable. herefore those variables were used as the basis for segmentation of companies from the sample.
Cluster analysis
Consistent with the established research goals, the next challenge was to determine whether brand-oriented companies and non-brand-oriented companies difered in performance.
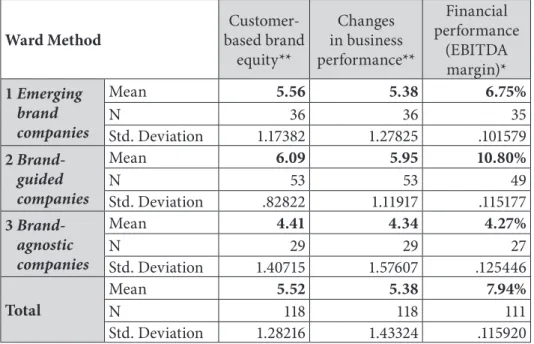
he sample was segmented in order to verify the existence of a homogeneous group of respondents in terms of brand management practice and indicated business performance. For this purpose, cluster analysis was applied, as a technique commonly used in similar studies, and Hierarchical Cluster Analysis (Ward’s Method) was performed to obtain segments/clusters (Zednik & Strebinger 2008; Wallace et al. 2013; Kao & Hung 2005). he BMP model variables were used to divide the sample into clusters. A division into three clusters was optimal, given the sample size, homogeneity within clusters (segments), and heterogeneity between clusters (segments).
Using terminology similar to that used in the Booz Allen Hamilton and Wolf Olins study (Harter et al. 2005), the clusters were deined as follows:
• Brand-guided companies (companies with brands that had the highest scores in the sample concerning all of the individual latent variable models);
• Emerging brand companies (companies with brands that had average scores in the sample concerning all of the individual latent variable models);
• Brand-agnostic companies (companies with brands that had the lowest scores in the sample concerning all of the individual latent variable models).
Table 7: Three categories of organizations concerning the implementation of brand management / business performance measures results of selected clusters
Ward Method
Customer-based brand
equity**
Changes in business performance**
Financial performance
(EBITDA margin)* 1 Emerging
brand companies
Mean 5.56 5.38 6.75%
N 36 36 35
Std. Deviation 1.17382 1.27825 .101579
2 Brand-guided companies
Mean 6.09 5.95 10.80%
N 53 53 49
Std. Deviation .82822 1.11917 .115177
3 Brand-agnostic companies
Mean 4.41 4.34 4.27%
N 29 29 27
Std. Deviation 1.40715 1.57607 .125446
Total
Mean 5.52 5.38 7.94%
N 118 118 111
Std. Deviation 1.28216 1.43324 .115920
Signiicant at the 0.01 level** Signiicant at the 0.05 level*
Source: Authors’ calculation
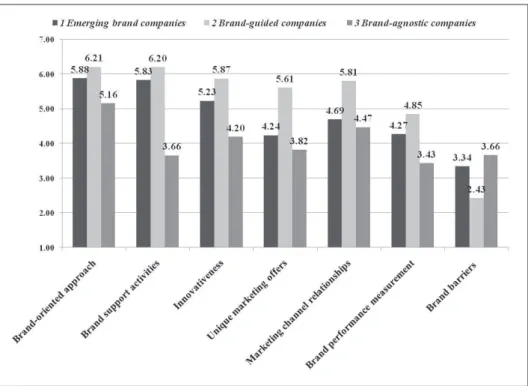
Figure 2: The differences between the segments reported in the value of the latent variables of BMP models
Source: Authors’ calculation
We also examined the diferences between segments in other characteristics. he focus was on a key set of three characteristics: companies’ characteristics, key-brand characteristics, and socio-demographic characteristics of the respondents. More detailed description of each of the segments is presented below.
Cluster 1: Emerging brand companies
Members of Cluster 1 had average or below average values for all other observed characteristics.
Cluster 2: Brand-guided companies.
Cluster 2 (45% of the sample) was truly interested in brand management. Members of this cluster had the most positive attitude toward all claims and variables related to the BMP model. his segment had the largest number of foreign-owned companies (45.3%). Over half (52.8%) of the key brands of companies in Cluster 2 are of foreign origin. Respondents from companies that belonged to Cluster 2 were the youngest (70% of respondents were less than 40 years-old) and most educated in the sample. Most of the brands belonged to the groups Pharmaceutical and related products and FMCG, especially Packaged food. In terms of size, Cluster 2 has the most medium-sized enterprises (41.5%). As already mentioned, companies in Cluster 2 had signiicantly better average performance than companies from other segments. his applies particularly to the EBITDA margin.
Cluster 3: Brand-agnostic companies.
Members of Cluster 3 (25% of the sample) were antagonistic toward brand management or did not know how to appropriately apply brand management in their business operations. he groups of older respondents were overrepresented in this cluster (57.1% over 40 years-old). Respondents in Cluster 3 had the lowest level of formal education. Members of this segment were predominantly domestic-owned companies (72.4%) and had the weakest business performance in the sample. Almost 80% of companies in this segment are small. In most cases these companies manage domestic brands.
5. PRACTICAL IMPLICATIONS, LIMITATIONS, AND FUTURE RESEARCH
he conclusions are derived from the results obtained by primary research conducted in Serbia in 2014. he results presented in this study are relevant to a wide group of companies and stakeholders in Serbia: producers, distributors, retailers, and policymakers. Despite some limitations, the sample size allows us to make recommendations based on the managers’ answers concerning brand management practice.
Brand management practice can be analysed considering the following dimensions: brand-oriented approach, brand support activities, innovativeness, unique marketing ofers, marketing channel relationships, brand performance measurement. hese dimensions (variables) were expressed through three stages in the brand management process: brand analysis and planning, brand implementation, and brand measuring and control. Brand barriers were identiied as a variable with a negative efect on all other variables in the model, and consequently as a variable with a negative efect on business performance.
here was a clear nexus between brand management practice, consumer-based brand equity, changes in business performance, and the inancial performance (EBITDA margin) of the surveyed brands and companies. All the variables in the presented BMP model (except brand barriers) were positively correlated with all of the analysed business performance. In analysing the impact on CBBE, regression analysis singled out four factors (variables): brand support activities, innovativeness, unique marketing ofers, and marketing channel relationships. he indings are logical, because all four variables belong to the implementation phase of the brand management process, which has the greatest impact on business results and in particular on customer-based brand equity.
here were statistically signiicant diferences between the brand-driven companies and other companies in terms of individual elements of brand management practice, and we identiied three clusters: brand-guided companies, emerging brand companies, and brand-agnostic companies. Other characteristics difered in terms of the speciic business area of a key-brand and company size. hey also difered according to estimated and actual business and inancial performance.
primarily related to the particular improvement of each individual variable of good brand management practice.
he pillars of excellent brand management practice leading to performance improvement are:
• organizational and personal commitment and orientation to the brand and brand management;
• providing appropriate supporting activities for the implementation of the brand management process;
• a strong focus on innovation and improving the innovation process;
• efective planning and eicient implementation of the individual instruments of marketing programmes;
• uniqueness of marketing oferings;
• building good relationships in marketing channels;
• permanent control of all business processes, and creation of a comprehensive brand-performance measurement system;
• the elimination/reduction of organizational and personal brand barriers.
To achieve this, it is necessary that the company has adequate inancial, human, and material resources, and also the necessary expertise, commitment, and employee skills. Partnership in marketing channels and cooperation with all other stakeholders are also indispensable prerequisites for success.
he research faced some limitations. First of all, the sample was not representative nationwide. Secondly, we are aware that the respondents could be giving ‘socially desirable’ answers that do not relect their real attitude or real conditions in their companies. Also, we used short-term performance criteria, such as the EBITDA margin. he reason for this is Serbia’s underdeveloped inancial market and the inaccessibility of inancial records about the surveyed companies and brands. Additionally, the survey was conducted in a period of economic crisis, generally characterized by a decline in investments, when margins are at a low level, and when companies from diferent industries are not all afected to the same extent. However, despite these limitations, our study provides evidence of the possibilities and efects of good brand management practice and recommendations for managers responsible for the further development of brands and companies.
• exploring the inluence of other variables that can afect good brand management practice, which could lead to extending the presented BMP model;
• further veriication and validation of the scale for each of the latent variables in BMP models;
• examination of the impact of BMP model variables on other performance measures (Return on assets - ROA, Economic Value Added – EVA, brand proitability, brand capitalization, etc);
• analysis of changes in the relationship between variables and business performance in a longer time frame;
• exploring opinions of managers in leading Serbian retailers about BMPs in their companies and their impact on business performance.
REFERENCES
Ailawadi, K.L., Lehmann, D.R., & Neslin, S.A. (2001). Revenue premium as an outcome measure of brand equity. Journal of Marketing, 67 (October), pp. 1-17.
Burmann, C., Zeplin, S. & Riley, N. (2009). Key determinants of internal brand management success: An exploratory empirical analysis. Journal of Brand Management, Vol. 16, No. 4, pp. 264 – 284
Business portal of CUBE Risk Management Solutions, retrieved from: http://cube.rs.
Christodoulides, G. & de Chernatony, L. (2010). Consumer-based brand equity conceptualisation and measurement: A literature review. International Journal of Market Research, Vol. 52 Issue 1, pp. 43-66.
Conchar, M.P., Melvin, R.C. & Zinkhan, G.M. (2005). Market valuation models of the efect of advertising and promotional spending: A review and meta-analysis. Journal of the Academy of Marketing Science, 33 (4), pp. 445-460.
de Chematony, L., Dall Olmo Riley, F. & Harris, F. (1998). Criteria to Assess Brand Success. Journal of Marketing Management, 14, pp. 765-781.
de Chernatony, L. (2001). A model for strategically building brands. Journal of Brand Management, 9 (1), pp. 32-44.
de Chernatony, L., Harris, F.J. & Christodoulides, G. (2004). Developing a brand performance measure for inancial services brands. Services Industries Journal, Vol. 24, No. 2, pp. 15-33.
Doyle, P. (2000). Value-Based Marketing: Marketing Strategies for Corporate Growth and Shareholder Value. John Wiley & Sons, Ltd. Chichester.
Edwards, J. & Bagozzi, R. (2000). On the Nature and Direction of Relationships Between Constructs and Measures. Psychological Methods, Vol. 5, No. 2, pp. 155-174.
Ercan, I., Yazici, B., Sigirli, D., Ediz, B. & Kan, I. (2007). Examining Cronbach Alpha, heta, Omega Reliability Coeicients According to Sample Size. Journal of Modern Applied Statistical Methods, Vol. 6: Iss. 1, Article 27, pp. 291-303.
Gisip, I.A. & Harun, A. (2013). Antecedents and Outcomes of Brand Management from the Perspective of Resource Based View (RBV) heory. Mediterranean Journal of Social Sciences, Vol. 4 No 10, pp. 432-438.
Gromark, J. & Melin. F. (2011). he underlying dimensions of brand orientation and its impact on inancial performance. Journal of Brand Management, 18 (6), pp. 394-410.
Gupta, N., & Adil, M. (2014 - 2015). Ascertaining the item structure of consumer based brand equity: a factor speciic approach. Journal of Services Research, 14, 2, pp. 107-125.
Gyrd-Jones, R., Helm, C. & Munk, J. (2013). Exploring the impact of silos in achieving brand orientation. Journal of Marketing Management, Vol. 29, Nos. 9–10, pp.1056–1078.
Hair, J.F., William, C.B., Babin, B.J., Anderson, R.E., & Tatham, R.L. (2006). Multivariate data analysis. New Jersey: Pearson University Press.
Harter, G., Koster, A., Peterson, M. & Stomberg, M. (2005). Managing Brands for Value Creation. Retrieved on 26/03/2015 from http://www.boozallen.com/media/ile/Managing_Brands_for_ Value_Creation.pdf
Haxthausen, O. (2009). Valuing brands and brand investments: Key learnings and future expectations. Journal of Brand Management, 17 (1), pp. 18-25.
Herrmann, A., Henneberg, S. & Landwehr, J. (2010). Squaring customer demands, brand strength, and production requirements: A case example of an integrated product and branding strategy. Total Quality Management, 21 (10), pp. 1017-1031.
Huang, R. & Sarigöllü, E. (2014). Assessment of brand equity measures. International Journal of Market Research, 56 (6), pp. 783-806.
Kalicanin, Dj., Veljkovic, S. & Bogetic, Z. (2015). Brand orientation and inancial performance nexus. Industrija, Vol.43, No.1, pp. 155-173.
Kao, C. & Hung, H-T. (2005). Development path of manufacturing irms: an empirical study. International Journal of Production Research, Vol. 43, No. 8, pp. 1573-1586.
Keller, K.L. (2012). Strategic Brand Management - Building, Measuring, and Managing Brand Equity, Fourth Edition, Pearson Education Limited.
Knowles, J. (2003). Value-based brand measurement and management. Interactive Marketing, 5 (July/September), pp. 40-50.
Kotler, P. & Keller, K.L. (2009). Marketing management, 13th edition. Prentice Hall.
Lee, J., Par, S. Y., Baek, I. & Lee C.S. (2008). he impact of the brand management system on brand performance in B–B and B–C environments. Industrial Marketing Management, No. 37, pp. 848–855.
Lennartz, E., Fischer, M., Krat, M. & Peters, K. (2015). Drivers of B2B Brand Strength – Insights from an International Study across Industries. Schmalenbach Business Review (SBR), Vol. 67, pp. 114-137.
M’zungu, S., Merrilees, B. & Miller, D. (2010). Brand management to protect brand equity: A conceptual model. Journal of Brand Management, Vol. 17, 8, pp. 605–617.
MacKenzie, S., Podsakof, P. & Podsakof, N. (2011). Construct Measurement and Validation Procedures in MIS and Behavioral Research: Integrating New and Existing Techniques. MIS Quarterly, Vol. 35, No. 2, pp. 293-334.
Martens, T. & Hilbert, A. (2011). Customer-value-based revenue management. Journal of Revenue and Pricing Management, Vol. 10, No.1, pp. 87–98.
Mizik, N. (2014). Assessing the total inancial performance impact of brand equity with limited time-series data. Journal of Marketing Research, 51 (6), 691-706.
Munoz, T. & Kumar, S. (2004). Brand metrics: Gauging and linking brands with business performance. Journal of Brand Management, 11 (5), pp. 381-387.
Narayan, G. (2012). Brand Valuation: A Strategic Tool for Business. IUP Journal of Brand Management, Vol. 9 Issue 3, pp. 55-64.
Otonkue, A. D. O., Edu, B. E. & Ezak, E. (2010). Accounting for Brands: Contemporary Issues and Alternative Options. he IUP Journal of Brand Management, 7 (1/2), pp. 105-115.
Pappu, R., Quester, P.G. & Cooksey, R.W. (2005). Consumer based brand equity: improving the measurement – empirical evidence. Journal of Product & Brand Management, Vol. 14 No. 3, pp. 143-154.
Peterson, Robert A. (1994). A Meta-Analysis of Cronbach’s Coeicient Alpha. Journal of Consumer Research, 21 (2), pp. 381–391.
Srinivasan, S. & Hanssens, D. (2009). Marketing and irm value: Metrics, methods, indings, and future directions. Journal of Marketing Research, 46 (June), pp. 293-312.
Tuominen, S., Laukkanen, T. & Reijonen, H. (2009). Market Orientation, Brand Orientation and Brand Performance in SMEs: Related Constructs? Proceedings of the Australian and New Zealand Marketing Academy Conference, Melbourne, Australia, November 30 - December 2, 2009.
Upotreba informaciono-komunikacionih tehnologija u Republici Srbiji (2014), Republički zavod za statistiku Srbije (Statistical Oice of the Republic of Serbia), Beograd.
Veljković, S. (2010). Brend menadžment u savremenim tržišnim uslovima. Ekonomski fakultet, Beograd.
Veloutsou,C., Christodoulides, G. & de Chernatony, L. (2013). A taxonomy of measures for consumer-based brand equity: drawing on the views of managers in Europe. Journal of Product & Brand Management, 22/3, pp. 238–248.
Verbeeten, F. & Vijn, P. (2010). Are Brand-Equity Measures Associated with Business-Unit Financial Performance? Empirical Evidence from the Netherlands. Journal of Accounting, Auditing & Finance, vol. 25 no. 4, pp. 645-671.
Wallace, E., Buil, I. & de Chernatony, L. (2013). Brand orientation and brand values in retail banking. Journal of Marketing Management, Vol. 29, Nos. 9–10, pp. 1007–1029.
Washburn, J.H. & Plank, R.E. (2002). Measuring brand equity: an evaluation of a consumer-based brand equity scale. Journal of Marketing heory and Practice, Vol. 10, No. 1, pp. 46-61.
Webster, F. (2000). Understanding the Relationships among Brands, Consumers, and Resellers. Journal of the Academy of Marketing Science, Vol. 28, No. 1, pp. 17-23.
Wong, H.Y. & Merrilees, B. (2007). Closing the marketing strategy to performance gap: the role of brand orientation. Journal of Strategic Marketing, 15 (December), pp. 387-402.
Wong, H.Y. & Merrilees, B. (2008). he performance beneits of being brand-orientated. Journal of Product Brand Management, 17, pp. 372–383.
Yeung, M. & Ramasamy, B. (2008). Brand value and irm performance nexus: Further empirical evidence. Journal of Brand Management, 15 (5), pp. 322-335.
Zednik, A. & Strebinger A. (2008). Brand management models of major consulting irms, advertising agencies and market research companies: A categorisation and positioning analysis of models ofered in Germany, Switzerland and Austria. Journal of Brand Management, Vol. 15, No. 5, pp. 301–311.